

Most states and the federal government have enacted some form of hate crimes legislation (Reference Jenness and GrattetJenness & Grattet 2001), yet there exists significant variation in the degree to which local law enforcement agencies enforce and comply with these laws. Participation in the federal Hate Crimes Statistics Act (HCSA, 1990), for instance, is considerably higher among policing agencies in the Northeast and the West relative to the South and Midwest (Reference McVeighMcVeigh et al. 2003). Hate crime reporting appears particularly scant in the historic “Black Belt” states. For example, only one law enforcement agency in Alabama and Mississippi combined submitted a hate crime incident report in 2000 (U.S. Department of Justice 2000: Table 12). But to what extent police compliance with hate crime law departs from compliance with general crime reporting mandates, and whether variation in compliance is at all attributable to minority group size, remains unknown. The task of the present research is to exploit jurisdictional variation in police compliance with the HCSA to investigate the impact of minority group size on an understudied and arguably undertheorized facet of social control—the formal social control of intergroup conflict.
Prior research demonstrates a robust association between minority group size in a geographic area and levels of government social control. The size of the black population, in particular, is positively associated with arrest rates (Reference Liska and ChamlinLiska, Chamlin et al. 1985), incarceration rates (Reference MyersMyers 1990), police force size (Reference Kent and JacobsKent & Jacobs 2005), police mobilization (Reference EarlEarl et al. 2003) and expenditures (Reference Jackson and CarrollJackson & Carroll 1987), legalization of capital punishment (Reference Jacobs and CarmichaelJacobs & Carmichael 2002), and support for punitive policies (Reference BaumerBaumer et al. 2003). This association between minority group size and criminal law is most frequently interpreted through the lens of group threat theory (Reference BlalockBlalock 1967), which posits that large minority populations threaten the majority group's hold on power, and thus state sanctions are employed to obviate such threats (Reference LiskaLiska 1992).
Despite extensive research in this theoretical tradition, at least two questions concerning the breadth and context of group threat theory persist. First, research almost exclusively employs minority group threat to explain types of social control that disproportionately affect racial minorities, such as incarceration rates (Reference Greenberg and WestGreenberg & West 2001), felon disenfranchisement laws (Reference BehrensBehrens et al. 2003), or minority arrest rates (Reference EitleEitle et al. 2002). Less research, however, investigates the association between minority group threat and facets of social control designed to protect minority populations, such as hate crime laws. Disputes that largely entail majority group offenders and minority group victims, such as hate crimes (Reference MessnerMessner et al. 2004), constitute “upward law” (Reference BlackBlack 1976:21–2) and may thus elicit minimal law enforcement. The present research builds on Black's insight in conjunction with the group threat thesis as advanced in the areas of law enforcement (Reference JacksonJackson 1989), civil rights law (Reference VinesVines 1964), and prejudice (Reference TaylorTaylor 1998; Reference QuillianQuillian 1996) to suggest that minority group size increases the use of law that adversely impacts minority groups but decreases the use of law aimed at protecting minorities. Law enforcement compliance with hate crime law is a useful venue for empirically investigating that proposition.
Hate crime laws explicitly address intergroup crime entailing animus (B. Reference LevinLevin 2001) and exhibit vast variation in their enforcement (Reference McVeighMcVeigh et al. 2003). In addition, compliance with hate crime law is both variable and a direct outcome of police decisionmaking, and whether police record crimes informs broader questions germane to government social control (Reference BlackBlack 1970, Reference Black1976). Assessing compliance with federal hate crime law allows for a better understanding of how policing agencies implement laws that were championed by marginalized groups and that may be viewed as protecting minority populations. Police department noncompliance with the HCSA, particularly when that agency complies with other federal data collection mandates, illustrates an ambivalence or aversion toward laws that address crime motivated by bigotry. To that end, and in line with research on crime reporting as an important facet of government social control (Reference Kitsuse and CicourelKitsuse & Cicourel 1963; Reference BlackBlack 1970, Reference Black1971; Reference EriksonErikson 1966; see Reference Borg and ParkerBorg & Parker 2001 on clearance rates), investigating compliance with hate crime law is a salient issue for investigating state responses to intergroup conflict.Footnote 1
Beyond this inquiry into the context of minority group threat as pertaining to hate crime law, this research also casts light on a burgeoning issue in the study of state social control and the gap between legal codes and their actual implementation. Reference Jenness and GrattetJenness and Grattet (2005) draw attention to this gap between law in the books and law in action in their recent work on organizational permeability and policy implementation. Consonant with ideas germane to organizations and law (Reference EdelmanEdelman 1990, Reference Edelman1992) and community policing (e.g., Reference Greene and HorneyGreene 2000), Jenness and Grattet suggest that policy innovations are implemented where organizations are more “permeable,” or where an organization is more susceptible to community influence and where the organization's culture aligns with a policy innovation. It remains less clear whether organizational permeability, indicated through police-community interaction, predicts actual compliance with hate crime initiatives above and beyond compliance with general crime reporting initiatives. The association, or lack thereof, between organizational structure or culture and legal outcomes bears on arguments concerning the utility of organizational theory in the realm of law enforcement (Reference KatzKatz 2001; Reference Crank and LangworthyCrank & Langworthy 1992) and the efficacy of hate crime law. I examine the association between compliance with federal hate crime law and one facet of law enforcement organization, the degree to which community policing is implemented, while statistically accounting for compliance with government requests for general crime data.
In sum, this work investigates variation in compliance with hate crime law to test (1) the impact of minority group size on the social control of intergroup conflict, (2) whether regional variation exists in this association, and (3) the relationship between police-community linkages and the efficacy of hate crime law. The following section reviews existing work on hate crime law and its implementation, noting unexplored questions in this area of inquiry. I then return to the questions introduced above to generate three hypotheses derived from group threat and institutional theories. Finally, I test these hypotheses using data on large U.S. policing agencies.
Hate Crime Law and Implementation
Hate crimes legislation surfaced on the legal landscape in the early 1980s and quickly diffused across the United States during the subsequent two decades (Reference MorschMorsch 1991; Reference GrattetGrattet et al. 1998; Reference Soule and EarlSoule & Earl 2001). By 2000, more than 40 states and the federal government had enacted some form of hate or bias crimes legislation, although the specific provisions and groups protected under hate crime statutes differ from state to state (Reference Jenness and GrattetJenness & Grattet 2001; Reference Jacobs and PotterJacobs & Potter 1998).
Hate crime laws typically take one of two forms.Footnote 2 One type of hate crime law deals with criminal sanctions, often prescribing penalties for crimes motivated in whole or in part by prejudice or bigotry based on race, religion, ethnicity, sexual orientation, or a number of other group-defining characteristics (U.S. Department of Justice 2002; Reference Jenness and GrattetJenness & Grattet 2001). For example, in 1994, President Bill Clinton signed into law the Hate Crimes Sentencing Enhancement Act, as part of the 1994 Violent Crime Control and Law Enforcement Act (Public Law 103–322), which increased penalties for federal crimes where the victim was selected because of his or her race, color, religion, national origin, ethnicity, gender, sexual orientation, or disability.Footnote 3
A second type of hate crime law is administrative in nature and mandates the collection of hate crime data by local law enforcement. The most recognizable data collection statute is the HCSA, which I analyze in this research. Former President George H. W. Bush signed the HCSA into law amidst largely bipartisan support in 1990.Footnote 4 The HCSA requires the U.S. Department of Justice (DOJ) to acquire and publish data about crimes that manifest prejudice based on certain group-defining characteristics.
The Attorney General shall acquire data, for the calendar year 1990 and each of the succeeding four calendar years, about crimes that manifest evidence of prejudice based on race, religion, sexual orientation, or ethnicity, including where appropriate the crimes of murder, non-negligent manslaughter; forcible rape; aggravated assault, simple assault, intimidation; arson; and destruction, damage or vandalism of property (Hate Crimes Statistics Act, sec. b[1], 28 USC 534 [1990]).
Four years later, as part of the Violent Crime Control and Law Enforcement Act of 1994, the HCSA was modified to include disability among the protected categories (Public Law 103–322) and was later amended to be carried out “for each calendar year” instead of “the succeeding four years” (Church Arson Prevention Act of 1996; Public Law 104–155). Since the HCSA called for the collection of crime data, the FBI's Uniform Crime Reporting (UCR) program undertook the responsibility of collecting and disseminating hate crime information.
The HCSA has been plagued with problems, partly resulting from the requirement that the federal government gather and disseminate information on hate crime while participation by local law enforcement remains voluntary. The crime reporting program received tenuous support from local law enforcement agencies in its infancy, with fewer than 3,000 police departments covering less than 50 percent of the U.S. population participating in 1991. The number of agencies and the population covered by reporting agencies increased sharply between 1991 and 1996, particularly after 1994, when the collection of hate crime data became a permanent fixture of the UCRs. Law enforcement agency participation then tapered off and even decreased for a few years before leveling off between 1999 and 2002. By 2002, more than 12,000 law enforcement agencies representing more than 85 percent of the U.S population participated in the program, although participation was not randomly distributed across the United States (Reference McVeighMcVeigh et al. 2003).
The passage of hate crime laws generated a sizeable research literature on their implementation and enforcement, with extant work largely examining two issues. One body of research investigates the process of labeling crimes as “hate crimes,” focusing on how frontline personnel assess the role of hatred or bias in the incident (Reference MartinMartin 1995, Reference Martin1996; Reference BoydBoyd et al. 1996; Reference BellBell 2002). A second line of research explains geographic variation in compliance with hate crime initiatives and hate crime reporting (Reference Haider-MarkelHaider-Markel 1998; Reference MedoffMedoff 1999; Reference McVeighMcVeigh et al. 2003). Reference McVeighMcVeigh and colleagues (2003), for instance, treat hate crime reporting as a successful outcome of social movement mobilization, finding higher reporting where there is greater civil rights activism, particularly in Democratic strongholds where civil rights issues resonate with political elites.
While prior research on hate crime policing provides insight into police officers' views on hate crime and factors influencing reporting, the present research goes beyond prior work in two distinct ways. First, empirical research on hate crime reporting treats either states (Reference Haider-MarkelHaider-Markel 1998; Reference MedoffMedoff 1999) or counties (Reference McVeighMcVeigh et al. 2003) as the units of analysis. As a consequence, prior work does not investigate potentially important interstitial variables such as organizational characteristics of law enforcement agencies. The law enforcement agency, as opposed to the state or county, ultimately decides how many hate crimes occurred in a jurisdiction and whether to report these to the state. Incorporating organizational characteristics that are salient in the realm of administrative law (Reference EdelmanEdelman 1992; Reference Kelly and DobbinKelly & Dobbin 1999) is potentially fruitful for understanding implementation in criminal law as well (Reference Crank and LangworthyCrank & Langworthy 1992). Further, Reference Jenness and GrattetJenness and Grattet (2005) find that institutional characteristics of criminal justice agencies partly explain police department implementation of written hate crime policies. Building on this insight, I examine how the institutional arrangements of law enforcement agencies influence law enforcement actions, in this case compliance with federal law.
Second, research largely frames the investigation of hate crime law as a case study for policy implementation (Reference Jenness and GrattetJenness & Grattet 2001; Reference GrattetGrattet et al. 1998; Reference Haider-MarkelHaider-Markel 1998) or social movement mobilization (Reference McVeighMcVeigh et al. 2003). At the same time, prior research on organizational compliance largely tests rational choice (Reference Braithwaite and MakkaiBraithwaite & Makkai 1991) or neo-institutional theories (Reference Kelly and DobbinKelly & Dobbin 1998, Reference Kelly and Dobbin1999; Reference EdelmanEdelman et al. 1999; Reference Dobbin and SuttonDobbin, Sutton, et al. 1993; Reference GouldGould 2001, Reference Gould2005). I suggest that theories of formal social control provide theoretical leverage for explaining compliance by law enforcement agencies. The following sections expound the relevance of this theoretical framework for the study of hate crime law.
Theoretical Framework
Minority Group Threat and Hate Crime Law
A wealth of research on social control and criminal punishment suggests that the racial composition of places is a salient predictor of state social control. Scholars frequently interpret this association as evidence supporting group threat theory (Reference BlalockBlalock 1967), or the specific variant of racial threat theory.Footnote 5 The group threat thesis proffers that large minority populations constitute threats to majority groups and to existing social and political order (Reference BlalockBlalock 1967) and that a minority underclass signals the potential for lawlessness (Reference Chambliss and SeidmanChambliss & Seidman 1982). The state invokes criminal sanctions to suppress these threats, maintain the majority group's sphere of exclusiveness, limit minority group advancement, and maintain existing power arrangements (Reference LiskaLiska 1992). Law is an instrument through which dominant (usually majority) groups maintain power and exercise control over “threatening” populations. Accordingly, group threat theory predicts higher levels of formal social control where minority group size is large.
Research largely supports this premise. The size of the minority, namely black, population is positively associated with several measures of state social control. Reference Greenberg and WestGreenberg and West (2001), for example, find that states with larger black populations have higher incarceration rates, net of crime rates and economic conditions (see also Reference MyersMyers 1990). Reference Jacobs and CarmichaelJacobs and Carmichael (2002) similarly conclude that states with larger black populations more quickly legalized the death penalty following the Gregg v. Georgia (1976) Supreme Court decision that determined capital punishment was again constitutional after a brief pause. Black population size is also associated with the certainty of arrest (Reference Liska and ChamlinLiska, Chamlin et al. 1985), police presence and expenditures (Reference JacksonJackson 1989; Reference Jackson and CarrollJackson & Carroll 1987; Reference Liska and LawrenceLiska, Lawrence et al. 1981), police force mobilization (Reference EarlEarl et al. 2003), criminal justice expenditures (Reference Jacobs and HelmsJacobs & Helms 1999), and support for capital punishment (Reference BaumerBaumer et al. 2003). In each case, larger black populations are associated with punitive actions.
In a recent expansion of this perspective, Reference BehrensBehrens et alia (2003) emphasize a political facet of group threat models in their work on felon disenfranchisement policies in the United States. According to the authors, “as subordinate groups grow in (relative) size, they may be able to leverage democratic political institutions to their advantage” (2003:574). Consonant with this idea and the racial threat hypothesis, Behrens and colleagues conclude that states passed felon disenfranchisement laws largely as a means to hinder black mobilization in the political sphere.
The conclusions of Reference BehrensBehrens et alia (2003) raise an intriguing question concerning hate crime law: if laws that adversely impact black populations are implemented to disrupt political and legal mobilization, then how might criminal justice agencies respond to a type of law that deals with intergroup conflict and a type of crime that disproportionately involves minority group (often black) victims and majority group (white) offenders?Footnote 6 On the one hand, the passage of hate crimes legislation may signal the state's willingness to direct additional resources toward the problem of crime motivated by prejudice. On the other hand, legislatures may institute hate crime laws for symbolic purposes (Reference GrattetGrattet et al. 1998:299), in which case policy may be decoupled from implementation and enforcement (Reference Meyer and RowanMeyer & Rowan 1977; Reference EdelmanEdelman et al. 1999). What, then, does the group threat framework, and specifically the racial threat variant, predict concerning law enforcement compliance with hate crime law?
The logic of group threat theory suggests that the size of the black population is inversely associated with hate crime law compliance. That is, law enforcement agencies are less likely to comply with federal hate crime initiatives in jurisdictions with large black populations. This hypothesis aligns with prior research on resistance to social policies promoting minority group advancement (e.g., affirmative action). For instance, Giles and Evans' analysis of public opinion data indicates that individuals “in counties with high black concentrations are significantly … more opposed to government policies aiding blacks than are respondents in counties with low black concentrations” (1986:477). Related work on Southern race relations court cases finds that pro-black (often pro-integration) decisions were inversely related to black population size (Reference VinesVines 1964). This pattern agrees with related sociological research finding greater resistance to race-targeting policies designed to promote racial equality among whites in largely black areas (Reference TaylorTaylor 1998; Reference GlaserGlaser 1994; Reference QuillianQuillian 1996). If minority group presence decreases support for policies viewed as favorable to minorities, and hate crime law was largely championed by minority groups, then according to the group threat thesis the probability of complying with hate crime law decreases as minority group size increases. This hypothesis is intriguing and consequential in light of extant research indicating higher levels of hate crime offending where minority group size is increasing (Reference GreenGreen et al. 1998).
As articulated in the previous section, hate crime laws do not solely focus on race. However, I focus on black population size in this research for three reasons. First, extant work on criminal punishment finds that black population size is associated with levels of social control more so than the presence of other minority groups, such as Hispanics (e.g., Reference Jacobs and CarmichaelJacobs & Carmichael 2002 on the death penalty; see Reference TaylorTaylor 1998 on race prejudice and minority population size). Related research on labor markets and intergroup conflict also suggests that immigration and competition over jobs has cultivated greater violence against blacks than other groups (Reference OlzakOlzak 1989, Reference Olzak1992). Reference Bobo and HutchingsBobo and Hutchings (1996) further contend that conflict with blacks is greater than other forms of intergroup conflict due to the depth of interracial relations throughout U.S. history.
Second, Reference BlalockBlalock (1967) suggests that minority group size is of paramount importance for theories emphasizing threat. Blacks in the United States represent a numerically large minority constituency relative to other minority groups, such as homosexuals or religious minorities (e.g., Jews or Muslims). Given that numeric size is an intricate component of the group threat framework, elevated perceptions of threat may arise only from numerically large minority groups.
Third, available data on hate crime offenses suggest that blacks are more prone to hate crime victimization than other groups (U.S. Department of Justice 2002). Accordingly, majority groups may perceive blacks as receiving more protection from hate crime laws. This is particularly relevant in light of prior work finding more heated opposition to government involvement in programs perceived as benefiting blacks (Reference QuillianQuillian 1996).
In short, I suggest that at least one predictor of formal social control, the racial composition of places, should have an entirely different effect for laws that are protective of minorities than for laws that disproportionately sanction minorities. Yet I also argue that the effect of black population size on police compliance with hate crimes legislation is contingent on social context.
The Context of Minority Group Threat
The association between minority group threat and hate crime law compliance is likely conditioned by cultural differences associated with geographic region. Specifically, I suggest that black population size is strongly associated with hate crime law compliance in the South, and to a lesser extent the Midwest, relative to the Northeast and the West. Two rationales underlie this hypothesis.
First, classic group threat formulations view discrimination and threat as developing historically (Reference BlumerBlumer 1958), and hence minority group threat is more consequential in the wake of intergroup conflict. Prior work focusing on the South during both the pre- and post-civil rights movement shows strong support for racial threat arguments with respect to voting registration (Reference Matthews and ProthroMatthews & Prothro 1963), judicial decisionmaking (Reference VinesVines 1964), and electoral support for segregationist or right-wing candidates (Reference HeardHeard 1952; Reference Giles and BucknerGiles & Buckner 1993, Reference Giles and Buckner1996). Moreover, Reference JacksonJackson (1986, Reference Jackson1989; see 1992 for discussion) suggests that minority group size has a particularly strong association with police expenditures in the South, where interracial conflict has been especially heated (see also Reference Kent and JacobsKent & Jacobs 2005:736). Related work on the contingent nature of minority group threat yields comparable findings concerning culture and minority group size. The statistical relationship between black population size and death sentences, for instance, is contingent on the historical legacy of lynching (Reference JacobsJacobs et al. 2005). Given the interracial turmoil pervading the American South throughout much of its history and cultural continuity with respect to discrimination and social control practices (Reference WacquantWacquant 2000; Reference ZimringZimring 2003), perceptions of threat may influence law in the South more so than other regions. Hence, hate crime laws could meet the greatest resistance in Southern jurisdictions with large black populations. This remains at present an unanswered, yet empirically testable proposition.
Second, group threat theory largely views prejudice and social control as reactionary mechanisms to mitigate potential power acquisitions by “subordinate” groups (Reference BlalockBlalock 1967). To that end, threat is typically indicated by minority group size and the perceived acquisition of minority group political power (Reference BehrensBehrens et al. 2003). Relative to other regions, the South is characterized by a large black population, and blacks have greater representation in the U.S. Congress relative to the West or Northeast. The only region equivalent to the South with respect to black representation in Congress is the Midwest.Footnote 7 The Midwest is intriguing in this regard because it ranks second to the South on factors theoretically associated with hate crime law outcomes, such as political conservatismFootnote 8 and black political representation (see footnote 7). The prevalence of hate crime reporting in the Midwest is also comparable to the South and lags behind the Northeast and West (Reference McVeighMcVeigh et al. 2003). Yet the role of racial threat in the Midwest receives little attention in the respective literatures on prejudice and law, and in this case at the confluence of these themes in hate crime law.
Regional variation in the relationship between black population size and legal outcomes is consequential because it tempers the notion that minority group size ubiquitously indicates threat. Rather, and in line with original formulations of group position and collective threat models (Reference BlumerBlumer 1958), minority group size is predictive of prejudice and social control in the wake of historically adverse relations where groups have defined their position relative to one another. Theoretically, such a relationship contextualizes the concept of minority group threat. Such a contextual association does not imply that race relations are homogeneous within regions. The underlying assumption is that, on average, black population size connotes greater threat in the South and Midwest relative to the Northeast and West.
Institutional Arrangements and Hate Crime Law Compliance
Institutional accounts of social control (Reference SavelsbergSavelsberg 1994; Reference SuttonSutton 2000) and neo-institutional research on organizational responses to law (Reference EdelmanEdelman 1990, Reference Edelman1992; Reference Kelly and DobbinKelly & Dobbin 1999) maintain that the institutional arrangements of states or organizations are critical for understanding government social control and policy implementation. By institutional arrangements I refer to links between government agencies and the public sphere, the degree of bureaucratization, means of organizing office practices and handling workloads, differentiation in the division of labor, and connections with other agencies. Just as organizational characteristics differ among profit-seeking organizations, variation also exists across law enforcement agencies (Reference MaguireMaguire 2003), and such differentiation may be associated with responses to policy innovations in a legal field (Reference Jenness and GrattetJenness & Grattet 2005). Neo-institutional scholarship in the United States demonstrates that organizations often mediate the effect of law on society and that various organizational types respond to law differently (Reference EdelmanEdelman 1990, Reference Edelman1992; Reference Kelly and DobbinKelly & Dobbin 1999; Reference EdelmanEdelman et al. 1999). Reference EdelmanEdelman's (1992) research on organizational responses to equal employment opportunity and affirmative action laws, for example, finds that organizations with linkages to the public sphere implement policies at higher rates than private-sector businesses. From this perspective, linkages to the legal environment render the organization more or less susceptible to influence from the public sphere.
Organizational attributes may thus be associated with law enforcement responses to hate crime. In this case, I give particular attention to one element of law enforcement organization: the degree to which the law enforcement agency organizes around the concept of community policing. The degree of communication between law enforcement agencies and their communities is potentially salient for two reasons. First, departments engaging in community policing are generally more responsive to proactive initiatives (Reference Kelling and ColesKelling & Coles 1996; Reference FriedmannFriedmann 1992; Reference GoldsteinGoldstein 1990; Reference Kelling and MooreKelling & Moore 1988; Reference FieldingFielding 1995; Reference Eck and KnuttsenEck 2003; National Research Council 2004; Reference Greene and HorneyGreene 2000) such as identifying increases in specific types of crime. It follows that provisions of the HCSA would align with a policing philosophy that takes seriously the acquisition and analysis of crime information to identify hot spots. Second, and of particular theoretical importance, just as personnel professionals in the private sector act as windows to the legal environment and help translate legal norms into organizational policies (Reference EdelmanEdelman 1990; Reference Dobbin, Edelman and ZuckerDobbin, Edelman, et al. 1988), community liaisons are similarly positioned to respond to the demands of their local environment. Elaborating networks and increasing connections among groups in an institutional environment, which is consonant with the community policing ideal, results in new organizational structures, procedures, or policies (Reference Crank and LangworthyCrank & Langworthy 1992). To this end, Reference Jenness and GrattetJenness and Grattet (2005) expound the concept of organizational permeability, or the susceptibility of an organization to its social or legal environment. The authors specifically point to the community-organization nexus as a salient facet of permeability, largely because organizations with linkages to their community increase exposure to external demands. Reference Jenness and GrattetJenness and Grattet (2005) find that hate crime policies, in turn, are positively associated with the level of police-community interaction. Building on this insight, I examine the influence of community policing on compliance with hate crime law independent of the department's propensity to comply with other federal crime reporting programs. The data for this analysis are presented in the following section, and the hypotheses are formally stated in Table 1.
Table 1. Hypotheses Predicting Hate Crime Law Compliance

Data
The primary data set for this analysis is the 2000 Law Enforcement Management Statistics Survey of Law Enforcement Agencies (LEMAS, hereafter),Footnote 9 a mail survey of law enforcement agencies conducted in summer 2000 (U.S. Department of Justice 2001). The survey includes detailed organizational data on law enforcement agencies, including department staffing, various functions of the agency, police force demographics, and management and personnel.
The 2000 LEMAS survey is a stratified random sample of law enforcement agencies containing information on 2,985 agencies, including the respective state patrols, municipal and county police departments, sheriffs' departments, and special police such as campus departments and tribal police in Native American communities.Footnote 10 A questionnaire was mailed to 3,132 policing agencies. Approximately 67 agencies were “out-of-scope”Footnote 11 and a total of 2,985 agencies responded, for a response rate of 97.4 percent. Respondents included 1,925 municipal police departments, 36 county police agencies, 961 sheriffs' departments, 14 tribal police departments, and 49 state police departments. In this work I focus only on large municipal and county policing agencies. The analysis includes only large police departments because they deal with a sizeable proportion of interpersonal offenses in the United States (National Research Council 2004:49) and very small police departments may encounter few intergroup crimes, including hate crimes. Moreover, since organizational size is associated with organizational complexity (Reference LangworthyLangworthy 1986; Reference MaguireMaguire 2003), the focus on community policing may have little relevance for very small departments.Footnote 12 The LEMAS methodology divides the sample into “self-representing” and “non-self-representing” agencies, where the former consists of policing agencies with 100 or more sworn full-time equivalent employees.Footnote 13 I include only these self-representing agencies (100 or more full-time equivalent officers) in this analysis.
Sheriffs' departments were not included in the analysis for two reasons. First, I sought to avoid overlapping jurisdictions. Sheriffs' departments may include a populated city yet patrol largely rural areas outside of a major metropolitan area. Second, municipal and county police departments largely have law enforcement responsibilities, whereas sheriffs' departments are responsible for staffing local courts and jails or transporting suspects in custody. Focusing solely on municipal and county agencies allows for an analysis of departments with confined jurisdictions having the primary responsibility for law enforcement and investigation in their jurisdictions.
Variables
Dependent Variable
The dependent variable indicates whether or not the policing agency complied with the provisions of the HCSA in 2000. This information was furnished by the DOJ and then merged with the LEMAS data.Footnote 14 The HCSA requires the U. S. Attorney General to collect information on the prevalence of hate crime in the United States, yet participation in this program is largely voluntary.Footnote 15 As argued above, the study of crime reporting informs broader ideas on state social control (Reference Kitsuse and CicourelKitsuse & Cicourel 1963; Reference BlackBlack 1970, Reference Black1971; Reference EriksonErikson 1966). Hate crime law is a state response to intergroup conflict, and compliance is both variable and a direct outcome of police decisionmaking. The task of the present research is to assess jurisdictional variation in police compliance with this law to investigate the respective impact of minority group threat and police-community interaction on the formal social control of crime motivated by bigotry.
I measure hate crime law compliance using two separate measures. One outcome variable indicates any compliance with federal hate crime law. Law enforcement agencies are requested to send quarterly reports, and hence some agencies “partly comply” by submitting data one, two, or three quarters during the year. Using this measure of any compliance, all agencies that submitted hate crime data in compliance with the HCSA at least one quarter during the year are coded 1, with absolute noncompliers coded 0. This variable has the advantage of isolating those agencies that failed to comply at all in 2000. The second measure is derived from the same data, but only those agencies that reported all four quarters during 2000 are coded 1, while noncompliers and partial compliers represent the reference group (coded 0). I refer to this variable as full compliance. The full compliance measure isolates those agencies that fully complied as opposed to those that may have ceremonially submitted data one or two quarters during the year. In addition, this variable includes a larger reference group (those coded 0), which provides statistical leverage when assessing race-region interaction effects. As described below, the very small number of complete noncompliers in the West and Northeast limits the statistical power to assess some statistical interactions of theoretical interest.Footnote 16
It is possible, if not likely (Reference McDevittMcDevitt et al. 2000; Reference LevinJ. Levin 2002:14), that many agencies comply with the law by formally submitting data yet report “zero” hate crime offenses for the quarter or year. Without corroborating victimization data on hate crime offending, it is impossible to discern whether no hate crimes occurred or whether police refuse to categorize offenses as “hate crimes.” To this end, I do not measure the number of hate crimes reported as employed in prior research (Reference McVeighMcVeigh et al. 2003; Reference MedoffMedoff 1999), as this entails assumptions about rates of actual hate crime offending. When using the categorical measure of compliance, all agencies, whether or not they actually experienced crimes potentially motivated by bigotry, can show a minimal level of compliance with the HCSA regardless of the actual prevalence of hate crime incidents. The dependent variable thus has the advantage of making no assumptions about hate crime offending levels, as agencies can comply with the law by reporting zero hate crime offenses. Importantly, the models account for law enforcement agency participation in the general UCR program. With this important control variable in the analysis, I maintain that noncompliance with the HCSA when accounting for the degree of compliance with crime reporting generally indicates an aversion toward the specific hate crime mandate.
Independent Variables
The independent variables of primary interest in this analysis are black population size in the jurisdiction, regional location of the police department, and the police department's organizational structure commensurate with community policing. Black population size is measured using 2000 U.S. Census data, calculated as the percentage of the population identifying as black in the police department's jurisdiction (cities for municipal agencies and counties for county agencies). Region is coded according to the four categories used by the U.S. Census Bureau.Footnote 17
Community policing is operationalized using a battery of questions from the LEMAS survey concerning specific activities or structures in place that align with community policing ideals. Although the concept of community policing is difficult to define (Reference Greene and MastrofskiGreene & Mastrofski 1988; Reference Eck, Rosenbaum and RosenbaumEck & Rosenbaum 1994) and nuances exist across law enforcement jurisdictions, a set of common characteristics underlie community policing. For instance, policing scholars associate community policing with an emphasis on problem-solving (Reference FieldingFielding 1995; Reference MaguireMaguire 2003:126; Reference GoldsteinGoldstein 1990; Reference SkoganSkogan et al. 1999), citizen involvement (Reference FriedmannFriedmann 1992; Reference Trojanowicz and BucquerouxTrojanowicz & Bucqueroux 1990), assignment of officers to specific geographic areas (Reference FieldingFielding 1995:198–9; Reference MaguireMaguire 2003:124–6; Reference FriedmannFriedmann 1992; Reference Kelling and MooreKelling & Moore 1988; Reference SkoganSkogan et al. 1999), and evaluation of citizen satisfaction with police performance (Reference Glensor and PeakGlensor & Peak 1998). Accordingly, implementing community policing requires police officer training and educating citizens. The LEMAS data provide measures consonant with these dimensions of community policing, which I use to create a community policing index comprising 11 indicators. The 11 dummy indicators were summed to create a community policing index with a standardized Cronbach's alpha reliability value of 0.67.Footnote 18
The models include a number of statistical controls that are potentially correlated with both hate crime law compliance and community policing. Since larger departments may have additional resources to direct toward hate crime policing, I control for police department size and resources as indicated by the number of full-time sworn officers employed by the department.Footnote 19 I also measure department professionalization because better educated police forces may be more attuned to changes in federal and state law and thus more likely to implement policies or comply with federal mandates. I measure professionalization by the minimum education requirements for new police recruits. This is an ordinal variable ranging from 0 (no requirements) to 4 (four-year college degree required). In addition, the models include a control variable for police officer heterogeneity relative to the area served by the police department. This measure rests on the proposition that hate crime laws may receive greater attention where minority groups are well-represented in the police organization. I thus include a dummy variable where a value of 1 indicates that the proportion of black police officers exceeds the black proportion of the city (for municipal agencies) or county (for county agencies). A value of 0 indicates lesser or equal representation of blacks on the police force relative to the community.Footnote 20 Beyond these characteristics of the police department, I also control for the employment rate in the city to account for economic conditions, since employment security may buffer perceptions of threat. The percentage of the city or county population residing in rural areas is also statistically controlled because crime rates, intergroup contact, and community policing are all potentially correlated with rural versus urban location.
Finally, I include two additional control variables. First, some states have hate crime data collection statutes independent of the HCSA. I thus include a dummy variable indicating whether a state statute is present, as this could increase police department compliance with the HCSA for all departments in the state. Second, the models account for whether the department reported crime other than hate crime. I measure this by the number of months the law enforcement agency submitted any crime data in conjunction with the UCRs in 2000. This is an important statistical control because it is feasible that police departments that do not respond to hate crime initiatives may not respond to any federal crime reporting mandates, which would suggest no specific aversion toward hate crime laws. Descriptive statistics for all variables are provided in Table 2.Footnote 21
Table 2. Descriptive Statistics for Dependent and Independent Variables for Large Policing Agencies* in the United States

* Large policing agencies refer to those with 100 or more full-time equivalent officers.
Method and Modeling
To test the effects of race, region, and community policing on compliance with the HCSA independent of other explanatory variables, I employ binary logistic regression. Logistic regression models are appropriate for dichotomous outcomes and allow for both categorical and continuous independent variables. Coefficients in logistic models can also be interpreted as odds that indicate the change in the likelihood of the outcome variable per unit change in the predictor variable (Reference Bohrnstedt and KnokeBohrnstedt & Knoke 1994:342). Since the units of analysis (law enforcement agencies) are nested within states, the independence assumption of regression analysis could be violated, thus potentially yielding correlated errors and inflated t-values. All analyses thus account for such nesting of agencies within states by adjusting the standard errors using the Huber-White sandwich estimate of variance (Reference RogersRogers 1993) via the “cluster” option in Stata 9.1.Footnote 22
Findings
Figure 1 illustrates regional variation in hate crime law compliance when accounting for general crime reporting and the presence of a state hate crime law. The bars in Figure 1 indicate the percentage of law enforcement agencies within each region that complied with federal government requests for general crime information but did not comply with the hate crime provision as stipulated by the HCSA.Footnote 23 The black and white patterned bars refer to comparisons of all large policing agencies in the sample, while the gray bars represent comparisons when excluding states without hate crimes legislation in 2000.Footnote 24 This comparison indicates that law enforcement agencies in the Northeast and West are less likely than the South and Midwest to discern general crime reporting from hate crime reporting. Only 2 percent of policing agencies in the Northeast and another 5 percent in the West did not comply with the provisions of the HCSA, relative to noncompliance rates of 18 percent in the South and Midwest each.Footnote 25 These results change very little when omitting states without hate crime laws (Figure 1, gray bars), where the percentages for the South and Midwest decrease to 16 and 12 percent, respectively, while the Northeast and West remain below 5 percent. Regional variation in compliance with hate crime law is thus apparent, even when accounting for state laws and general crime reporting.
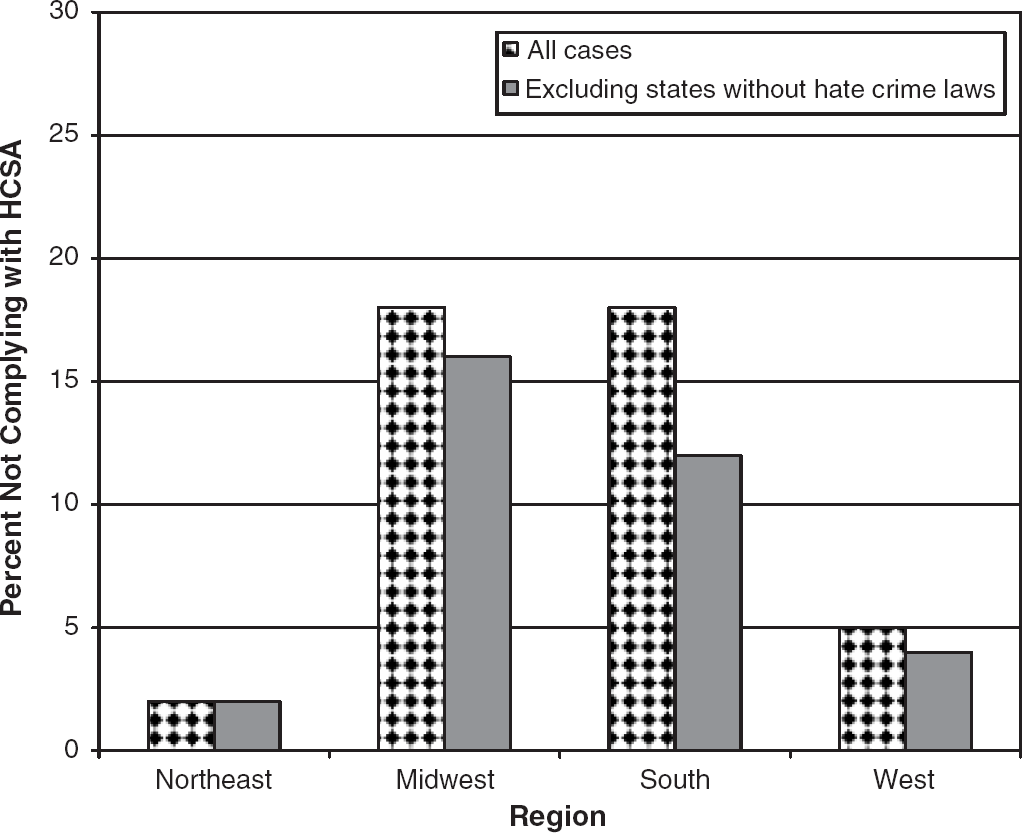
Figure 1. Law Enforcement Agencies Complying with the UCR But Not the HCSA by Region for All Cases and Excluding States Without Hate Crime Laws.
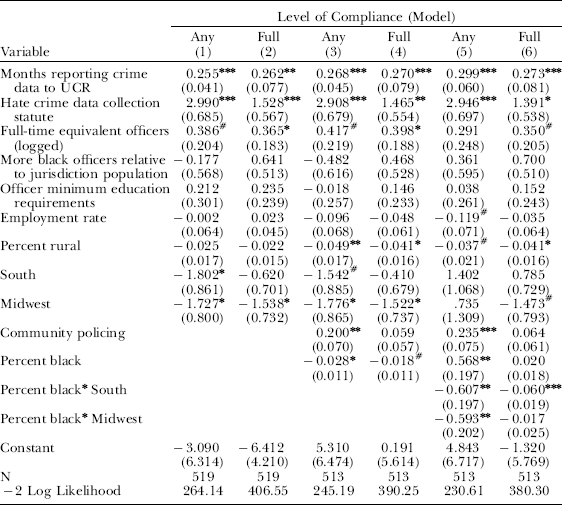
Table 3 reports the coefficients for partial and full compliance with the HCSA regressed on the focal independent and control variables, including a control for propensity to report any crime data. The bivariate correlation depicted in Figure 1 largely persists when controlling for legal, organizational, and community factors in the logistic regression model. The odds of any compliance (Model 1) in the South and Midwest decrease by approximately 80 percent (e −1.802 and e −1.727) relative to the West and Northeast. In addition, the coefficients in Model 1 suggest that any compliance with the HCSA is positively correlated with general crime reporting (b=0.255) and the presence of a data collection statute (b=2.990). However, the number of black officers relative to the general population, officer minimum education requirements, the employment rate, and the percent rural are not significantly associated with this compliance measure. The results are similar when predicting full compliance relative to non- and partial compliance (Model 2). The only notable exception is that the dummy variable for the South is no longer statistically significant in Model 2, suggesting that Southern jurisdiction is a better predictor of any compliance than full compliance. That is, police departments in the South are less likely than those in the Northeast and West to comply one or more quarters, but Southern departments that do report hate crime data tend to fully comply at rates comparable to the West and Northeast, net of the statistical controls.Footnote 26
Table 3. Logistic Regression Coefficients for Analyses of Large Municipal and County Policing Agencies (With Adjusted Standard Errors): Compliance With the HCSA on Organizational, Community, and Regional Predictor Variables
Note: Standard errors are in parentheses. All models adjust the standard errors for nesting of units within states using the cluster option in Stata 9.1.
# p<0.10,
* p<0.05,
** p<0.01,
*** p⩽0.001 (all tests two-tailed).
Models 3 and 4 in Table 3 add community policing and black population size to the respective equations. Looking first at any compliance (Model 3), the hypothesis predicting a significant association between hate crime law compliance and community policing finds support in this model. Each unit increase in the community policing index increases the odds of any compliance with the HCSA by 22 percent (e 0.200). Moreover, black population size is negatively associated with this measure of compliance. Each percentage increase in black population size decreases the odds of compliance by about 3 percent (e −0.028). Also noteworthy in this model is that the effect of Southern region weakens relative to Model 1 when black population size is considered.Footnote 27
The results are not as strong when predicting full compliance with the HCSA (Model 4). Coefficients are in the same direction as in Model 3, but Model 4 suggests that community policing does not significantly distinguish full compliance from non- and partial compliance.Footnote 28 In similar fashion, black population size has a weaker effect with respect to coefficient size and significance when predicting full compliance (Model 4) compared to any compliance (Model 3). The picture that emerges from these models is that region, community policing, and racial demographics significantly predict whether law enforcement agencies comply at all with federal hate crime law. Race, region, and community policing, however, are less salient when distinguishing between full and partial compliers.
To further understand the association between race, region, and law enforcement responses to hate crime, Models 5 and 6 report the interaction coefficients between race and region. The coefficients for any hate crime law compliance (Model 5) should be interpreted cautiously. Very few police departments in the West and Northeast were coded as complete noncompliers, and thus some coefficients and standard errors appear unusually large.Footnote 29 Mindful of this limitation, the coefficients are consistent with the hypothesis that black population size is negatively associated with hate crime law compliance in the South and the Midwest relative to the West and Northeast. Model 6, which compares complete compliers to partial and noncompliers, provides more stable coefficients because the reference category is not plagued by extremely small numbers. With one exception, the results in Model 6 reflect those in Model 5. A significant race-region interaction is apparent, but it appears isolated to the South. The main effect for percent black (0.020) indicates a positive correlation between black population size and full compliance in the Northeast and West. Yet a sizeable negative effect is apparent for the South, where each percentage increase in black population size is associated with a 4 percent decrease (e 0.02–0.06) in the odds of full compliance. Black population size thus influences hate crime law compliance, but the effect is not ubiquitous.Footnote 30
The contingent association between black population size and hate crime law compliance is illustrated in Figure 2.Footnote 31 This figure shows the predicted probabilities of full compliance with the HCSA by percent black and region. As depicted in the figure, compliance with federal hate crime law increases with black population size in the Northeast. A similar pattern emerges for the West, albeit with a slight decline at larger values of black population size (but still remaining above 0.9). Law enforcement agencies in the Midwest, where no blacks reside, are the least likely to comply with the HCSA, and this effect changes very little as the percent black increases. The association in the South, however, is distinct. Holding all control variables constant, the predicted probability of fully complying with the HCSA among Southern law enforcement agencies, where blacks constitute 10 percent of the population, is about 0.90, which exceeds the predicted rate of compliance in the Northeast. Yet a nontrivial decline emerges as black population size increases. When the black population reaches 50 percent, the probability of compliance drops below 0.70, nearly paralleling the compliance rate for the Midwest.Footnote 32
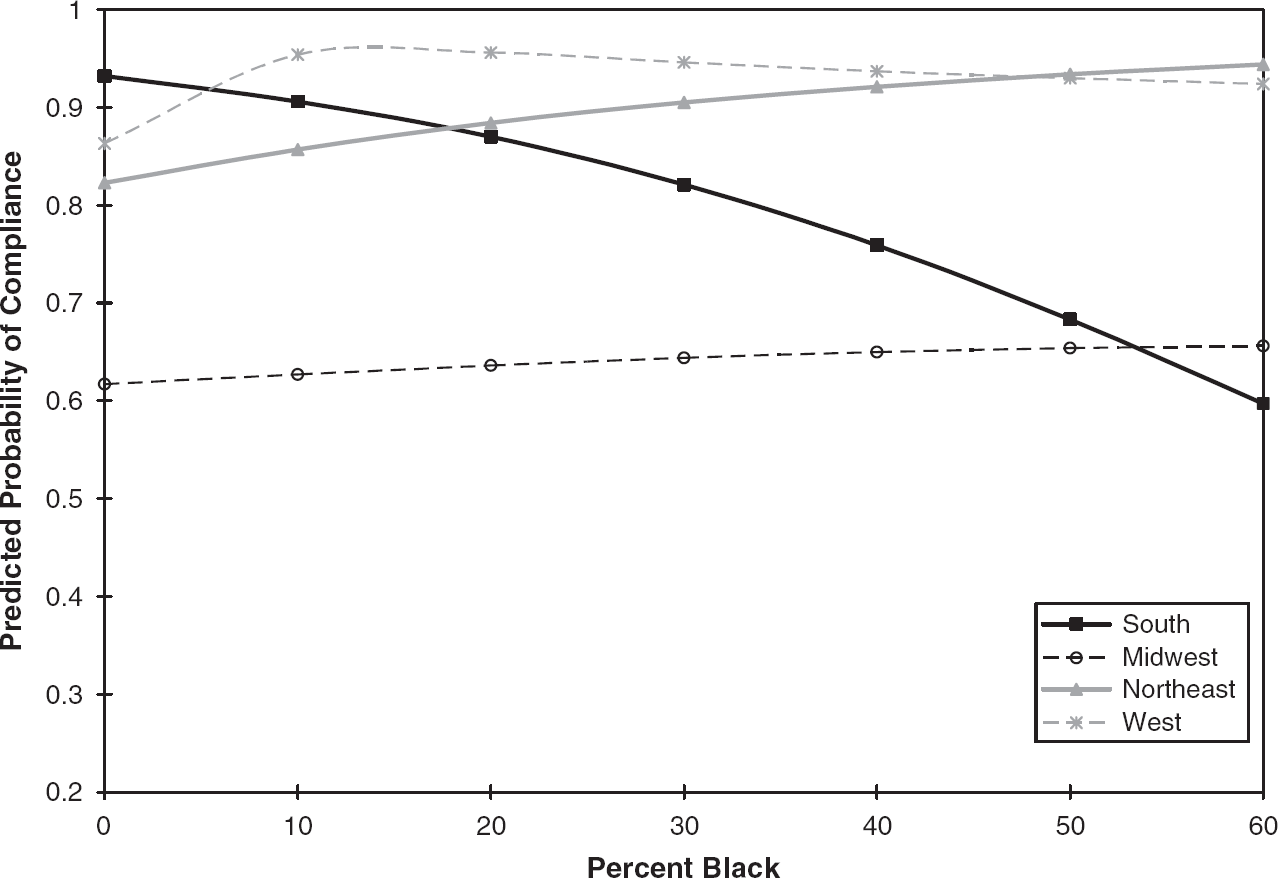
Figure 2. Predicted Probabilities of Full Compliance with the HCSA by Race and Region.
To further clarify the race-region interaction, Table 4 shows the results of logistic regression analyses for any compliance (row 1) and full compliance (row 2) on black population size for all four regions separately. Results are not reported for any compliance in the Northeast and West because only five and six cases, respectively, would be in the reference category (noncompliance), yielding potentially unstable coefficients.Footnote 33 The logistic regression coefficients indicate that each percentage increase in black population size in the Northeast yields a 4 percent increase in the odds of hate crime law compliance (e 0.038). Interestingly, precisely the inverse is found when analyzing jurisdictions in the South. In that case (row 3, column 4), each percentage increase in black population size decreases the odds of full compliance by nearly 4 percent (e −0.039). The analyses reported in Table 4 indicate no robust association between black population size and either measure of compliance in the Midwest or the West.
Table 4. Logistic Regression Coefficients (With Adjusted Standard Errors): Compliance With Federal Hate Crime Law on Black Population Size by Region

Note: Standard errors in parentheses. Models adjust the standard errors for nesting of units within states using the cluster option in Stata 9.1.
* p<0.05,
** p<0.01,
*** p⩽0.001 (all tests two-tailed).
Finally, two additional points are germane to threat theory and hate crime law compliance. First, the association between black population size and compliance may be nonlinear in the South because this region includes many cases where blacks are the majority, and the association between race and threat is purportedly higher in the South. Where blacks constitute a majority of the population, they may assume greater political power, and thus policing agencies are more likely to comply with laws perceived as protecting minority populations. When introducing a squared term for percent black, the negative effect of black population size should become stronger and the quadratic term should be positive. A second and related point also concerns black political power. Blacks are more apt to hold positions of political authority, for instance by controlling the mayor's office, in cities with larger black populations. In line with the tenets of threat theory, the presence of a black mayor in the South should increase hate crime law compliance. Given that the black mayor variable is positively correlated with black population size (r=0.43) in the South, the linear effect of percent black on compliance should become stronger when accounting for the presence of a black mayor.
These respective arguments find empirical support in the data (Table 5). Models 1 and 3 of Table 5 test for nonlinearity in the two compliance variables by including a quadratic term for percent black. In those models, the negative effect of percent black is stronger than in Table 4 and the quadratic coefficients are in the predicted direction (positive), although the quadratic does not reach statistical significance for the full compliance measure. The negative coefficients for black population size and the positive coefficients for the quadratic terms are consistent with threat theory. Black population size decreases compliance in the South, yet this effect weakens as blacks become the majority group. Models 2 and 4 in Table 5 show the linear association between black population size and compliance with the HCSA when controlling for the presence of a black mayor.Footnote 34 As expected, black political power increases the probability of Southern law enforcement agencies complying with federal hate crime law. Moreover, the linear effect of black population size is stronger when accounting for black political power.Footnote 35
Table 5. Logistic Regression Coefficients (With Adjusted Standard Errors): Hate Crime Law Compliance on Black Population Size and Black Political Power in the South

Note: Standard errors in parentheses. Models adjust the standard errors for nesting of units within states using the cluster option in Stata 9.1.
# p<0.10,
* p<0.05,
** p<0.01.
a County policing agencies are excluded in this analysis because mayors are specific to cities. Data were available only for cities with 50,000 population or more, and thus cities with fewer than 50,000 are excluded from analysis.
Three main findings thus emerge from this investigation of hate crime law compliance. First, any compliance with hate crime law is positively associated with community policing, but community policing does not differentiate full compliers from partial compliers. Second, analysis of all cases in all regions shows that compliance is inversely associated with black population size, above and beyond the influence of legal, organizational, and regional factors. Third, the effect of black population size appears contingent on region. The percent black is negatively associated with measures of compliance in the South and positively associated in the Northeast, while conservative estimates indicate no robust association in the West and Midwest. Moreover, there is some evidence of nonlinearity in the black population size coefficient in the South. The results largely support Hypotheses 1 and 2 in Table 1, and partly support Hypothesis 3.
Discussion and Conclusions
This research used the case of law enforcement agency compliance with the HCSA to answer questions germane to both the substantive topic of hate crime law and issues concerning race, institutional arrangements, and government social control. The empirical findings suggest that group threat theory provides a viable framework for understanding some of the variation in compliance with hate crime law in the United States, as law enforcement agencies in jurisdictions with larger black populations are less apt to comply with the HCSA. This negative statistical association indicates that scholars would be remiss to suggest greater government social control, or “more law,” to borrow Reference BlackBlack's (1976) phrase, where the relative size of the black population is large. The linkage between black population size and formal social control has almost exclusively taken this approach, suggesting a positive correlation between criminal law enforcement and the number of blacks. The present analysis suggests that black population size yields “less law” when legislation deals with intergroup conflict and stems from minority group mobilization. Group threat theory thus predicts the dormancy of criminal law as well as its enactment. In that respect, the present results parallel research on opposition to policies viewed as favoring minority groups, which finds greater disagreement with race-targeting policies among whites residing near large black populations (Reference Giles and EvansGiles & Evans 1986; Reference GlaserGlaser 1994; Reference TaylorTaylor 1998; Reference QuillianQuillian 1996). Criminal laws that consider race and other group-defining characteristics face similar resistance where the black population is sizeable. Based on these findings, I hypothesize that policies designed to protect or foster mobility in minority communities may be stymied in precisely those places where intergroup relations are problematic. This hypothesis, although tentative in the absence of corroborating research, represents a potentially rewarding avenue for future research on law and intergroup relations.
A related theoretical proposition extending from this work is that racial threat increases formal social control when the sanction disproportionately befalls minority groups, but racial threat decreases the use of law perceived as protecting minorities. Future work may further test this proposition, for instance by examining if hate crime prosecution is less frequent in districts with large black populations. Such an investigation could more explicitly extend the present argument to the case of law enforcement and the mobilization of criminal hate crime statutes by law enforcement agents.
While this work partly supports the racial threat thesis, it does not utilize this framework uncritically. Research in this tradition gives limited attention to the context of minority group threat (for exceptions see Reference JacksonJackson 1989; Reference Kent and JacobsKent & Jacobs 2005) and the historical conditions predicating perceived threat, which played a central role in early formulations of this paradigm (Reference BlumerBlumer 1958). The present findings indicate no significant and negative association between black population size and hate crime law compliance outside of the American South. To that end, nearly the opposite relationship emerges when analyzing hate crime law compliance in the Northeast, where the percent black and compliance are positively associated (see Tables 3 and 4; also Figure 2). Yet in the South, which was the primary locus of slavery, Jim Crow laws, lynching, segregation, and subsequent civil rights struggles, race is particularly likely to color law enforcement practices. This contingency with respect to minority group threat and law aligns with recent claims that legacies of intergroup violence and prejudice condition the impact of current racial threat in the study of government social control (Reference JacobsJacobs et al. 2005). The breadth and robustness of the present argument can be further tested in other areas of criminal law, including the interaction between region and race in the study of incarceration, arrest, criminal justice expenditures, and sentencing. In each case, the current findings predict that race and criminal law outcomes are more strongly associated in Southern relative to non-Southern jurisdictions. In addition, it is notable that the presence of a state hate crime law is a sizeable predictor of compliance. It remains unclear, however, what role race has played in state hate crimes legislation. Future research may examine the role of race, region, and institutional arrangements in crafting such legislation.
That black population size is positively associated with hate crime law compliance in the Northeast is also a noteworthy finding. I suggest three reasons why hate crime law compliance in this region increases with the relative number of blacks. First, while the Northeast has not been immune to interracial tension in recent or distant history, interracial conflict has been more thoroughly institutionalized in the American South, for instance through formal segregation. Hence, minority group size may not signify a threat to the same extent as areas with a deeper history of interracial conflict, in line with recent research (Reference JacobsJacobs et al. 2005). Second, differences in political party dominance and political support from racial minority constituencies in the South and Northeast (Reference Carmines and StimsonCarmines & Stimson 1989) may also clarify the disparate impact of race on hate crime law compliance. Hate crime reporting is more likely in liberal strongholds (Reference McVeighMcVeigh et al. 2003), and thus liberal political party dominance in the Northeast may act as a buffer against racial threat. Third, groups at the forefront of the hate crime law movement are more heavily concentrated in the Northeast relative to the South. Jewish advocacy groups, such as the Anti-Defamation League, have ardently supported hate crimes legislation (Reference Jenness and GrattetJenness & Grattet 2001), and the Jewish population is proportionately higher in the Northeast relative to the American South (Reference JonesJones et al. 2002). The presence of mobilized groups may foster greater compliance with hate crime law, and again complicate the nexus between black population size and legal outcomes.
Beyond the implications of this research for theories emphasizing minority group threat, the findings also bear on scholarship concerning the consequences of community policing and the incorporation of bureaucratic arrangements in the study of formal social control agencies. Community engagement with government institutions is a salient theme in recent research on civil society (Reference PutnamPutnam 2000) and political culture (Reference Skocpol and FiorinaSkocpol & Fiorina 1999), as well as the criminal justice system (Reference FriedmannFriedmann 1992; Reference Wilson and KellingWilson & Kelling 1982; Reference Kelling and ColesKelling & Coles 1996). While the present research does not speak to the crime control utility of community-oriented law enforcement (see Reference Kelling and ColesKelling & Coles 1996; Reference Skogan and HartnettSkogan & Hartnett 1997; Reference HarcourtHarcourt 2001), the findings suggest an association between community policing and compliance with federal hate crime policy. The statistical relationship between community-oriented law enforcement and hate crime law compliance supports Reference Jenness and GrattetJenness and Grattet's (2005) argument that organizational permeability, or the extent to which an organization's structure and culture align with policy innovation, is an important explanatory factor in the study of organizational compliance. The present findings thus add to a burgeoning area of sociolegal inquiry assessing the utility of organizational theory in the realm of law enforcement (Reference Crank and LangworthyCrank & Langworthy 1992; Reference HaganHagan 1989; Reference MaguireMaguire 1997; Reference KatzKatz 2001; Reference Jenness and GrattetJenness & Grattet 2001, Reference Jenness and Grattet2005). Future work may engage this debate in more detail to further assess the salience of bureaucratic organization to law enforcement and social control outcomes, which prove influential in comparative research on punishment (Reference SavelsbergSavelsberg 1994; Reference SuttonSutton 2000) and in studies of U.S. employment law (Reference EdelmanEdelman 1990, Reference Edelman1992; Reference Kelly and DobbinKelly & Dobbin 1999; Reference EdelmanEdelman et al. 1999). Future research may consider police-community interaction in the context of other major law enforcement initiatives that solicit information and enforcement efforts at the local level, such as terrorism policies, violence against women and domestic abuse, or efforts to monitor racial profiling.
The method and variables utilized in this research have limitations. I could not account for how organized the black population was with respect to civil rights matters, or on hate crime specifically, in the respective jurisdictions. The present indicators of community policing, while in line with theoretical ideas concerning the organizational structure and culture of community policing, also say little about subtle differences in community policing practices. The meaning of community in the law enforcement literature, and in much social science research generally, is often an ill-defined concept (e.g., Reference FriedmannFriedmann 1992, on policing). Whether communities are expected to define the norms police enforce (Reference Kelling and ColesKelling & Coles 1996) or serve as a sources of reintegration (Reference BraithwaiteBraithwaite 1989) may have consequences for police-community relations and, in this case, the execution of hate crime policies. Future work investigating the meaning of community in law enforcement strategies and practices may draw attention to the nature of community interactions and consider with which segments of the population police interact.
Mindful of these limitations, this research nonetheless adds to the literature on group threat theories of law and social control as well as the efficacy of hate crime law. I utilized the case of hate crime law as a vehicle for understanding the conditions under which federal policies are put into practice at the local level and how local law enforcement agencies respond to laws dealing with intergroup conflict. Implementing hate crime law is not a colorblind process. An intriguing implication of these results is that hate crimes are possibly enforced the least where they are at highest risk of occurrence. Race-based hate crimes are more prevalent in heterogeneous places, particularly in areas experiencing a recent influx of racial minorities (Reference GreenGreen et al. 1998; Reference GlaserGlaser et al. 2002), which according to the present research is where compliance with hate crime policy is least pronounced. This research thus contributes to debates concerning racial overtones in law enforcement by demonstrating that the nexus between race and law not only entails overenforcement (Reference KennedyKennedy 1997), but perhaps underprotection as well.


