1. Introduction
A knowledge of past ice-sheet elevation variations is important in the context of understanding climate–ice-sheet interactions and interpreting ice-core palaeo records. In particular, the interpretation of the isotope-ratio (δ18O of ice) record in terms of temperature change requires an estimation of elevation variations, because altitude changes have a direct impact on the temperature of a site, which is indistinguishable from that produced by climatic changes and therefore recorded by isotopes. In addition, improvement of past-climate simulations by atmospheric general circulation models (AGCMs) requires a better knowledge of past ice-sheet topography. Information on the ice-sheet mass balance (and hence on sea-level variations) is also obtained from elevation variations.
Ice-sheet models enable us to estimate past ice-sheet elevation variations in relation to climatic changes. However, most of these models are designed for large ice sheets where local conditions are relatively less significant, and they depend on boundary conditions such as accumulation, temperature and basal sliding, all of which are subject to uncertainties. They are therefore not well suited to the study of local variations, particularly local elevation change in a coastal area such as Law Dome, East Antarctica. An alternative way to derive information on ice-sheet elevation change is to measure the total amount of air entrapped in the bubbles of ice cores. During the transformation of snow into ice, air at atmospheric pressure in the firn becomes progressively trapped as the open pores are transformed into closed bubbles in the ice (the close-off process). The air content (V) of polar ice depends mainly on the atmospheric pressure and temperature prevailing at the formation site. V can be expressed in cm3 g 1 of ice (Reference Martinerie, Raynaud., Etheridge. and Mazaudier.Martinerie and others, 1992) as:

InEquation (1), P c and T c are the mean atmospheric pressure and the firn temperature at the elevation of the close-off level, P 0 and T 0 are the standard pressure (1013 hPa) and temperature (273 K) and V c is the pore volume at close-off (cm3 g−1 of ice). Under present-day conditions, the spatial distribution of V c shows a clear decrease with decreasing temperature. Reference Martinerie, Raynaud., Etheridge. and Mazaudier.Martinerie and others (1992) used data from a large number of sites representing a wide range of climatic conditions (i.e. temperature, pressure and accumulation) to obtain a linear fit to the data of:
There is, however, considerable variability around the regression line (Fig. 1a), indicating that some of the V c fluctuations are not correlated with the close-off temperature.

Fig. 1. Present-day distribution of V and Vc near the surface of Antarctica and Greenland (adapted from Reference Martinerie, Raynaud., Etheridge. and Mazaudier.Martinerie and others, 1992, Reference Martinerie, Lipenkov., Raynaud., Chappellaz., Barkov. and Lorius.1994). The diamonds correspond to the two new sites of GRIP (Reference Raynaud, Chappellaz., Ritz. and Martinerie.Raynaud and others, 1997) and DSS (this work). (a) Vc = f(T c). Solid line represents linear regression obtained by Reference Martinerie, Raynaud., Etheridge. and Mazaudier.Martinerie and others (1992); dotted line takes into account GRIP and DSS sites. (b)V vs atmospheric pressure at close-off depth level. (c) V vs elevation of close-off level.
Because of its pressure and elevation dependence (Fig. 1b and c), air content measured in deep ice cores has previously been used as a palacobarometer, and past ice-sheet elevations have been reconstructed from this information (Reference Raynaud and Lorius.Raynaud and Lorius, 1973,Reference Raynaud and Lorius.1977; Reference Budd and Morgan.Budd and Morgan, 1977; Reference Herron and Langway.Herron and Langway, 1987; Reference Kameda, Nakawo., Mae., Watanabe. and Naruse.Kameda, and others, 1990).
However, recent work conducted on the Vostok (East Antarctica) and GRIP (Greenland) cores (Reference Martinerie, Lipenkov., Raynaud., Chappellaz., Barkov. and Lorius.Martinerie and others, 1994; Reference Raynaud, Chappellaz., Ritz. and Martinerie.Raynaud and others, 1997) has revealed the complexity of the V signal and the possibly major role of other meteorological and glaciological parameters such as wind-speed and atmospheric-pressure patterns (Reference Martinerie, Raynaud., Etheridge. and Mazaudier.Martinerie and others, 1992, Reference Martinerie, Lipenkov., Raynaud., Chappellaz., Barkov. and Lorius.1994; Reference Raynaud, Chappellaz., Ritz. and Martinerie.Raynaud and others, 1997). These results also highlight the fact that variations in the porosity at close-off during past periods are not well constrained.
In this context, we present here new air-content measurements obtained from the Dome Summit South (DSS) deep ice core from Law Dome. Law Dome (200 km in diameter, 1390 m a.s.l.) is a small dome located in Wilkes Land on the coast of East Antarctica. Its ice flow is largely disconnected from that of the main East Antarctic ice sheet, with a large saddle separating the two ice domains (Fig. 2b). The DSS site (66°46′ S, 112°48′ E; 1370 m a.s.l.) is located 4.6 km south-southeast of the dome summit and about 100 km from the East Antarctic margin (Fig. 2a). The site is of particular interest because the low temperatures (annual mean of–22°C) generally preserve the surface snow from summer melting, and the very large accumulation rate (0.7 m a−1 ice equivalent) ensures that the DSS ice core provides very good temporal resolution for the recent part of the Holocene period (Reference Morgan, Wookey., Jun, van Ommen, Skinner. and Fitzpatrick.Morgan and others, 1997).
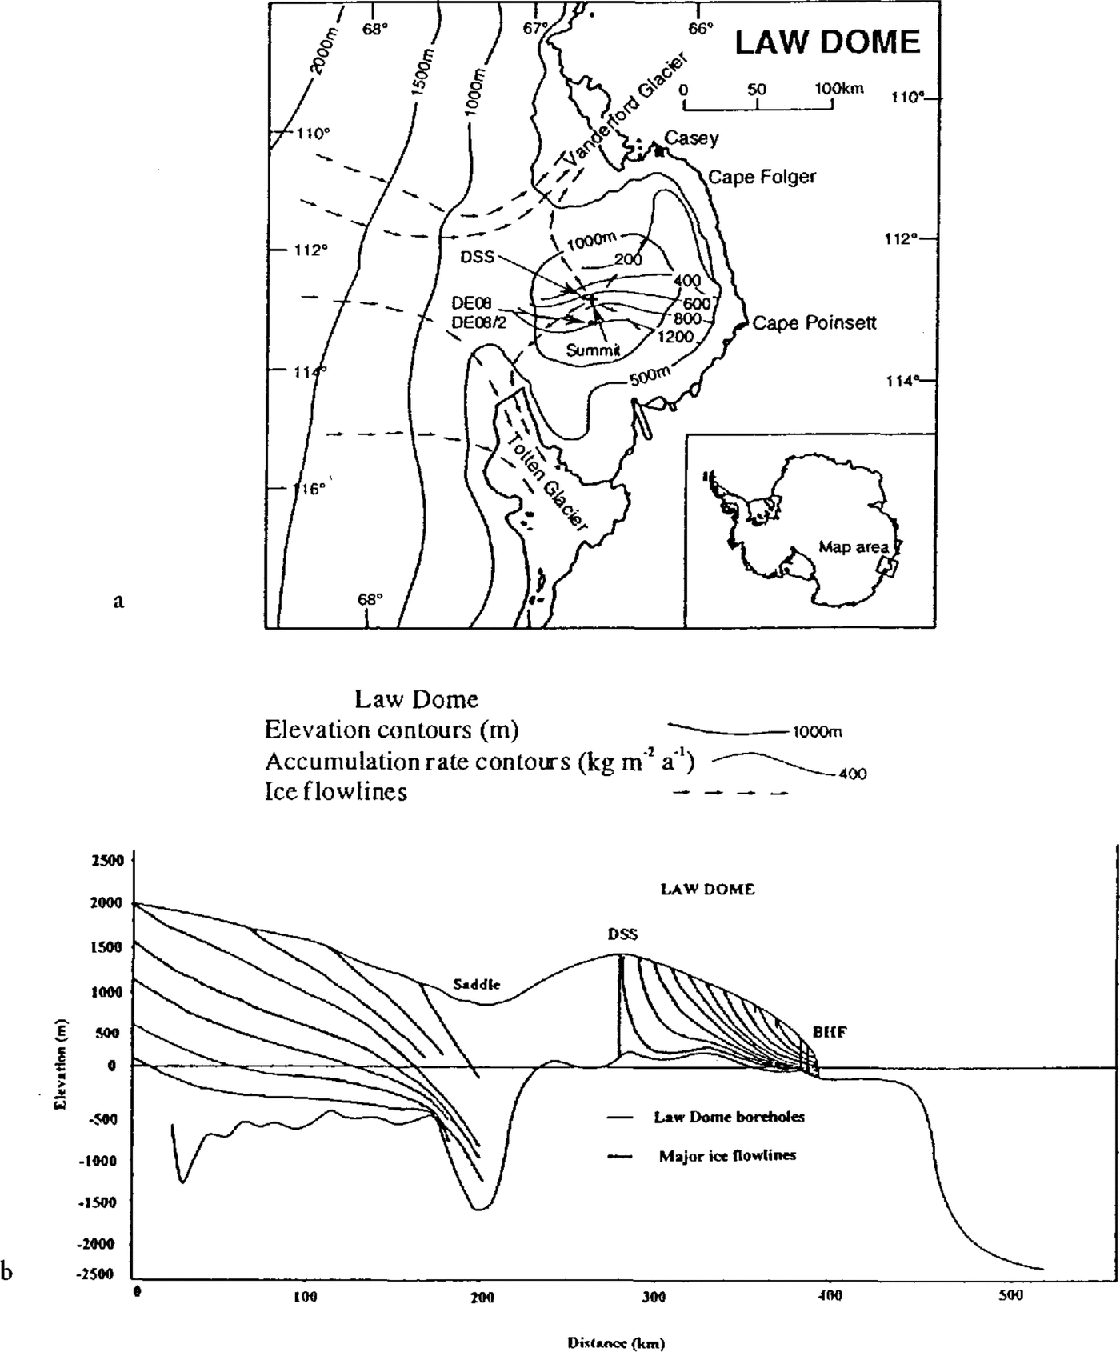
Fig. 2. Map location and characteristics of DSS coring site. (a) Geographical situation of Law Dome (adapted from Reference Etheridge, Steele., Langenfelds., Francey., Barnola and Morgan.Etheridge and others, 1996) (b) Ice flow of Law Dome, and large saddle existing between dome and main East Antarctic ice sheet (adapted from Reference Budd and Morgan.Budd and Morgan, 1977).
These characteristics allow us to investigate seasonal cycles of the air content during the late Holocene period, and to propose a new interpretation involving atmospheric surface parameters and the snow structure. We also show results for the last climatic transition and discuss these in terms of past changes of close-off porosity (V c) and past ice-sheet elevation variation. Comparison with other indicators enables us to investigate the validity and the sensitivity of our different reconstructions.
2. DSS V Measurements
The results presented in this paper are based on more than 130 individual air-content measurements covering the full depth of the DSS core. Most of these were obtained using the barometric method described by Reference Lipenkov, Candaudap., Ravoire., Dulac. and Raynaud.Lipenkov and others (1995). This is based on accurate measurement of the pressure of air released in a calibrated cell after the melting and refreezing of an ice sample under controlled temperature conditions. An initial series of tests of the experimental system against a well-calibrated reference indicated an accuracy for the method of ±0.6% (average reproducibility ±0.5%; Reference Lipenkov, Candaudap., Ravoire., Dulac. and Raynaud.Lipenkov and others, 1995). During our study, we conducted two new series of measurements on a large number of samples, in order to further test the experimental system.
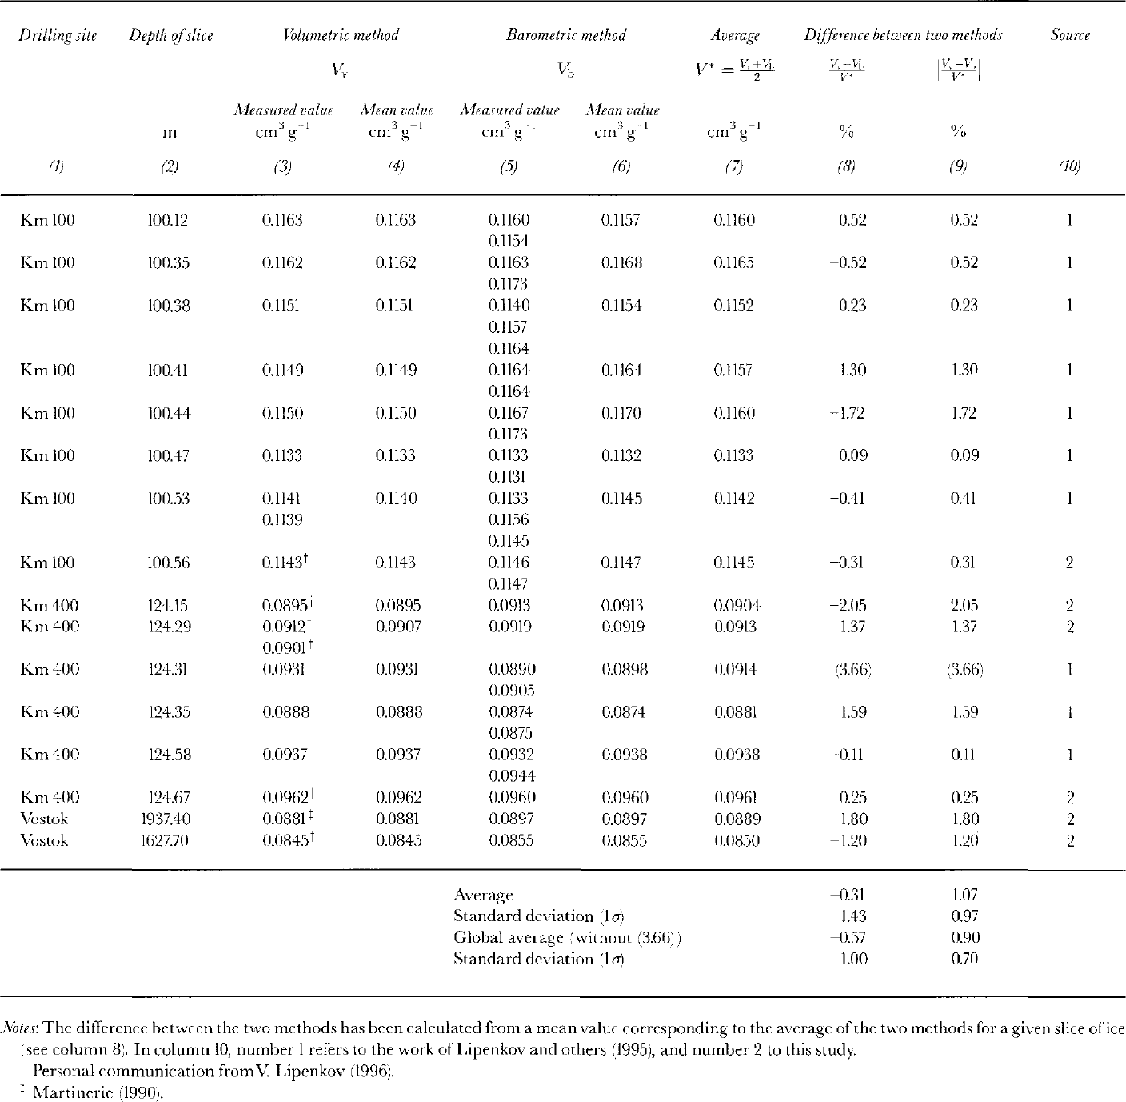
The first series consisted of the measurement of samples cut from the same slice of ice as was previously analyzed by the volumetric method, which consists of the collection of the air in the volumetric burette of a Toepler pump. The volumetric method has been tested and calibrated (including the use of cells with calibrated volume), and therefore provided an absolute reference for the V measurements with an accuracy of ±1.5% (Reference Raynaud and Whillans.Raynaud and Whillans, 1982; Reference MartinerieMartinerie, 1990; Reference Martinerie, Raynaud., Etheridge. and Mazaudier.Martinerie and others, 1992). Our new test results are presented in Table 1, together with the data already obtained by Reference Lipenkov, Candaudap., Ravoire., Dulac. and Raynaud.Lipenkov and others (1995). The average absolute difference between the barometric and volumetric methods is 1.07%, which is in agreement with the results of Reference Lipenkov, Candaudap., Ravoire., Dulac. and Raynaud.Lipenkov and others (1995). Taking into account all the double measurements available (i.e. our study and those of Reference Lipenkov, Candaudap., Ravoire., Dulac. and Raynaud.Lipenkov and others (1995)), and considering a slightly different mode of calculation (see Table 1 footnote), we determine an absolute accuracy of the barometric method of ±0.9%.
Table 1. Comparison of air-content measurements obtained using either the barometric or the volumetric method
The second series of tests was used to evaluate the reproducibility by independent measurement of pairs of samples prepared from a single slice of ice. Most of the DSS samples have been checked by double measurement (Reference DelmotteDelmotte, 1997), particularly the ones corresponding to summer peaks (see section 3.2). The average reproducibility obtained from 50 double barometric measurements is ±0.73%.
Some additional results, for the last climatic transition, were provided as a by-product of methane-concentration measurements performed by a chromatographie method (Reference ChappellazChappellaz and others, 1997). The accuracy of this method does not exceed ±5%, but within this uncertainty the results obtained agree well with the barometric data, as shown in Figure 3.
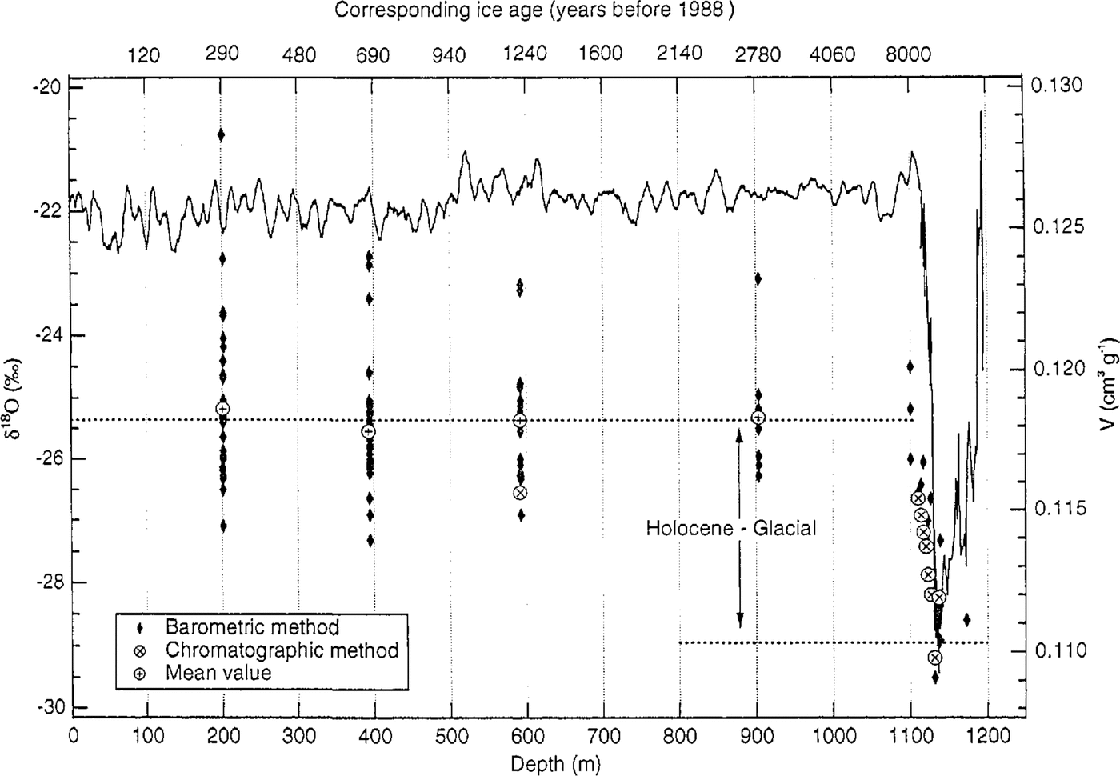
Fig. 3. DSS V records for the Holocene and the Last glacial–interglacial transition. Individual V measurements are represented as full diamonds, and open crossed circles are average values for each Holocene level. Dashed lines correspond to mean Holocene and glacial values (calculated from the four mean V Holocene values and the glacial points). The isotopic record (adapted from Reference Morgan, Wookey., Jun, van Ommen, Skinner. and Fitzpatrick.Morgan and others, 1997), presented as a smoothed curve for the Holocene part, depicts the last climatic transition around 1113 m depth. Corresponding depth ice ages are indicated for the first 1100 m on upper axis. Below that depth, no ages are indicated because the preliminary dating is not accurate enough.
All the results presented in this paper have been corrected for the cut-bubble effect. This correction arises from the gas lost from bubbles near the face of the samples, which are opened during sample cutting. Reference Martinerie, Lipenkov. and Raynaud.Martinerie and others (1990) showed that for typical sample dimensions (20-30 g of ice) this air loss can represent as much as 10% of the total. For the DSS core, the correction factor is ~3.5% in the 200–400 m depth interval, ~1.84% in the 1100–1170 m depth interval and negligible below 1170m. The correction factor was calculated by a statistical method (Reference SaltikovSaltikov, 1976; Reference MartinerieMartinerie, 1990; Reference Martinerie, Lipenkov. and Raynaud.Martinerie and others, 1990) from average bubble diameters measured on thin sections. Bubble diameters vary from 0.30 mm at 20l m depth to 0.20 mm at the bottom of the core (1170 m).
3. The Late-Holocene Record: Long-Term Trend and Seasonal Variations
At DSS, the Holocene period is spread over the upper 1113 m of the core (Reference DelmotteDelmotte, 1997; Reference Morgan, Wookey., Jun, van Ommen, Skinner. and Fitzpatrick.Morgan and others, 1997). Over this depth interval we sampled at four levels: 200, 393, 591 and 903 m (corresponding ages of the ice are 285 ±2, 671 ±5, 1220 ±10 and 2955 ±150 years before AD 1988). At each depth level, we measured (at 3 cm resolution) continuous ice pieces 0.80–1 m long (except for the lowest level, where the length was only 0.26 m). The data obtained enable us to investigate the long-term trend of the V record, as well as the short-term (to sub-annual) variations.
3.1. Late-holocene V trend
The mean V values calculated for each of the four depth levels corresponding to the late-Holocene period show no significant differences (Fig. 3), and lead to a 0.1182 cm3 g1 average for the considered time period. The lack of a trend in V reflects the stability of the dome during the Holocene and supports the notion of a constant-size ice sheet as indicated by the stable-isotope (δ18O) record. Indeed, the smoothed δ18O record shown in Figure 3 exhibits fluctuations no larger than 1%0, which reflect temperature variations of ˂2°C. This corresponds to elevation change of ˂ 150 m, a variation which lies near the limit of uncertainty of our interpretation (see section 4).
The DSS late-Holocene mean V value of 0.1182 cm3 g1 corresponds to a V c value, calculated byEquation (1), of 0.133 cm3 g−1. Both this value and that for the GRIP site (Reference Raynaud, Chappellaz., Ritz. and Martinerie.Raynaud and others, 1997) lie close to the mean of the distribution of Reference Martinerie, Lipenkov., Raynaud., Chappellaz., Barkov. and Lorius.Martinerie and others (1994), as shown in Figure 1a. By adding these two new sites to the dataset of Reference Martinerie, Lipenkov., Raynaud., Chappellaz., Barkov. and Lorius.Martinerie and others (1994), and reconsidering the present-day relationship, we obtain the following linear relationship:
We use this new parameterisation, which includes the DSS and the GRIP data, in the following sections. It differs only slightly from the one previously established by Reference Martinerie, Lipenkov., Raynaud., Chappellaz., Barkov. and Lorius.Martinerie and others (1994) (seeEquation (2)).
3.2. Sub-annual V variations
The high-resolution V measurements conducted at the four depth levels reveal significant V variations on a sub-annual time-scale. δ 18O measured on the same samples clearly indicates the seasonality, with higher δ values corresponding to the summer, and lower values to the winter (Fig. 4). The records for the first three depth levels each contain two consecutive seasonal cycles. In addition, H2O2 concentration, another seasonal marker, was measured on the 201 and 393 m depth series. We observed that whereas the δ18O and H2O2, records show regular cycles with smooth transitions between summer and winter seasons, the V signal is characterised by a relatively constant background (around 0.117 cm3 g−1) interrupted by short, sharp peaks 5–12% above the annual winter minimum and occurring within the summer period. The results are similar to other data from Law Dome (Reference LebelLebel, 1978; Reference Martinerie, Raynaud., Etheridge. and Mazaudier.Martinerie and others, 1992) and data from other locations such as Dye 3 and Camp Century, Greenland (Reference Berner, Stauffer. and Oeschger.Berner, and others, 1978; Reference Raynaud and Lebel.Raynaud and Lebel, 1979; Reference Raynaud and Whillans.Raynaud and Whillans, 1982; Reference Herron and Langway.Herron and Langway, 1987; Reference Martinerie, Raynaud., Etheridge. and Mazaudier.Martinerie and others, 1992).
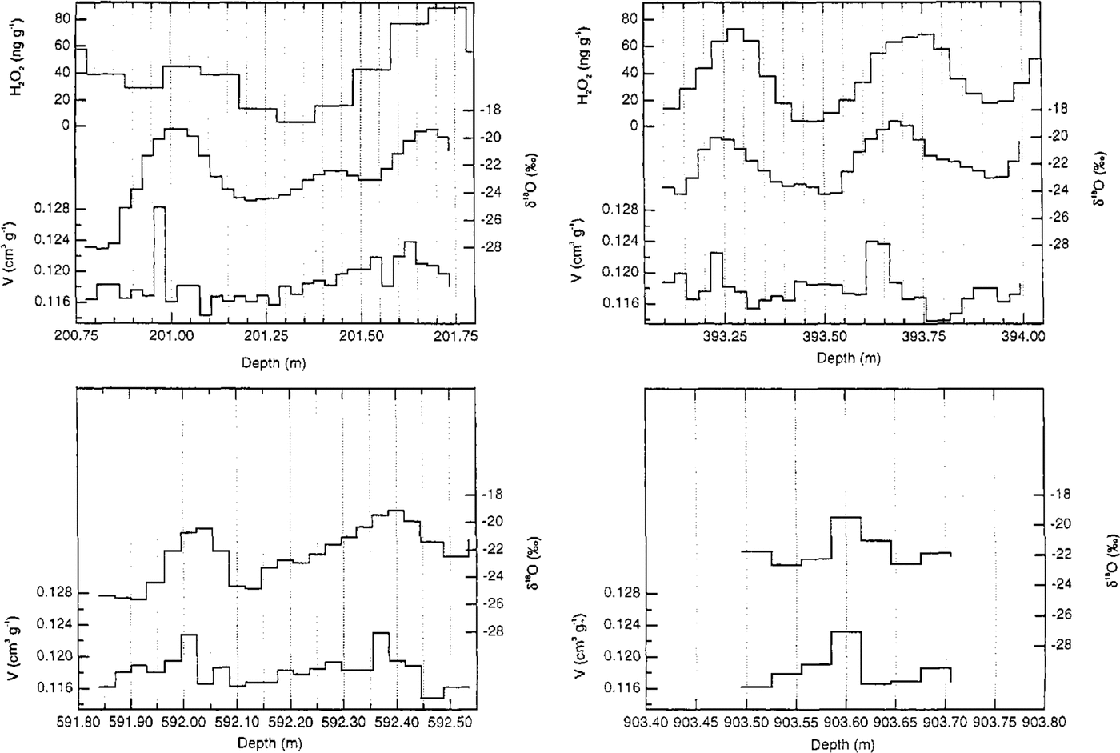
Fig. 4. Air-content sub-annual variations for the 200, 393, 591 and 903 m depth levels. All the graphs are presented with isotope measurements performed on the same samples. The upper two graphs include the H2O2 record, which is also a seasonal marker.
Since air-pressure fluctuations are smoothed by the slow diffusion of air in the firn, the seasonal variations in V must be due to variations in close-off porosity. It has been proposed, for instance by Reference LebelLebel (1978) and Reference Raynaud and Whillans.Raynaud and Whillans (1982), that seasonal variations of surface air temperature influence the snow porosity at the surface through the size and shape distribution of the firn grains, and that a memory of these initial seasonal fluctuations is maintained down to the close-off level.
On the other hand, using data from the very high-accumulation site DEO8 on Law Dome, Reference Martinerie, Raynaud., Etheridge. and Mazaudier.Martinerie and others (1992) observed that the high V (and hence V c) peaks are generally narrower than the summer isotopic (δ) peaks. These authors concluded that it is unlikely that the V c seasonal changes are directly related to the surface air temperature and suggested instead that a sealing effect, as first proposed by Reference Schwander and Stauffer.Schwander and Stauffer (1984) and Reference Stauffer, Schwander. and Oeschger.Stauffer and others (1985), occurs in the close-off region. Dense winter layers close first, and thus prematurely seal the summer layers found just below, which have a lower density (higher porosity).
We note that none of the above interpretations completely accounts for the typical narrowness of the V peak.
Our high-resolution data provide new information for interpreting the V seasonal records. We use the δ18O and H2O2 records to define precisely the timing of the V peaks within the seasonal cycle. H2O2 concentrations depend principally on the intensity of solar radiation (Reference Neftel, Jacob. and Klockow.Neftel and others, 1986, Reference Neftel, Bales., Jacob. and Delmas1995), whereas isotopic maxima are associated with temperature maxima. Based on these two temporal indicators, Reference Van Ommen and Morgan.Van Ommen and Morgan (1996) noticed a time lag (~18days) between the maxima of peroxide concentration and the maxima of the isotopic composition measured in the ice of the DSS core. They linked the highest values of peroxide with the austral summer solstice. As a result, the isotopic maximum occurs around mid-January, in accordance with the temperature maximum from local meteorological data (Reference Russell-Head and Simmonds.Russell-Head and Simmonds, 1993). The V peaks lag the isotopic maxima, and thus occur during the transition from summer to winter (Fig. 4). This period of the year is characterised by a strong temperature gradient in the upper 10 m of snow (Reference Xie, Li. and Young.Xie and others, 1989). The existence of such temperature gradients generally causes the formation of depth hoar, by sublimation of the water vapour from the warm lower layers to the cold upper layers (Reference AlleyAlley, 1988; Reference Alley, Saltzman., Cuffey. and Fitzpatrick.Alley and others, 1990; Reference PatersonPaterson, 1994). Sublimation is restricted to the upper few meters of snow (i.e. it is sensitive to the surface meteorological conditions), and its major consequence is a modification of the structure of the snowpack. Depth-hoar layers are distinguished by coarse grains and low densities (Reference Alley, Saltzman., Cuffey. and Fitzpatrick.Alley and others, 1990; Reference PatersonPaterson, 1994), which result in these layers being highly porous. We suggest that the late-summer peaks observed in V are caused by the preservation of the physical properties of the depth-hoar layers (specifically the narrow, low-density layer) down to the close-off depth. The peaks of high V and therefore high V c are thus associated with high-porosity layers of depth hoar forming at or near the surface during the transition from summer to winter. This interpretation accounts for the narrow shape of the V peaks in comparison with the isotope and H2O2 signal.
Depth-hoar layers have been identified in stratigraphie studies of several ice cores in the Law Dome area (Reference BuddBudd, 1966; Reference Xie, Li. and Young.Xie and others, 1989). Depth hoar could also playa role in other sites where seasonal V variations have been reported (Reference LebelLebel, 1978; Reference Raynaud and Lebel.Raynaud and Lebel, 1979; Reference Martinerie, Raynaud., Etheridge. and Mazaudier.Martinerie and others, 1992). At these sites the V maxima are always associated with isotopically warm, i.e. summer, ice. Depth-hoar formation generally occurs in autumn, but in some places temperature gradients within the snowpack are also sufficient in summer (Reference Alley, Saltzman., Cuffey. and Fitzpatrick.Alley and others, 1990).
Other meteorological parameters, such as wind, may also playa role in determining the porosity of the surface snow and thus influence the close-off porosity (Reference Martinerie, Lipenkov., Raynaud., Chappellaz., Barkov. and Lorius.Martinerie and others, 1994; Reference Raynaud, Chappellaz., Ritz. and Martinerie.Raynaud and others, 1997). Reference AlleyAlley (1988) reported on the formation and diagenesis of depth hoar in polar snow and firn and showed that depth-hoar layers were often associated with wind-slab formation. This accords with the correlation between wind speed and porosity, as pointed out by Reference Martinerie, Lipenkov., Raynaud., Chappellaz., Barkov. and Lorius.Martinerie and others (1994). Further information about the interpretation of the V variations in relation to snow and firn structure could be obtained from a combination of structure analyses and air-content measurements.
4. Air-Content Variations Over the Last Glacial-Interglacial Transition: A Record of Past Ice-Sheet Elevation Change?
Because of the pressure dependence of V (see Equation (1) and Fig. 1b), air-content profiles have been interpreted in terms of past ice-sheet elevation changes (Reference Raynaud and Lorius.Raynaud and Lorius, 1973; Reference Raynaud and Lebel.Raynaud and Lebel, 1979; Reference Herron and Langway.Herron and Lang-way, 1987; Reference Kameda, Nakawo., Mae., Watanabe. and Naruse.Kameda and others, 1990). Based on present-day V c –T c parameterisations, and using the isotope profile as a record of past temperatures, these authors proposed past ice-sheet elevation reconstructions for different sites. Nevertheless, recent studies conducted on the Vostok (Reference Martinerie, Lipenkov., Raynaud., Chappellaz., Barkov. and Lorius.Martinerie and others, 1994) and GRIP (Reference Raynaud, Chappellaz., Ritz. and Martinerie.Raynaud and others, 1997) cores point out the complexity of the air-content signal. In Greenland, for example, past ice-sheet elevation reconstructions based on air-content data agree qualitatively with simulations produced by ice-sheet models (Reference Raynaud, Chappellaz., Ritz. and Martinerie.Raynaud and others, 1997), but obtaining quantitative estimates is not straightforward. Indeed, glacial–interglacial V changes also reflect changes in the atmospheric pressure pattern induced by large-scale atmospheric circulation changes at that time or during the glacial. Furthermore the mechanisms governing the present-day V c variations are not fully understood, so V c behaviour under glacial conditions is not well constrained.
Here, we first investigate the glacial–interglacial V change in terms of pressure and elevation changes, assuming that the present-day V e –T c relationship (Equation (3)) is valid for the past periods and using the ice isotopic record as a temperature indicator. We then discuss the reliability of our results and the possible influence of other parameters. We finally propose a range of surface-elevation change deduced from air-content data and compare it with other independent elevation reconstructions.
4.1. The DSS record
By combining all our barometric and chromatographie air-content measurements between 1100 and 1140 m depth (21 different levels) we obtain a V record of the transition from the Last glacial to the Holocene. The results show a gradual increase of the air content, from typical Last glacial values around 0.110 cm3 g−1 to the mean Holocene value of 0.118 cm3 g−1 (Fig. 3). The V increase parallels the isotope record, but the scatter over the limited number of measurements during the deglaciation and the lack of V measurements for the early Holocene period (Fig. 3) preclude investigation of any precise timing difference. According to Reference WhillansWhillans (1981), the early Holocene should be the critical period when focusing on the time response of an ice sheet to an accumulation and/or temperature increase.
The seasonal fluctuations of 5 12% observed in the Holocene V data are not seen in the transition record because, at this depth, as a result of layer thinning, the samples cover a much longer time period than for the Holocene samples. For instance, at 1100 m depth a 3 cm sample represents at least 3 years’ accumulation. The 7% increase in V between the glacial and the Holocene therefore represents a long-term change in air content due to change in air pressure and close-off volume (V c).
4.2. Law dome past ice-sheet elevation variations
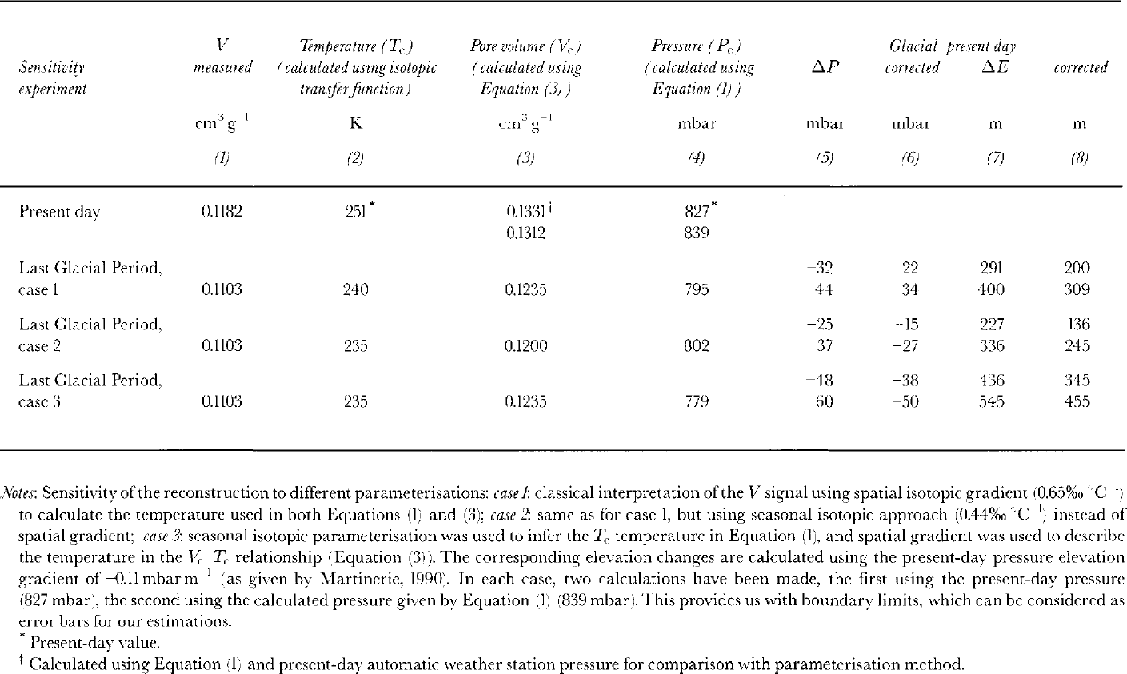
We first assume that Equation (3), linking the porosity at close-off with the temperature at close-off, remains valid during glacial conditions. We test the sensitivity of the reconstructed elevations by applying different δ–T relationships. Firstly (Table 2, case 1), we estimate the close-off temperature in the glacial using the classical δ–T transfer function, i.e. spatial gradient of 0.65%0 °C−1 given by Reference MorganMorgan (1979), and secondly (Table 2, case 2), we use the seasonal gradient of 0.44%0 °C−1 (Reference Van Ommen and Morgan.Van Ommen and Morgan, 1997). In doing so we implicitly assume that the true transfer function lies somewhere between these two values, this choice allowing us to bracket the elevation change between an upper and a lower bound. (A detailed discussion of the validity of the isotope/temperature transfer function, beyond the scope of this paper, can be found in Reference JouzelJouzel and others (1997).) The difference in glacial/interglacial elevation change obtained for the two cases is ~50 m (see Table 2), i.e. the elevation change is not very sensitive to a single temperature change.
Table 2. Law Dome past ice-sheet elevation variation inferred from air-content measurements.
Results obtained along the Vostok and GRIP cores (Reference Martinerie, Lipenkov., Raynaud., Chappellaz., Barkov. and Lorius.Martinerie and others, 1994; Reference Raynaud, Chappellaz., Ritz. and Martinerie.Raynaud and others, 1997) strongly suggest that a simple use of the V c – T c relationship alone cannot explain the long-term V fluctuations. Indeed, other climatic parameters such as changes in wind speed (Reference Martinerie, Lipenkov., Raynaud., Chappellaz., Barkov. and Lorius.Martinerie and others, 1994) or in the seasonally of the precipitation (Reference Raynaud, Chappellaz., Ritz. and Martinerie.Raynaud and others, 1997) may affect the firn porosity. At DSS the mean wind speed is fairly constant all year round at 8.3 m s−1. This lies above the threshold of 6.0 m s−1 given by Reference Martinerie, Lipenkov., Raynaud., Chappellaz., Barkov. and Lorius.Martinerie and others (1994) for significant wind snowpacking, which can have a significant effect on the surface snow density (e.g. snow porosity; Reference KotlyakovKotlyakov, 1961). Therefore we cannot exclude the possibility that some of the V c variations in the past are related to changes in the wind.
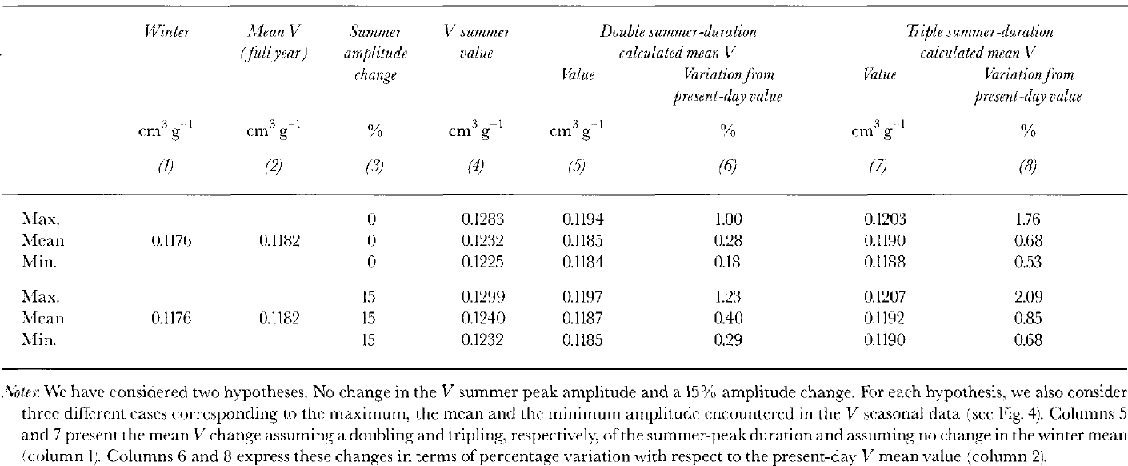
Recently, new interest has been shown in possible changes in the seasonality of the temperature and/or precipitation during the last Glacial Period. Simulations conducted with several AGCMs (unpublished information from G. Krinner and others) show increased amplitudes of the annual temperature cycles during the Last Glacial Maximum (LGM), mainly due to colder temperature in winter than in summer. Such seasonal changes would lead to stronger summer-to-winter temperature gradients, which in turn could influence the formation of depth hoar. As a result, more intense depth-hoar layers should occur, which should be reflected by wider and/or higher V peaks. We can investigate the effect of a temperature seasonality change using our Holocene sub-seasonal data. For example, if we suppose a doubling or tripling of the late-summer peak duration during the Glacial Period at DSS, this would increase the mean annual V signal by a maximum of 1 % or 1.8%, respectively (see Table 3). On the other hand, if we consider not only a change in the peak duration but also a 15% change in the peak amplitude (induced by a 15% increase in the temperature seasonal-cycle amplitude as suggested by AGCM simulations; personal communication from G. Krinner, 1997) this leads to a maximum V (V c) change of 2.1% (Table 3). Such a change is small compared to the glacial– interglacial V increase (7%) and would lead to higher V (V c) during the deglaciation. On the other hand, sublimation processes involved in depth-hoar formation are sensitive not only to temperature gradients but also to the temperature itself. If we assume only that the surface temperature was lower during the ice age, then the depth-hoar formation would be reduced. Our calculations in Table 3 do not include such an effect. It is possible that a seasonality change in the temperature cycle could be completely counterbalanced by the temperature decrease during the LGM, leading to similar or even lower V (V c) values.
Table 3. Effect of seasonally change on air-content fluctuations
Another way to investigate the influence of non-thermal parameters (e.g. wind and/or seasonality changes) on the V variations is to use the spatial gradient to describe the temperature in Equation (3), and the seasonal gradient in Equation (1) to calculate P c (Table 2, case 3). This approach is justified because V c should be more sensitive to climatic conditions occurring when the snow is deposited (cf. section 3.2), whereas the close-off temperature, which is the temperature shown in the denominator of Equation (1), reflects the mean interannual temperature at the site. We assume that the spatialisotopic gradient probably better reflects the temperature conditions prevailing during the snow deposition, whereas the seasonal isotopic gradient is a better approximation of the mean surface interannual temperature.
The results of the different sensitivity tests are summarised in Table 2. All three cases predict a lower pressure (higher elevation) on the Law Dome during the last Glacial Period (Table 2), but they lead to pressure and elevation variations of –25 to –48 mbar (+227 to +436 m), respectively, with reference to the present-day pressure of 827 mbar (and using the current local pressure-elevation gradient, –11 mbar (100 m)−1 (Reference MartinerieMartinerie, 1990)).
Part of the pressure variation could result from changes in the atmospheric pressure field during the LGM. Recent investigations on the LGM pressure changes have been conducted by G. Krinner and others (unpublished information), using several AGCMs. Most of the models agree on a lowering of the pressure field over Antarctica in the range 0 15 mbar during the LGM, depending on the elevation of the considered site. In the case of DSS (1370 m a.s.l.), the pressure lowering should have been on the order of 5–15 mbar. Assuming a mean pressure decrease of 10 mbar during the LGM, we infer a thinning of 135–345 m for the summit region of Law Dome between the LGM and the Holocene.
In summary, our V data indicate that during the last deglaciation the summit region of Law Dome was subject to a maximum lowering of 135–345 m. The large range is mainly linked with uncertainty in the behaviour of the close-off porosity. These estimates do not include any effect of less prominent depth-hoar development due to colder temperatures during the glacial.
4.3. Comparison with other elevation indicators at law dome
Past ice-sheet elevation changes can also be estimated by ice-sheet modelling or glaciological and/or geomorphologic indicators. No detailed modelling reconstruction has yet been dedicated to the specific region of Law Dome (large-scale Antarctic models do not properly represent Law Dome as a single dome because of their grid resolution). On the other hand, estimates of glacial–interglacial elevation changes deduced from isotopic records measured in the Law Dome coastal area (Reference Grootes and Stuiver.Grootes and Stuiver, 1987) and geomorphologic studies in the vicinity of this site (Reference GoodwinGoodwin, 1995) are available for the last climatic transition. Both of these studies predict a thinning of a few hundred metres during the deglaciation, and confirm that the dome retained ice flow independent of the main East Antarctic ice sheet during the LGM and was not overridden by the East Antarctic major ice sheet, as previously suggested by Reference Budd and Morgan.Budd and Morgan (1977). Note that the elevation-change estimate given by the isotopic record of the BHF core (Reference Grootes and Stuiver.Grootes and Stuiver, 1987) is not very accurate for the summit area because BHF is located near the ice-sheet margin and its isotopic record includes a significant variation due to ice advection (Fig. 2b). In contrast to this marginal ice core, the DSS record is only minimally affected by changes in the origin of the ice. In DSS the glacial–interglacial δ shift is 7%0. Isotopic records from inland in East Antarctica, where elevation changes are expected to be small due to the very low-accumulation, indicate lower shifts: 6.0%0 at Vostok (Reference JouzelJouzel and others, 1987), 5.4%0 at Dome C (Reference Lorius, Merlivat., Jouzel. and Pourchet.Lorius and others, 1979) and 5.8%0 at Dome B (Reference JouzelJouzel and others, 1995). If we assume that the isotopic shifts of Dome C, Dome B and Vostok are representative of a pure climatic change, the average difference from DSS, 1.3%0, can be attributed to an elevation effect. With the present-day local isotope-elevation gradient of 0.5%0 (100 m)−1 (Reference Budd and Morgan.Budd and Morgan, 1977), this leads to an elevation decrease of about 260 m.
All these estimates are on the whole in very good agreement with our reconstruction based on V data.
5. Conclusions
Understanding seasonal variations in the air content (V) of polar ice is important for investigating the climatic factors influencing the changes of V on long time-scales (e.g. glacial–interglacial cycle). The high-resolution V measurements performed on parts of the late-Holocene ice of the DSS core reveal narrow V peaks in the part of the core deposited in the late summer. We propose that these peaks are due to low-density layers of firn produced by depth hoar formed at or near the surface.
For the Last glacial–interglacial transition, our results indicate a maximum lowering of the surface at Summit of 136–345 m. The main uncertainty about the elevation is due to the poorly constrained behaviour of the porosity at close-off. This includes the influence of depth-hoar formation during glacial times. This small altitude variation is in agreement with other indicators of elevation changes and suggests that the general shape of Law Dome remained essentially similar during the Glacial Period and the Holocene.
Acknowledgements
The thesis grant of M. D. was supported by the Commissariat à l’Energie Atomique (INSTN). We acknowledge the support of the Programme National d’Étude de la Dynamique du Climat. We thank J. Chappellaz for providing the chromatographie measurements, and P. Martinerie, J.-M. Barnola and G. Krinner for fruitful discussions. We also thank the members of the Australian National Antarctic Research Expeditions who worked tirelessly to retrieve the ice core. We are indebted to the two anonymous reviewers for their helpful remarks and comments.


