INTRODUCTION
Despite nearly one century of advances in vaccines and antibacterial drugs, Streptococcus pneumoniae remains a major human pathogen, causing an estimated 400 000 cases of pneumonia and 40 000 deaths per year in the United States. Rates of community-based pneumococcal bacteraemia were rising in the latter part of the 20th century but have begun to fall since the introduction of a pneumococcal conjugate vaccine for children in 2000 [Reference Kyaw1].
The introduction of the new conjugate pneumococcal vaccine and subsequent shortages in vaccine supply have emphasized the importance of understanding population-based risk factors for disease to maximize efficiency in distributing vaccine [Reference Freed, Davis and Clark2–Reference Butler and Tuomanen5]. For example, age >65 years is a major indication for the adult pneumococcal vaccine and successful vaccination of older adult populations is frequently evaluated as a marker of quality of care [6–Reference Ahmed8]. More recently, attention to race as a risk factor led to early recommendations to extend the age for conjugate vaccination for African American children compared to white children [4, Reference Robinson9–11]. Understanding of risk factors for invasive pneumococcal disease remains incomplete, with ongoing recognition of new risk factors and even evidence that the importance of African American race as a risk factor is diminishing [Reference Flannery3].
Our primary objective was to identify high-risk adult populations for bacteraemic pneumococcal pneumonia (BPP) in the post-conjugate vaccine era. We measured annual population rates of BPP across a variety of demographic and clinical subgroups to identify high- risk populations, which would potentially require ongoing surveillance and targeted prevention strategies.
METHODS
This study was based on a prospective population-based surveillance study of BPP in adults in Southeastern Pennsylvania from 31 March 2002 to 1 April 2004, with interview data for those adults who could be contacted after their hospitalization. Details of the surveillance network have been previously described [Reference Metlay12–Reference Czaja, Crossette and Metlay14].
Study site
This study was conducted within the five-county region surrounding Philadelphia, PA (Bucks, Chester, Delaware, Montgomery, and Philadelphia counties). Based on 2000 census data, the adult population (aged ⩾18 years) of this region was 2 881 132 [15]. At the start of the surveillance period, there were 46 acute care hospitals serving this region. In total, 43 out of 46 hospitals participated in this study. Of the remaining three hospitals, two were small hospitals closed to external studies and one was a larger academic hospital that was unable to participate. The total number of cases accounted for by these three sites was projected to be <5% of all cases in the surveillance region. This surveillance network has previously been shown to identify 97% of cases reported to the Philadelphia Health Department [Reference Metlay12].
Case identification
For the surveillance data, the case definition was restricted to adults aged ⩾18 years with at least one blood culture drawn within 48 h of hospital admission with growth of S. pneumoniae; a clinical diagnosis of pneumonia provided by the treating physician; residence in one of the five counties; and confirmation in our laboratory that the bacterial isolate was S. pneumoniae (see below). Exclusion criteria for the case-control study were evidence of bacterial meningitis (CSF growth of S. pneumoniae or CSF findings compatible with bacterial meningitis), or hospitalization within 10 days preceding the index hospitalization. Patients with bacterial meningitis were excluded from the surveillance because the original study focused on treatment outcomes for patients with isolated BPP.
Cases were identified by microbiology laboratory personnel at each participating hospital. Whenever laboratory personnel identified a blood culture with growth of S. pneumoniae, research staff contacted the physician of record to determine subject eligibility. Eligible subjects (or proxies in cases of mental incompetence or death) were then approached for study enrolment at a time determined by the treating physician (typically after hospital discharge). Subjects were mailed informational study materials and then contacted by phone to provide consent for study participation and complete a telephone interview.
Data collection
Trained telephone interviewers administered a 30-minute structured telephone interview for each study subject. If the study subject was unable to complete the interview (due to cognitive impairment or death), a proxy interview was collected. The interview included sections on sociodemographic characteristics and living arrangements and comorbid conditions and other risk factors present prior to hospitalization for pneumococcal pneumonia. A copy of the telephone interview tool is available upon request.
Microbiological data collection
Pneumococcal blood isolates were transported to a laboratory at the Hospital of the University of Pennsylvania for analysis. Isolates were re-identified to confirm that they were pneumococci on the basis of colony morphology and haemolytic activity, Gram-stain appearance, catalase reaction, bile solubility, and optochin susceptibility.
Population data
Because we conducted population-based surveillance for all adult cases in the five-county region, we used two datasets that were derived from probabilistic sampling of the population in the region as control populations. Analyses were conducted in parallel against two separate control populations: U.S. Census microdata and the Philadelphia Health Management Corporations's (PHMC) 2004 Southeastern Pennsylvanian Household Health Survey (SPHHS) [Reference Ruggles16, 17].
The census microdata were a weighted 5% sample of individual demographic data including race, age, education, income, and gender. Microdata were used because they link variables to individuals in the dataset, unlike the publicly available complete census data. For each individual, the appropriate weight was provided to generate population statistics. The accuracy of the microdata was confirmed by comparison to total 2000 census data, which showed that the microdata were within 1% accuracy in providing population estimates by age and race. The microdata covered the same five-county area as the surveillance network.
The SPHHS was also a weighted probabilistic sample from the population of the five-county area. The 2004 survey included 10 422 adults aged ⩾18 years. Each individual in the dataset was contacted by telephone interview and data were collected that included information on basic demographic factors such as age, gender, race, approximate household income, and number of residents in the household. The data also provided health information such as whether participants had ever been diagnosed with cancer, diabetes, or asthma, or were currently smoking. Thus, the census microdata and SPHSS data provided complementary information. The census microdata included more detailed information on income (permitting more granular income categories to be used in census-based analyses) and the SPHSS dataset provided information on clinical risk factors and comorbidities not available through the census data.
Statistical methods
We calculated annual incidence of disease, with 95% confidence intervals based on the Poisson distribution. Census data were used for population denominator values except for the clinical variables, for which weighted SPHHS data were used to generate population denominator values.
To generate valid population rates of disease, we needed to impute values for those cases with missing data, i.e. those cases that did not complete telephone interviews. We used multiple imputation (the mi procedure in SAS) to generate values for subjects with missing data to calculate population rates based on the total source population (see below). For these and all further analyses, the mi, surveylogistic, and mianalyze procedures within SAS 9.1 were used [18]. Missing values were imputed using age, gender, and data source after combining the data from the BPP cases with the census microdata or SPHSS data. Imputation was performed ten times. Use of data source as a variable was comparable to using case/non-case status in multiple imputation, the recommended approach [Reference Kenward and Carpenter19]. In this approach, regression models were developed with the missing variable (e.g. race or income) as a dependent variable. The resulting model was then used repeatedly to generate a range of probable values for the missing variable of interest. The data from each imputed dataset were then analysed using surveylogistic, and combined inference was derived using the mianalyze procedure in SAS. This approach is superior to approaches such as listwise deletion for two reasons. First, the process of imputation compensates for biases in the distribution of known variables between cases with full data and cases with missing data. Second, the procedure provides confidence intervals which reflect the uncertainty in the imputed values [Reference Allison20]. In the final step of the analysis, imputed estimates of BPP counts for various demographic and clinical subgroups were then used to calculate population rates of BPP.
In a secondary analysis, stratification and multivariable logistic regression were used to assess whether the associations observed in the overall population-based study were independent of one another. Due to the extremely low incidence of BPP, it was assumed that all individuals in the census and SPHSS data were non-cases, and odds ratios were interpreted as relative risks under the rare disease assumption. This subset of participants who completed telephone interviews compared to the local population as represented by the census microdata. This eliminated the need to impute missing data for this analysis for any variable except income, which had 30% missing data and was dealt with using multiple imputation as described above, except that more variables could be used to impute income (data source, sex, age, race and educational level were used).
To incorporate the sampling weights into the logistic regression, we used the SAS procedure proc surveylogistic, which incorporates weighted data into its regression without inappropriately overestimating sample size.
To examine clinical risk factors, we replaced the census microdata control population with the SPHHS population survey as the control population. Less precise data on income were available for the SPHHS dataset but, with that limitation, income was also included in this model, incorporating sampling weights as described above.
For selected risk factors, we calculated the population attributable risk (PAR), a measure of the reduction in incidence that would be observed if a given exposure were no longer present in the population. PAR was calculated as p∗(OR−1)/[p∗(OR−1)+1], where p is the prevalence of exposure [Reference Rothman21]. Because PARs are difficult to interpret when the population is divided into many exposure strata, age, income, and education were dichotomized for PAR calculation.
In a final exploratory analytical step, participants who provided both household income and address were geocoded and linked to census data to determine the median income in their census block-group of residence. A simple stratified analysis, without imputation, was conducted in this group showing rates of disease stratified by race and self-reported income compared to race and census median block-group income. The purpose of this analysis was to explore whether census median block-group income is an appropriate proxy for self-reported income in assessment of socioeconomic status [Reference Chen22].
This study was approved by the Institutional Review Board at the University of Pennsylvania and at all participating hospitals. Participants completing telephone interviews provided written informed consent.
RESULTS
Between 31 March 2002 and 1 April 2004, 609 cases of BPP were identified and microbiologically confirmed. Fifty-four percent of cases were female and 74% were aged ⩾50 years. Race was known for 377 (62%) cases. A total of 281 subjects (46%) completed the telephone interview. Among interviewed subjects, diabetes mellitus was present in 23%, asthma in 25%, and current smoking in 73% (Table 1).
Table 1. Characteristics of subjects with bacteraemic pneumococcal pneumonia
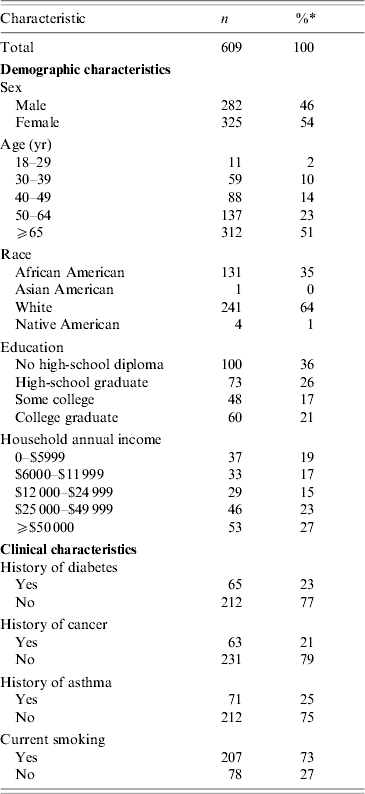
* Percentages for characteristics represent percentage of individuals without missing data on that variable. The number of subjects with missing data varied as follows: sex (2), age (2), race (232), education (326), household income (411), diabetes (332), cancer (294), asthma (236), smoking (324).
The overall adult population rate of BPP was 10·6 [95% confidence interval (CI) 9·8–11·4] cases/100 000 person-years. Identical rates were noted for each gender. The incidence rose steadily with age, from <1 (95% CI 0·4–1·5) case/100 000 person-years for 18- to 29-year-olds up to 29·0 (95% CI 25·8–32·3) for individuals aged >65 years (Table 2).
Table 2. Annual population rates of bacteraemic pneumococcal pneumonia
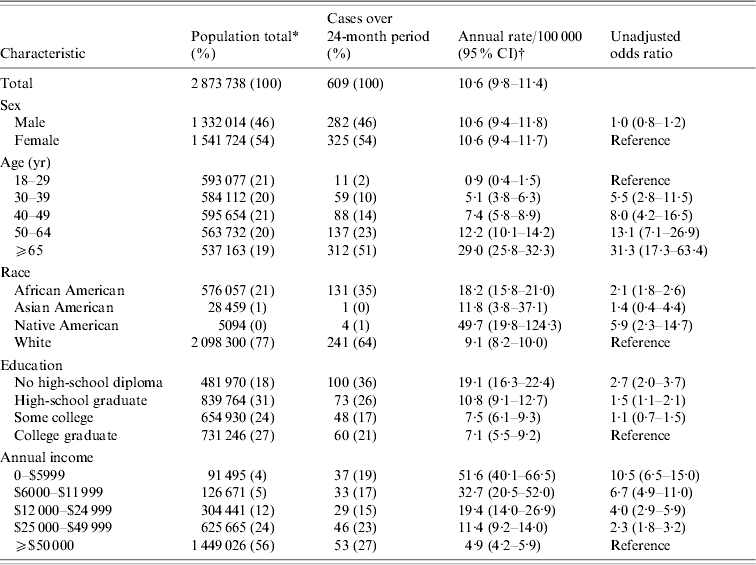
* Estimates of population at risk based on 2000 U.S. Census microdata.
† Point estimates and confidence intervals estimated based on multiple imputation of missing data for each category.
In cases with recorded race, 64% self-reported as white and 35% as African American After estimation of missing race using multiple imputation, the incidence of BPP was 18·2 (95% CI 15·8–21·0) cases/100 000 person-years for African Americans, 9·1 (95% CI 8·2–10·0) for whites, and 49·7 (95% CI 19·8–124·3) for Native Americans.
In terms of educational level, the incidence of BPP for individuals without a high-school diploma was 19·1 (95% CI 16·3–22·4) cases/100 000 person-years. For individuals with high- school diplomas the incidence was 10·8 (95% CI 9·1–12·7) cases/100 000 person-years, compared to 7·1 (95% CI 5·5–9·2) for individuals who completed a college education.
In terms of household income, the incidence of BPP for individuals with incomes <$6000 per year was 51·6 (95% CI 40·1–66·5) cases/100 000 person-years compared to 4·9 (95% CI 4·2–5·9) for individuals with incomes ⩾$50 000 per year.
Table 3 presents the population rates of BPP stratified by clinical risk factors. The incidence of BPP was 31·5 (95% CI 25·2–39·3) cases/100 000 person-years for individuals with histories of diabetes compared to 8·3 (95% CI 7·5–9·3) for individuals without diabetes. For individuals with a history of cancer the incidence was 36·7 (95% CI 29·6–45·5) cases/100 000 person-years compared to 8·4 (95% CI 7·6–9·3) for individuals without cancer. For individuals with a history of asthma, the incidence was 21·1 (95% CI 16·7–26·6) cases/100 000 person-years compared to 8·8 (95% CI 7·9–9·8) for individuals without a history of asthma. For individuals with a history of current smoking, incidence was 16·3 (95% CI 14·6–18·1) cases/100 000 person- years compared to 5·1 (95% CI 4·2–6·2) for non-smokers.
Table 3. Annual population rates of bacteraemic pneumococcal pneumonia stratified by clinical risk groups
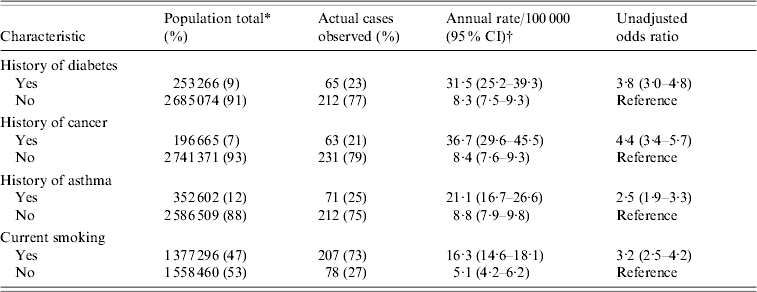
* Estimates of at risk population based on 2004 Southeastern Pennsylvania Household Health Survey (SPHSS).
† Point estimates and confidence intervals estimated based on multiple imputation of missing data for each category.
Adjusted analyses were conducted to better understand the relationship between the high apparent incidence in low-income individuals and other risk factors. In brief, unadjusted risk ratios were consistent with the unstratified incidences reported in Tables 2 and 3.
The highest relative risks after multivariable adjustment were advanced age, i.e. >65 years (OR 19·2, 95% CI 8·4–43·8), income <$6000 per year (OR 11·5, 95% CI 7·4–18·1), and Native American race (OR 8·7, 95% CI 3·1–24·5) (Table 4). Upon multivariable adjustment African American race was associated with a modest increase in risk (OR 1·4, 95% CI 1·1–1·9) and there was no consistent association between educational attainment and risk (OR 0·7, 95% CI 0·5–1·1) for individuals with less than a high-school diploma).
Table 4. Adjusted demographic risk factors for bacteraemic pneumococcal pneumonia
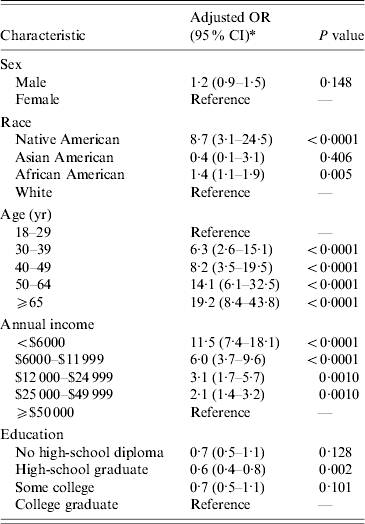
* Odds ratios, confidence limits, and P values from logistic regression incorporating sampling weights (proc surveylogistic) using multiple imputation for missing data and adjusting for all variables in the table. Control population data from 2000 U.S. Census microdata.
A second set of regressions was conducted using SPHSS data as control data (Table 5). These regressions yielded results broadly consistent with the census-based analysis. The only inconsistency was that education was significantly associated with disease even when all variables were included in the model (OR 2·2, 95% CI 1·4–3·6). In addition the association between disease and income was weaker (OR 4·7, 95% CI 2·9–7·9). It should be noted that income was not as finely categorized in the SPHSS data as in the census data, so that this analysis divided income into fewer categories. These estimates were not materially affected by the inclusion of clinical risk factors in the model. However, many of these clinical risk factors were statistically significant, including a history of diabetes (OR 1·4, 95% CI 1·0–2·0), a history of asthma (OR 2·1, 95% CI 1·5–2·9), a history of cancer (OR 2·2, 95% CI 1·5–3·1) and current smoking (OR 2·2, 95% CI 1·7–3·0). With both control datasets, we did not measure significant interactions between age and income, or race and income, nor did inclusion of those interaction terms significantly alter the remaining odds ratios in the model.
Table 5. Adjusted demographic and clinical risk factors for bacteraemic pneumococcal pneumonia
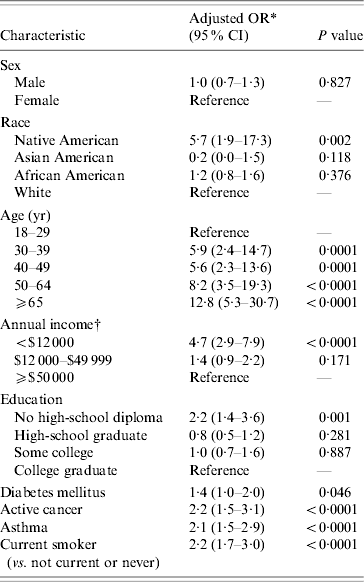
* Odds ratios and P values from logistic regression incorporating sampling weights (proc surveylogistic) using multiple imputation for missing data and adjusting for all variables in the table. Control population data from 2004 Southeastern Pennsylvania Household Health Survey (SPHSS).
† Subjects in the SPHSS dataset were categorized into fewer income categories than used in the telephone survey of cases. To permit merging of the two datasets, income categories in our survey were combined.
A stratified analysis was also conducted comparing the association with disease of self-reported income vs. census median block-group income, after stratification by race (Table 6). After stratification by race, individuals in the lower self-reported income group experienced a significantly higher apparent rate of disease (white race: OR 6·4, 95% CI 2·5–20·9; African American race: OR 5·6 95% CI 3·8–8·5). In contrast, when census block-group median income was instead used as a proxy for personal income, no such relationship was evident.
Table 6. Impact of source of income data on measured association between income and disease risk, stratified by race
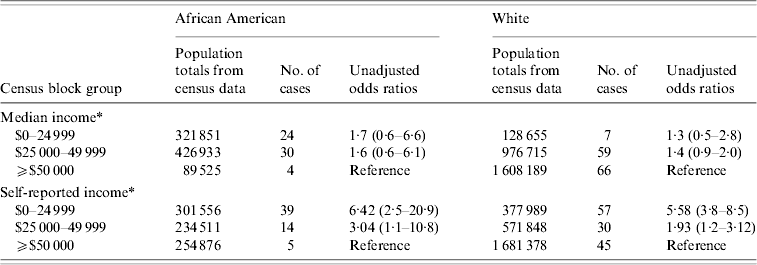
* In the first three rows of data income refers to the median annual household income from Census 2000 by block group where the case or control resided. In the final three rows of data, income is the annual income self-reported by the case or control.
PARs were calculated for significant risk factors identified in the census-based multivariable analysis. Native American race had a PAR of 0·1%, while African American race had a PAR of 5·4%. Age >65 years had a PAR of 19·2% compared to all other age groups. Less than a high-school education was associated with a PAR of <0. Income <$6000 had a PAR of 16·5%.
Results from the SPHSS-based analysis were broadly consistent except that education at less than a high-school level had a positive PAR of 9·7%. In addition this analysis gave PARs for clinical risk factors of 3·6% for diabetes, 8·0% for cancer, 12·1% for asthma, and 35·6% for current smoking.
DISCUSSION
Population-based surveillance for BPP in the greater Philadelphia region produced overall and age-group incidence rates that are consistent with previously published both pre- and post-conjugate vaccine [Reference Butler and Tuomanen5, Reference Chen22]. Estimates based on race were also consistent with recent reports [Reference Flannery3]. In terms of clinical risk factors, our study confirms recent findings that smoking is an independent risk factor for pneumococcal disease, as well as confirming the association between pneumococcal disease and specific comorbidities, including asthma, diabetes, and cancer [Reference Talbot23–Reference Nuorti25]. Our study adds to this literature with limited data indicating that socioeconomic factors are also significant risk factors for disease. In particular this study suggests that lower income levels are potent risk factors for BPP. This effect was robust to adjustment for age, race, education, and clinical risk factors. In these adjusted analysis, African American race was associated with a relative risk of infection closer to the null.
These data suggest that income deserves more attention than it usually receives as a risk factor for BPP. These observations are relevant to clinical decision making and policy relating to the adult pneumococcal vaccine. Recent studies have suggested new indications for adult pneumococcal vaccination, including history of smoking or asthma [Reference Talbot23, Reference Nuorti25]. African American race has been used in the past to guide targeting of pneumococcal vaccine for children and is often cited as a significant risk factor in adults [4, Reference Davis10, 26].
African American race's effect appears to be attenuated when other variables, especially income, are taken into account. This raises the question of whether attention given to racial disparities in pneumococcal disease might be better directed towards socioeconomic disparities. Analysis using PARs indicates a higher number of cases (16·5%) may be associated with income <$6000 than with African American race (5·4%).
Income has probably received relatively little attention as a risk factor for invasive pneumococcal disease for several reasons. First, its effect is difficult to establish except through studies in which income information is obtained through an interview or survey. Most surveillance studies of pneumococcal disease have not gathered this information. One study which showed little relationship between income and risk used census-based median household income information, a measure that we have shown in the present study that may not be an adequate proxy for individual income [Reference Chen22]. Second, low income appears to have its most dramatic effects found in extremely poor individuals. Another study that included self-reported household income aggregated all individuals reporting <$15 000 income per year, which would tend to conceal the high risk below $12 000 and $6000 annual income [Reference Nuorti25].
Any higher risk associated with lower income is presumably mediated by other factors. Examples of risk factors for invasive pneumococcal disease that could explain the effect of low income but could not be adjusted for in this study include homelessness, insurance status, and crowded living conditions. In fact, one study showed a 27-fold increase in rates of BPP in homeless individuals over the general population [Reference Shariatzadeh27]. These observations favour the idea that some circumstances associated with extreme poverty lead to a great concentration of the pneumococcal disease burden in the very poor. Moreover, because we did not have sufficient data to incorporate vaccine status into the multivariable analysis, it is possible that some of the observed income disparity is driven by differential vaccination rates in both children and adults.
Other observations of interest from this study include the very high PAR seen for smoking (35·6%), a figure driven by the high prevalence of smoking observed in the SPHSS database. This observation supports the public policy relevance of work by Nuorti et al. [Reference Nuorti25].
One limitation of our study is the possibility that case ascertainment is not 100% sensitive. Our network identified virtually all cases identified by the Philadelphia Department of Health as well as a substantial number of cases that they did not identify [Reference Metlay12]. We believe it is unlikely that there is a large or differential bias resulting from unidentified cases, but it is possible. Another limitation is the lack of sufficient power to fully study interactions: exploratory analyses did not identify significant age or race interactions with income, but insufficient numbers of cases were available to adequately characterize any interaction of age and income effects.
A third limitation of the present study is the high level of missing data on key demographic and clinical variables (e.g. pneumococcal vaccination status). The incidence rate estimates for clinical risk factors and for income in particular are compromised by very high levels of missing data (67·5%). As with most studies that only capture a portion of individuals with a disease, conclusions may affected by participation bias. Therefore, it is important to state that the results pertaining to income are hypothesis-generating. The principal conclusion of this study is that income and other socioeconomic markers should be a priority in data collection by future surveillance work. Investigating the basis for persistent disparities in pneumococcal disease risk is important in identifying high-risk groups for targeted interventions.
ACKNOWLEDGEMENTS
This project was supported by grant R01-AI46645 from the National Institute of Allergy and Infectious Diseases, National Institutes of Health. Dr Metlay was supported by an Advanced Research Career Development Award from the Health Services Research and Development Service of the Department of Veterans Affairs. Neither funding agency had any role in the design and conduct of the study; collection, management, analysis and interpretation of the data; or preparation, review or approval of the manuscript. The authors acknowledge the valuable contributions of Linda Crossette, M.P.H., at the University of Pennsylvania, for coordinating the activities of this study, and the staff at the Clinical Microbiology Laboratory of the Hospital of the University of Pennsylvania for the microbiology testing.
DECLARATION OF INTEREST
None.


