Work is a frequently stated goal of people with schizophrenia (Reference Secker, Grove and SeebohmSecker et al, 2001), but their employment rate is low. Recent European estimates of employment rates in this group range from 8 to 35% (Reference Gaite, Vazquez-Barquero and BorraGaite et al, 2002). Individual factors (such as job histories), illness-related factors (such as illness severity) and societal conditions (such as discrimination and social welfare policy) are all potential contributors to variations in employment rates. Work history and negative or cognitive symptoms of schizophrenia have consistently been found to be predictors of employment status (Reference Cook and RazzannoCook & Razzano, 2000; Reference Marwaha and JohnsonMarwaha & Johnson, 2004). Most previous studies have had small sample sizes, or recruited exclusively from rehabilitation services. The aim of our study was to examine employment patterns and variables associated with working in a large representative sample of people with schizophrenia resident in Germany, France and the UK. No previous analysis has been international and based on so large a sample.
METHOD
The European Schizophrenia Cohort (EuroSC) study is a naturalistic, 2-year follow-up of people aged 18–64 years who have schizophrenia and are in contact with secondary psychiatric services. A full explanation of the rationale and methods of the study, together with a description of the mental health services from which the samples were drawn, is presented by Bebbington et al (Reference Bebbington, Angermeyer and Azorin2005).
Study sites
In France, participants were recruited from three centres: Lille (northern France), Lyon and Clermont-Ferrand (central France) and Marseille and Toulon (southern France). These centres are referred to hereafter as Lille, Lyon and Marseille. In former East Germany, participants were recruited from Leipzig and from the Altenburg area and the smaller towns and villages surrounding it. Data from these areas were pooled, and are referred to subsequently as the Leipzig centre. In West Germany, recruitment was from the Hemer district, including the cities of Hemer, Iserlohn and Werdohl, and from the Heilbronn district, including the city of Eppingen and surrounding towns and villages. The centres in the UK were the county of Leicestershire (excluding the city of Leicester but including surrounding towns and villages) and the inner-London borough of Islington.
Sampling
The participants were selected to provide a representative sample of people with schizophrenia under the care of secondary mental health services. People who had recently lost contact with services were not included, except in the London sample. Sampling was achieved in London and in all the French centres by establishing a list of all people with a psychotic diagnosis in the areas from information already kept by the mental health services and taking a random sample from all those identified. In the London centre patients were randomly sampled from the whole local list, whereas in France sampling was stratified so that within each centre ten patients were randomly selected from each of the ten local sectors.
In Germany and in Leicestershire, lists of all potential participants in each catchment area were compiled and all eligible people were included in the sample. In all centres, a diagnosis of schizophrenia was confirmed after an interview using structured instruments by a study investigator who applied the DSM–IV criteria (American Psychiatric Association, 1994).
Patients were eligible for inclusion if they were aged 18–64 years, had a diagnosis of schizophrenia according to DSM–IV criteria and gave informed consent. Patients who had been continuously in hospital for the previous 12 months, or were currently homeless or planning to move (and therefore unavailable for follow-up) were excluded.
Instruments
An extensive battery of instruments was used to collect information at interview, but only those relevant to this analysis are presented here. Employment data were obtained through the Lehman Quality of Life Interview (Reference LehmanLehman, 1983); this establishes whether participants are currently employed and, if relevant, their job title. Questions on receipt of welfare benefits are also included in this interview. Psychiatric and social history, including educational history and whether participants had ever been employed, was recorded using the Past History and Socio-demographic Description Schedule (World Health Organization, 1973).
The Schedule for Clinical Assessment in Neuropsychiatry (SCAN; Reference Wing, Babor and BurkeWing et al, 1990; World Health Organization, 1992) was used to establish a DSM–IV diagnosis of schizophrenia in the UK and Germany, whereas the French centres used the Structured Clinical Interview for DSM–IV (Reference First, Spitzer and WilliamsFirst et al, 1997). Part of the alcohol and substance misuse data available from the SCAN allowed the coding of variables indicating lifetime history of alcohol and drug misuse. Information on the participants' current symptom profile was collected through the Positive and Negative Syndrome Scale (PANSS; Kay et al, Reference Kay, Opler and Lindenmayer1987, Reference Kay, Opler and Lindenmayer1989). The summary indicators from the PANSS used in this analysis were the positive, negative and general psychopathology symptom sub-scores. The general psychopathology section covers a wide variety of non-psychotic symptoms, and includes measures of anxiety and depression, unco-operativeness, cognitive symptoms, impulse control and social avoidance.
Adherence was evaluated using the Rating of Medication Influences scale (ROMI; Reference Weiden, Rapkin and MottWeiden et al, 1994). This assesses subjective attitudes and behaviours that influence patients' compliance with antipsychotic medication. It yields a total ‘reasons for compliance’ score, higher in people who are more willing to take medication, and a ‘reasons for non-compliance’ score, higher in people who are more reluctant.
The European Service Mapping Schedule (ESMS; Reference Johnson and KuhlmannJohnson et al, 2000) was used to describe and classify the mental health services available in all three sites. Vocational services are known to affect the employment rate in schizophrenia (Reference Drake, Fox and LeatherDrake et al, 1998), and this study allowed us to consider if any variation in employment rate between sites might be linked to employment service provision.
Combined training was held involving interviewers from all three sites, to try to ensure instruments were used reliably. However, no formal assessment was made of reliability between centres. For those instruments not already available in French and German, translation followed the comprehensive procedures recommended by the World Health Organization (Reference Sartorius, Kuyken, Orley and KuykenSartorius & Kuyken, 1994), including back-translation.
Analysis
We analysed the baseline data of this 2-year cohort with the aims of describing patterns of employment and exploring which candidate explanatory variables were independently associated with likelihood of being employed in this large international sample. Descriptive analyses and univariate tests were carried out using the Statistical Package for the Social Sciences version 11.5 and the subsequent logistic regression using Stata version 8 for Windows. Employment was broadly defined as having any job, whether full-time or part-time and whether obtained through the open labour market, sheltered vocational schemes or the voluntary sector. A broad definition of working was used because quantitative and qualitative studies exploring the attitudes of people with schizophrenia to employment suggest that people desire a range of different types of employment, not only full-time competitive paid work (Reference Secker, Grove and SeebohmSecker et al, 2001; Reference HoneyHoney, 2004; Reference Marwaha and JohnsonMarwaha & Johnson, 2005). Whether a person was working according to this definition was the main variable used in the analyses. Within the employed group we also examined how many in each centre were supporting themselves solely with earnings, and how many were working but also claiming some form of welfare benefits.
The analysis was conducted in a number of stages. Descriptive analyses were conducted of patterns of employment in each centre: current rates of employment and types of jobs; the number of people employed and supporting themselves through earnings only; and the percentage of people never employed.
Using χ2 tests for categorical outcomes and t-tests for continuous outcomes, we analysed the association of employment with various explanatory variables derived from a literature review on correlates of employment among people with schizophrenia (Reference Marwaha and JohnsonMarwaha & Johnson, 2004). These correlates were educational history, negative and positive symptom severity, gender, marital status, accommodation and living conditions. We also identified and tested the association with working of a number of other potential variables of interest: area of residence (study centre), general population employment rate in area of residence, adherence to medication, course of illness, age at illness onset, length of illness, lifetime history of alcohol or drug misuse and ethnic group.
Previous analyses of this data-set (Reference Bebbington, Angermeyer and AzorinBebbington et al, 2005) had established the presence of differences between the three countries in social and clinical sample characteristics, and we therefore repeated each of these univariate analyses stratified by country. German centres did not code ethnicity in the same way as the UK and French sites, and German participants could therefore only be classified as ‘born in Germany’ or ‘German resident but born outside’. Separate analyses were therefore made for each country examining the association between ethnic group (or, in the case of Germany, where born) and employment. Logistic regression was then used to identify explanatory variables independently associated with employment using the ‘enter’ method, in which all independent variables are entered into the equation at the same time. Variables associated with employment on univariate analyses at the P<0.1 level of significance were entered into the model as independent variables. Ethnicity was excluded as a variable in the logistic regression because of a lack of uniformity in the way it was categorised across the three countries. Lack of independence for observations regarding individuals within the same centre was allowed for in this analysis by computing robust standard errors, clustered on centre (Reference RogersRogers, 1993).
RESULTS
In total, 1208 people with schizophrenia participated in the study: 288 in France, 302 in the UK and 618 in Germany. Gender distribution varied between countries: 64.6% of participants in the UK, 69.4% in France and 56.3% in Germany were male. The mean age was approximately 40 years in all three countries, but marital status and living conditions differed significantly. Similar numbers of participants were living alone in each country, but more German respondents were living with partners and/or children, and more French respondents with their parents. Participants in France were the most symptomatic, with a mean total PANSS score of 71, followed by scores of 56 in Germany and 48 in the UK. The clinical and socio-demographic profiles of the sample are described in more detail by Bebbington et al (Reference Bebbington, Angermeyer and Azorin2005).
Employment
Table 1 shows employment rates in each centre. The employment rate in the general population in the regions in which the centres lie is also shown. The overall employment rate of participants was 21.5%, but varied between countries and sites, with rates of 12.9% in the UK, 11.5% in France and 30.3% in Germany. This compares with general population employment rates of 71.0% in the UK, 62.2% in France and 65.4% in Germany in the year 2000 (European Commission, 2002).
Table 1 Participant numbers and employment rates by site

| London | Leicestershire | Lille | Lyon | Marseille | Leipzig | Hemer | Heilbronn | χ2 | P | |
|---|---|---|---|---|---|---|---|---|---|---|
| Regional employment rate, % 1 | 64.8 | 75.4 | 52.5 | 63.5 | 56.7 | 61.5 | 61.2 | 66.8 | ||
| Sample size, n | 150 | 152 | 101 | 100 | 87 | 398 | 120 | 100 | ||
| Employment, n (%) | ||||||||||
| Total working (broad definition) | 10 (6.7) | 29 (19.1) | 8 (7.9) | 10 (10.0) | 15 (17.2) | 95 (23.9) | 32 (26.7) | 60 (60.0) | 131.2 | <0.0005 |
| Employed and supporting self with earnings only | 4 (2.7) | 23 (15.1) | 5 (5.0) | 8 (8.0) | 9 (10.3) | 36 (9.1) | 22 (18.3) | 15 (15.0) | ||
| Working and receiving benefits | 6 (4.0) | 6 (3.9) | 3 (3.0) | 2 (2.0) | 6 (6.9) | 59 (14.9) | 10 (8.3) | 45 (45.0) | ||
| Unemployed | 140 (93.3) | 123 (80.9) | 93 (92.0) | 90 (90.0) | 72 (82.8) | 302 (75.9) | 88 (73.3) | 40 (40.0) | ||
| Never employed | 22 (15.8) | 1 (0.8) | 9 (9.9) | 4 (4.4) | 28 (38.9) | 12 (3.0) | 8 (7.1) | 11 (11.0) | 99.3 | <0.0005 |
| (n=139) | (n=125) | (n=91) | (n=91) | (n=72) | (n=398) | (n=112) | (n=100) |
1. Source EUROSTAT (http://www.europa.eu.int/comm.eurostat) annual average in 2000 (the figures refer to the employment rate in the regions in which the centres lie)
The proportion of people in each country who were supporting themselves entirely through working and were not receiving welfare benefits was 8.9% in the UK, 7.6% in France and 11.8% in Germany. The German centres thus had the highest proportion of people working as well as the highest proportion supporting themselves entirely through work, although the difference in the latter was less striking. The number of people in each centre who had never been employed was low, apart from in Marseille.
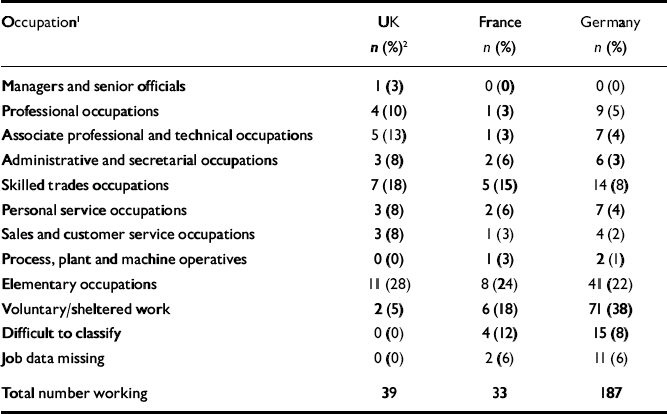
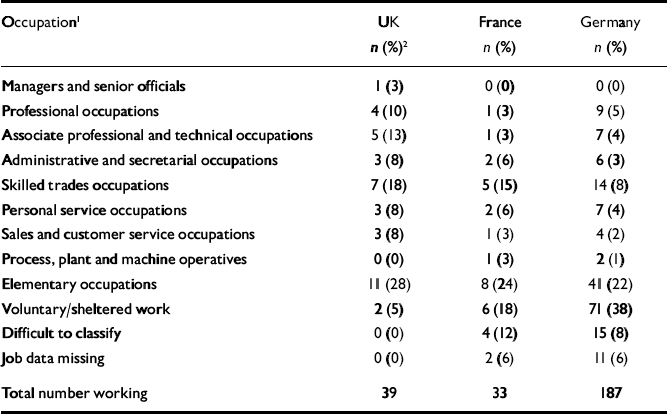
Table 2 describes the jobs of study participants, using the UK Standard Occupational Classification 2000 (Office for National Statistics, 2000) for the sake of uniformity. In all three countries people with schizophrenia appeared to work in nearly all sections of the job market. The most common types of work were ‘elementary’ jobs, such as cleaning and labouring, and ‘skilled trade occupations’, such as plumbing or metalwork. The proportion of people working in senior official or managerial positions or as process plant and machine operatives was very small. More people in Germany were doing sheltered or voluntary work.
Table 2 Job type of those working
| Occupation 1 | UK n (%) 2 | France n (%) | Germany n (%) |
|---|---|---|---|
| Managers and senior officials | 1 (3) | 0 (0) | 0 (0) |
| Professional occupations | 4 (10) | 1 (3) | 9 (5) |
| Associate professional and technical occupations | 5 (13) | 1 (3) | 7 (4) |
| Administrative and secretarial occupations | 3 (8) | 2 (6) | 6 (3) |
| Skilled trades occupations | 7 (18) | 5 (15) | 14 (8) |
| Personal service occupations | 3 (8) | 2 (6) | 7 (4) |
| Sales and customer service occupations | 3 (8) | 1 (3) | 4 (2) |
| Process, plant and machine operatives | 0 (0) | 1 (3) | 2 (1) |
| Elementary occupations | 11 (28) | 8 (24) | 41 (22) |
| Voluntary/sheltered work | 2 (5) | 6 (18) | 71 (38) |
| Difficult to classify | 0 (0) | 4 (12) | 15 (8) |
| Job data missing | 0 (0) | 2 (6) | 11 (6) |
| Total number working | 39 | 33 | 187 |
1. Classified according to the Standard Occupation Classification 2000 UK
2. Percentages of the total group who are working within each country
Employment service characteristics of the three sites
The main difference in employment service configurations, mapped using the ESMS, was that the German centres had more vocational services and more placements provided within these than the other two countries. This was particularly the case for high-intensity work services and high-intensity work-related services. The ESMS defines the former as services offering work placements for at least 2 days a week paid at a rate at least 50% of the local minimum wage, and the latter as services that offer placements 2 days a week but at a rate of pay below 50% of the local minimum wage. Of the German centres, Heilbronn had the greatest number of patients currently in placements, but mostly in supported work activities paid below 50% of the minimum wage. Few vocational services were recorded in France, but the French centres did not include social services or voluntary sector provision in their data collection. In London there were some work activities within day centre settings, but few formal sheltered or supported work schemes.
Unadjusted analyses
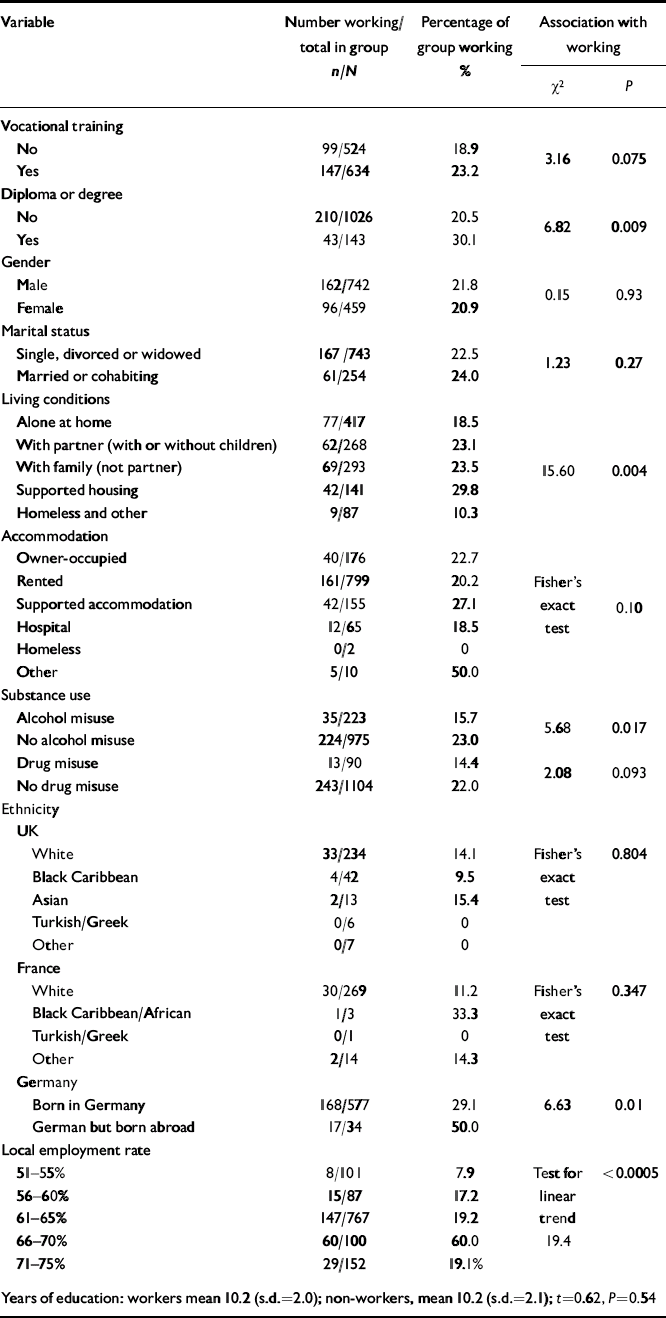
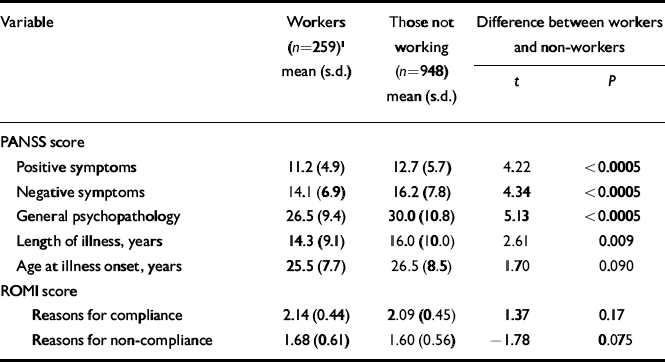
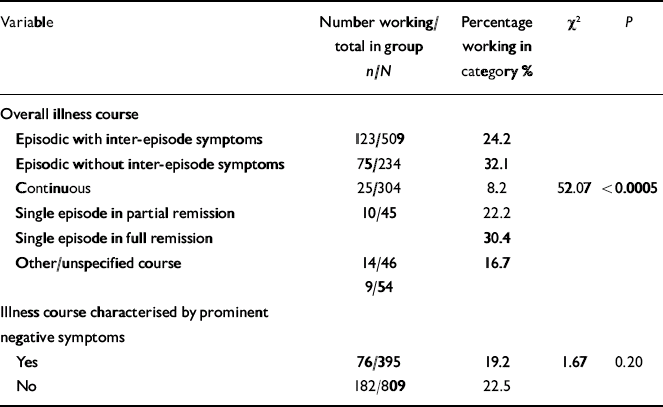
Employment was significantly associated with area of residence, having a diploma or degree, living conditions, alcohol misuse, general population employment rate in area of residence, more severe positive, negative and general psychopathology symptoms, longer length of illness and illness course (Tables 3, 4, 5). In Germany, foreign-born people were more likely to be working. The associations with illness variables were particularly highly significant on these analyses, as were the associations with area of residence. On repeating each of the analyses in Tables 3, 4, 5 stratifying by country, the direction of the relationships remained essentially the same, although reduced power rendered some of the associations non-significant at the 5% level.
Table 3 Work and social variables
| Variable | Number working/total in group n/N | Percentage of group working % | Association with working | ||
|---|---|---|---|---|---|
| χ2 | P | ||||
| Vocational training | |||||
| No | 99/524 | 18.9 | 3.16 | 0.075 | |
| Yes | 147/634 | 23.2 | |||
| Diploma or degree | |||||
| No | 210/1026 | 20.5 | 6.82 | 0.009 | |
| Yes | 43/143 | 30.1 | |||
| Gender | |||||
| Male | 162/742 | 21.8 | 0.15 | 0.93 | |
| Female | 96/459 | 20.9 | |||
| Marital status | |||||
| Single, divorced or widowed | 167/743 | 22.5 | 1.23 | 0.27 | |
| Married or cohabiting | 61/254 | 24.0 | |||
| Living conditions | |||||
| Alone at home | 77/417 | 18.5 | |||
| With partner (with or without children) | 62/268 | 23.1 | |||
| With family (not partner) | 69/293 | 23.5 | 15.60 | 0.004 | |
| Supported housing | 42/141 | 29.8 | |||
| Homeless and other | 9/87 | 10.3 | |||
| Accommodation | |||||
| Owner-occupied | 40/176 | 22.7 | |||
| Rented | 161/799 | 20.2 | Fisher's | ||
| Supported accommodation | 42/155 | 27.1 | exact | 0.10 | |
| Hospital | 12/65 | 18.5 | test | ||
| Homeless | 0/2 | 0 | |||
| Other | 5/10 | 50.0 | |||
| Substance use | |||||
| Alcohol misuse | 35/223 | 15.7 | 5.68 | 0.017 | |
| No alcohol misuse | 224/975 | 23.0 | |||
| Drug misuse | 13/90 | 14.4 | 2.08 | 0.093 | |
| No drug misuse | 243/1104 | 22.0 | |||
| Ethnicity | |||||
| UK | |||||
| White | 33/234 | 14.1 | Fisher's | 0.804 | |
| Black Caribbean | 4/42 | 9.5 | exact | ||
| Asian | 2/13 | 15.4 | test | ||
| Turkish/Greek | 0/6 | 0 | |||
| Other | 0/7 | 0 | |||
| France | |||||
| White | 30/269 | 11.2 | Fisher's | 0.347 | |
| Black Caribbean/African | 1/3 | 33.3 | exact | ||
| Turkish/Greek | 0/1 | 0 | test | ||
| Other | 2/14 | 14.3 | |||
| Germany | |||||
| Born in Germany | 168/577 | 29.1 | 6.63 | 0.01 | |
| German but born abroad | 17/34 | 50.0 | |||
| Local employment rate | |||||
| 51–55% | 8/101 | 7.9 | Test for | <0.0005 | |
| 56–60% | 15/87 | 17.2 | linear | ||
| 61–65% | 147/767 | 19.2 | trend | ||
| 66–70% | 60/100 | 60.0 | 19.4 | ||
| 71–75% | 29/152 | 19.1% | |||
Years of education: workers mean 10.2 (s.d.=2.0); non-workers, mean 10.2 (s.d.=2.1); t=0.62, P=0.54
Table 4 Work and clinical variables
| Variable | Workers (n=259) 1 mean (s.d.) | Those not working (n=948) mean (s.d.) | Difference between workers and non-workers | ||
|---|---|---|---|---|---|
| t | P | ||||
| PANSS score | |||||
| Positive symptoms | 11.2 (4.9) | 12.7 (5.7) | 4.22 | <0.0005 | |
| Negative symptoms | 14.1 (6.9) | 16.2 (7.8) | 4.34 | <0.0005 | |
| General psychopathology | 26.5 (9.4) | 30.0 (10.8) | 5.13 | <0.0005 | |
| Length of illness, years | 14.3 (9.1) | 16.0 (10.0) | 2.61 | 0.009 | |
| Age at illness onset, years | 25.5 (7.7) | 26.5 (8.5) | 1.70 | 0.090 | |
| ROMI score | |||||
| Reasons for compliance | 2.14 (0.44) | 2.09 (0.45) | 1.37 | 0.17 | |
| Reasons for non-compliance | 1.68 (0.61) | 1.60 (0.56) | –1.78 | 0.075 | |
PANSS, Positive and Negative Syndrome Scale; ROMI, Rating of Medication Influences
Table 5 Work and illness course
| Variable | Number working/total in group n/N | Percentage working in category % | χ2 | P |
|---|---|---|---|---|
| Overall illness course | ||||
| Episodic with inter-episode symptoms | 123/509 | 24.2 | ||
| Episodic without inter-episode symptoms | 75/234 | 32.1 | ||
| Continuous | 25/304 | 8.2 | 52.07 | <0.0005 |
| Single episode in partial remission | 10/45 | 22.2 | ||
| Single episode in full remission | 30.4 | |||
| Other/unspecified course | 14/46 | 16.7 | ||
| 9/54 | ||||
| Illness course characterised by prominent negative symptoms | ||||
| Yes | 76/395 | 19.2 | 1.67 | 0.20 |
| No | 182/809 | 22.5 |
1. There are missing values for some variables: the greatest number of missing values is for reasons for compliance, where there are 935 ratings for the non-workers and 256 for the workers
Logistic regression
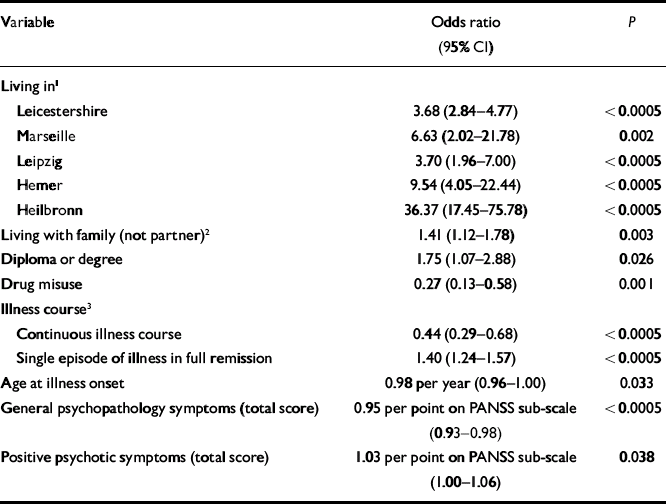
Table 6 shows the final regression model, which explained 19% of the variance in employment status. Vocational training, regional employment rate, negative symptom score, alcohol misuse, duration of illness and reasons for non-compliance score were all entered into the regression, but did not reach the P=0.05 threshold for significance and were omitted from the final model. People with schizophrenia living in Leicestershire, Marseille, Leipzig, Hemer and Heilbronn all had higher odds of being employed than those living in London. Living with family (other than a partner), having a degree or a diploma, and having experienced only one episode of illness with full remission also improved the odds of working. A continuous illness course, higher general psychopathology scores on the PANSS, earlier onset of illness and a history of drug misuse all reduced the odds of current employment. A higher PANSS positive symptom score was associated with a greater likelihood of working, a reversal of the effect observed on unadjusted analysis, but this effect was a weak one.
Table 6 Variables significantly associated with working (broad definition) in logistic regression (analysed, n=1158; percentage correctly classified by model, 80.14%; pseudo R 2=0.19 (this provides an estimate of the variance explained by the model)
| Variable | Odds ratio (95% CI) | P |
|---|---|---|
| Living in 1 | ||
| Leicestershire | 3.68 (2.84–4.77) | <0.0005 |
| Marseille | 6.63 (2.02–21.78) | 0.002 |
| Leipzig | 3.70 (1.96–7.00) | <0.0005 |
| Hemer | 9.54 (4.05–22.44) | <0.0005 |
| Heilbronn | 36.37 (17.45–75.78) | <0.0005 |
| Living with family (not partner) 2 | 1.41 (1.12–1.78) | 0.003 |
| Diploma or degree | 1.75 (1.07–2.88) | 0.026 |
| Drug misuse | 0.27 (0.13–0.58) | 0.001 |
| Illness course 3 | ||
| Continuous illness course | 0.44 (0.29–0.68) | <0.0005 |
| Single episode of illness in full remission | 1.40 (1.24–1.57) | <0.0005 |
| Age at illness onset | 0.98 per year (0.96–1.00) | 0.033 |
| General psychopathology symptoms (total score) | 0.95 per point on PANSS sub-scale (0.93–0.98) | <0.0005 |
| Positive psychotic symptoms (total score) | 1.03 per point on PANSS sub-scale (1.00–1.06) | 0.038 |
PANSS, Positive and Negative Syndrome Scale
1. The comparison centre was London; Lille and Lyon were not significantly different from London
2. Comparison category is ‘living alone’
3. Comparison category is single episode, partial remission
DISCUSSION
Comparison of employment rates between centres
This is the first international comparative study to report on employment patterns and on variables associated with working in people with schizophrenia. As in other recent studies, the employment rate in the UK sample was low, especially in London (UK700 Group, 1999; Reference Perkins and RinaldiPerkins & Rinaldi, 2002). The rate in France is equally concerning, at approximately a third of the German rate. The large numbers of unemployed people with schizophrenia represent a significant financial cost (Reference Huxley and ThornicroftHuxley & Thornicroft, 2003) to the welfare states of these three countries, and indicate considerable social exclusion among the mentally ill.
There was still greater variation in employment rates if centres rather than countries were analysed. Thus there was an approximately ten-fold difference in employment rate between London and Heilbronn. This is likely to be in part related to the characteristics of the areas from which the samples were drawn. The London sample was recruited from Islington, an inner-city area of considerable social deprivation. The employment rate was similarly low in the urban centres of Lille and Lyon. People in the UK recruited from the more affluent and suburban area of Leicestershire had a higher employment rate. City living also appears to have an adverse effect on employment in people with severe mental illness in the USA (Reference Drake, Fox and LeatherDrake et al, 1998). The large variations between centres, which were not accounted for by differences in clinical and socio-demographic characteristics of the samples, suggest that social and service factors that vary between countries and regions are likely to be important.
Comparison of employment rates between people with schizophrenia and the general population
Compared with the rates in the general population, the employment rate in people with schizophrenia in all three countries was low. Univariate investigation of the relationship between regional general population employment and employment rates among the mentally ill appeared to lend some support to Warner's hypothesis that higher general population employment rates lead to better employment prospects for people with schizophrenia (Reference WarnerWarner, 2004). However, multivariate analysis did not support this. The nature of the relationship between employment rate among people with mental illness and local social factors, including general population employment rate and the ethnic and age structure of the population, is likely to be complex, not least because of the intervention of mental health services. The types of work available are likely also to be important, and the decline in availability of relatively unskilled and undemanding jobs may have especially affected people with schizophrenia (Reference NickellNickell, 2004). Other local and national factors that may contribute to variations between centres include professionals' and patients' attitudes and values regarding the feasibility and importance of work, the attitudes of employers and the public, the stigma patients experience in the labour market, benefits systems and employment law.
In most areas, the great majority of study participants had worked at some stage, the exception being Marseille, where a substantial proportion of the sample (38.9%) had never worked and the local general population employment rate was also low. The fact that most participants had worked earlier in their lives but no longer did so indicates that few people had fully recovered their social functioning. That services might not currently be achieving the best possible social recovery is suggested by the finding that even among those who had fully recovered after a single episode, the employment rate remained just below 30%.
Vocational services, benefits payments and employment rates
The variations between areas in employment rates were even larger than those between countries, and persisted when adjustment was made for patient characteristics and regional general population employment through regression analysis. Various societal factors that might account for these variations have already been discussed. Another possible explanation is the substantially greater provision of vocational services and placements in Germany. German centres had both the greatest numbers working in sheltered settings and relatively large numbers supporting themselves entirely through their earnings without recourse to state benefits. This suggests that the good availability of opportunities for combining work and benefits does not necessarily lead to people getting stuck in this situation, and may be associated with a greater proportion of people supporting themselves fully through open market earnings, although we cannot say whether there is a causal relationship.
Occupation
There was no large difference between the proportions of people in each country who worked in various types of job, but the numbers were small. Previous studies have suggested that people with schizophrenia tend to be in positions involving low levels of interpersonal interaction (Reference Morgan and GopalaswamyMorgan & Gopalaswamy 1983; Reference Bacani-Oropilla, Lippmann and TullyBacani-Oropilla et al, 1991). ‘Elementary’ occupations such as cleaning and labouring may be of this nature, as well as some skilled trades. Both were relatively highly represented.
Few people with schizophrenia were in managerial or senior official positions where training periods may be long, a series of promotions required and an episodic illness thus particularly damaging. It is surprising that more people were not working in information technology, given the expansion of this industry over the past decade. Overall, it appears that a diagnosis of schizophrenia is probably not a bar to doing any kind of job, but makes entry into certain job types less likely.
Social correlates of employment in people with schizophrenia
Living with family (other than a partner) was associated with a greater likelihood of working, persisting after adjusting for other independent variables. This may reflect better social support, enabling better social recovery. Ethnic group was not significantly associated with employment in the UK and French samples, although place of birth did emerge as important in Germany in the univariate analyses. Small numbers of minority ethnic group members limit conclusions about this. We did not explore in any detail the effects of cultural backgrounds and values on whether people worked, but these may have a role in explaining variations in employment rates.
Having a diploma or degree was significantly associated with employment. Acquisition of a tertiary education may reflect generally better premorbid functioning, associated with better overall outcomes, and possession of some qualifications may also broaden choice for those seeking to re-enter the labour market.
Clinical correlates of employment
Our finding that comorbid drug misuse was associated with lower odds of working supports a previous study indicating high levels of social exclusion among people with ‘dual diagnosis’ (Reference Todd, Green and HarrisonTodd et al, 2004). Substance misuse may well make job-seeking and good occupational functioning more difficult. Earlier onset of illness also reduced the odds of working, reflecting a poorer overall prognosis in people who become unwell earlier, and may also be related to fewer opportunities for training and employment before the onset of illness.
There have been contradictory findings in previous studies about whether the positive and negative symptoms of schizophrenia are significantly associated with employment status (Reference Anthony and JansenAnthony & Jansen, 1984; Reference Cook and RazzannoCook & Razzanno, 2000). Positive and negative symptoms were significantly associated with employment in the unadjusted analyses but no clear relationship was found on multivariate analysis. There was no significant association with negative symptoms, but a marginally significant (P=0.038; OR=1.03, 95% CI 1–1.06) tendency for more positive symptoms to be associated with a greater likelihood of working. The lack of the anticipated relationship between greater symptom severity and lower likelihood of working may well be due to the association between higher symptom scores and a continuous illness course, which substantially reduced the odds of employment. However, the presence of positive or negative symptoms should not be thought of as necessarily preventing people with schizophrenia returning to the labour market.
We found that the symptoms assessed by the general psychopathology section of the PANSS were related to employment status, although the effect was not large. Psychiatrists may not routinely treat symptoms such as anxiety, depression, social avoidance, poor impulse control and cognitive deficits very vigorously, or treatment response may be poor. The presence of these symptoms may be seriously disabling.
In any cross-sectional analysis such as this, interpretation must be tentative, given that causation cannot be assigned. Prospective data are needed to answer the question of causation, and will be available from this data-set.
Limitations
Our definition of employment was a broad one, and we were unable to identify accurately the group who were in open-market employment, strictly defined, as full details of how and with what support people had obtained work were not collected. We did, however, measure how many people were working and supporting themselves completely through their pay and how many were working as well as claiming benefits.
Because the study did not formally check the reliability of ratings, country-level comparisons of data from interviewer-rated instruments such as the PANSS require cautious interpretation. However, employment status is less likely to be subject to problems of reliability. Although efforts were made to ensure consistent and comparable procedures in all centres, the service structures were different, and recruitment bias cannot be excluded. It is unlikely, however, to explain a large amount of the variation in employment rates, given that the UK sample who had the least severe symptoms in comparison with other countries had a similarly low rate of employment to the French sample, who scored highly on symptom severity.
Ideally, a hierarchical form of analysis, such as multilevel modelling, should be used to explore the effects of country and local level variables on employment status at individual level. However, although our study had excellent power for investigation of individual-level explanatory variables, the three countries and eight centres were insufficient for such a multilevel analysis. Our data therefore did not allow a substantial exploration of the effects of national and regional level variables on employment among the mentally ill population. In addition, attribution of regional employment rates to individuals is a somewhat unsatisfactory method of exploring the relationship between local and individual characteristics. In future investigations, inclusion of a larger number of centres, detailed investigations of their characteristics and use of multilevel modelling techniques would be desirable.
Regression modelling using sets of variables that have substantial intercorrelations, as in this study, results in models that are relatively susceptible to change with small alterations in the variables included. This should be borne in mind, especially in relation to variables that are marginally significant in the final model. A further caveat is that we did not use the Bonferroni correction to adjust for multiple testing. Thus findings that are close to the P=0.05 level of significance should be treated with caution, although most of the significant associations we found in the final regression were at least at the P<0.001 level.
Data on job history, which is an important predictor of future employment, were not collected. We are not able to provide information on non-responders.
Acknowledgements
Our thanks to all the patients and staff who helped with the study and to the Camden and Islington Mental Health and Social Care NHS Trust and the Leicestershire Partnership NHS Trust Research and Development Programme.
The EuroSC Research Group comprises: I. Lindenbach and M. Swiridoff (Altenburg), F. Baehr, G. Lauer, T. Schwarz (Eppingen), V. Becker, J. Höffler, K. Siegrist and U. Trenckmann (Hemer), T. Brugha, J. Smith, D. Bagchi, S. McCormack, S. Wheatley (Leicester), M. Angermeyer, S. Bernert, H. Matschinger, C. Mory and Ch. Roick (Leipzig), M. Goudemand, D. Beaune and S. Dumont (Lille), P. Bebbington, D. Ellis, L. Isham, S. Johnson, J. Pearson, E. Perez and R. White (London), B. Lachaux, P. Pasi-Delay and S. Declerck (Lyon), J. M. Azorin, J. P. Chabannes, P. Chiaroni and I. Banovic (Marseille), M. Toumi, Å. Kornfeld, K. Hansen, C. Morin, L. Munier, J. C. Nachef, C. Nickel, C. Sapin and V. Willacy (Lundbeck A/S).




eLetters
No eLetters have been published for this article.