1. Introduction
In genome-wide association studies, thousands of common variants associated with human complex diseases have been successfully identified using statistical methods over the last 10 to 20 years. However, these common variants explain only a small portion of inheritable phenotypic variance for human diseases (Maher, Reference Maher2008; Manolio et al., Reference Manolio, Collins, Cox, Goldstein, Hindorff, Hunter, McCarthy, Ramos, Cardon, Chakravarti, Cho, Guttmacher, Kong, Kruglyak, Mardis, Rotimi, Slatkin, Valle, Whittemore, Boehnke, Clark, Eichler, Gibson, Haines, Mackay, McCarroll and Visscher2009; Eichler et al., Reference Eichler, Flint, Gibson, Kong, Leal, Moore and Nadeau2010). We expect that most missing heritability can be explained by low frequency variants. Up to now, it has been widely believed that human complex diseases are likely caused by both common and rare variants (Bodmer & Bonilla, Reference Bodmer and Bonilla2008; Ng et al., Reference Ng, Buckingham and Lee2010; Robinson et al., Reference Robinson, Wray and Visscher2014). At the same time, along with the rapid development of next-generation sequencing technologies (Metzker, Reference Metzker2010), more and more rare genetic variants have been detected in the human genome, where rare variants (RVs) are usually defined as having minor allele frequencies (MAFs) of less than 5%.
Although statistical methods have allowed for enormous steps in testing for associations between common variants and complex traits, these methods may lead to larger bias and lower power in detecting rare variants (Li & Leal, Reference Li and Leal2008). Owing to the convenience of using large data sets of rare variants, many statistical approaches have been proposed to be used when examining rare variants that may be associated with complex traits. Currently, the idea of collapsing a group of rare variants in a gene is widely used in association tests. For instance, Morgenthaler and Thilly (Reference Morgenthaler and Thilly2007) proposed the cohort allelic sums test (CAST); Pan (Reference Pan2009) developed the sum test (SUM); and Madsen and Browning (Reference Madsen and Browning2009) presented the method of weighted sum statistic (WSS). These collapsing methods are validated to be more powerful than single-marker methods. In addition, several methods of detecting associations of rare variants have been proposed by other groups, in which the direction and magnitude of the effects of causal variants are discussed, including adaptive methods (Zhang et al., Reference Zhang, Pei, Li, Papasian and Deng2010 a ; Fang et al., Reference Fang, Sha and Zhang2012), the sequence kernel association test (SKAT; Wu et al., Reference Wu, Lee, Cai, Li, Boehnke and Lin2011) and the sequence kernel association optimal test (SKAT-O; Lee et al., Reference Lee, Wu and Lin2012).
Almost all the existing methods focus on single binary or quantitative phenotype. However, ordinal responses are also very common in the investigations of complex traits, such as mental illnesses or behavioural disorders. Meanwhile, in these investigations multiple traits are often recorded as different types (e.g. binary, ordinal and quantitative). To date, researchers have already provided some methods to test for associations between multiple traits and common variants. For example, Lange et al. (Reference Lange, Silverman, Xu, Weiss and Laird2003) proposed the FBAT-GEE method; Zhang et al. (Reference Zhang, Liu and Wang2010 b ) proposed a nonparametric method based on generalized Kendall's τ, and Zhu et al. (Reference Zhu, Jiang and Zhang2012) presented covariate-adjusted association tests based on generalized Kendall's τ. Investigation results show that testing for multiple traits together is more powerful than testing for one single trait at a time in association studies (Zhu & Zhang, Reference Zhu and Zhang2009; Reference Zhu and Zhang2013). However, it is not entirely clear as to how beneficial simultaneous testing for multiple traits is in association studies of rare variants. One drawback to consider when using multiple traits to examine rare variants is that common-variant-based approaches could not be used directly.
To circumvent this difficulty and improve power compared to single-trait tests, in this article we provide a nonparametric method to test for associations between rare variants and multiple traits, which is based on generalized Kendall's τ (Zhang et al., Reference Zhang, Liu and Wang2010 b ). The traits involved in our method may be binary, ordinal, quantitative and/or any mixture of them. We expect that this approach can combine the weak signals from each variant, which should provide high resolution for detecting associations. With this in mind, we define a new kernel function based on multiple rare variants to measure the genotype dis-similarity of each pair of individuals in generalized Kendall's τ, which could incorporate the information of each rare variant itself. Furthermore, our proposed test statistic has an asymptotic Chi-square distribution. Extensive simulations are performed to compare the proposed method with other existing methods and the simulation results show that our method is effective, powerful and robust for rare variant association analysis. It can control Type I error, has higher power and, therefore, can increase the chance of detecting causal variants.
2. Methods
We consider data collected from n independent subjects. Let Y i = (Y i (1) , … Y i (q))′ denote the observed multiple traits, and Gi = (G i1, … , G im )′ denote the genotypic score vector at m loci for individual i (i = 1, … , n), where Y i (k) (k = 1, … , q) may be binary, ordinal or quantitative; G il = 0, 1 and 2 correspond to genotypes AA, Aa and aa (l = 1, … , m), and the frequency of minor allele a is less than 5%. Assume that the m rare variant loci are independent. We are concerned with the problem of testing for associations between rare variants and multiple traits. In the following, we propose our nonparametric association test method by constructing a U-statistic and further constructing a nonparametric statistic W to test for the associations. We call the proposed method NM-RV for brevity.
(i) U-statistic
Similar to the method of Zhang et al. (Reference Zhang, Liu and Wang2010 b ), which is based on generalized Kendall's τ, we propose a U-statistic
 $$U = {\left( {\matrix{ n \cr 2 \cr}} \right)^{ - 1}}\sum\limits_{i \lt j} {F({Y_i},{Y_j})K({G_i},{G_j})} $$
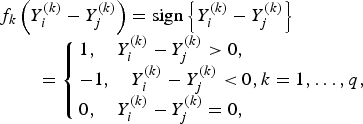
to measure the correlation between rare variants and multiple traits. For each pair (i, j), F(Y i , Yj ) and K(G i , G j ) are the kernel functions that measure the dis-similarities of the traits and of the genotypes between individuals i and j. Following the method of Zhang et al. (Reference Zhang, Liu and Wang2010 b ), let
 $$\eqalign{F_{ij} &= F\left(Y_i, Y_j\right)\cr & =\left(f_1\left(Y_i^{(1)}-Y_j^{(1)}\right), \ldots ,f_q\left(Y_i^{(q)}-Y_j^{(q)}\right)\right)^\prime,}$$
where function
![]() ${f_k}\left( \cdot \right) $
is defined as
${f_k}\left( \cdot \right) $
is defined as
if the kth trait is quantitative or binary, and
 $$\eqalign{& f_k\left( {Y_i^{\left( k \right)} - Y_j^{\left( k \right)}} \right) = {\rm sign}\left\{ {Y_i^{\left( k \right)} - Y_j^{\left( k \right)}} \right\}\cr & \quad \quad = \left\{ {\matrix{ {1, \quad Y_i^{\left( k \right)} - Y_j^{\left( k \right)} \gt 0,} \hfill \cr { - 1, \quad Y_i^{\left( k \right)} - Y_j^{\left( k \right)} \lt 0} ,k = 1, \ldots, q, \cr {0, \quad Y_i^{\left( k \right)} - Y_j^{\left( k \right)} = 0,} \hfill }} \right.}$$
if the kth trait is ordinal.
Next, we define the kernel function K(G i , G j ) such that it can be used to measure the dis-similarity of the genotypes for m rare variants between individuals iand j. For the purpose of simplicity, we assume that the kernel function K(G i , G j ) is a summation of K l (G il , G jl ) defined at each locus l (l = 1, …, m), that is,
 $$K\left( {{G_i},{G_j}} \right) = \mathop \sum \limits_{l = 1}^m {K_l}\left( {{G_{il}},{G_{\,jl}}} \right),$$
where K l (G il , G jl ) is the kernel function that represents the dis-similarity of genotypes at the lth rare variant for the pair (i, j). Because the effects of all m rare variants on the traits may not be identical in practice, we should define different kernel functions for different rare variants. Then, we need to define the kernel function K l (G il , G jl ) for each locus l discriminately. Unfortunately, the kernel function proposed by Zhang et al. (Reference Zhang, Liu and Wang2010 b ) is not applicable to rare variants owing to the following two shortcomings. First, their kernel function assumes the dis-similarity between genotypes AA and Aa is the same as the dis-similarity between genotypes Aa and aa at a single locus, which is obviously unreasonable when allele a is a rare mutation. Second, their kernel function does not take into account MAFs for different loci, which is essential for association studies of rare variants. In this work, a new kernel function is defined as
 $${K_l}\left( {{G_{il}},{G_{\,jl}}} \right) = {\rm log}\left( {\displaystyle{{{n_{{G_{il}}}}} \over {{n_{{G_{\,jl}}}}}}} \right),$$
where
![]() ${n_{{G_{il}}}}$
represents the total number of observed genotype G
il
for all individuals at variant l, and
${n_{{G_{il}}}}$
represents the total number of observed genotype G
il
for all individuals at variant l, and
![]() ${n_{{G_{jl}}}}$
has analogous explanation. This kernel function, motivated by the shrinkage of entropy-guided distance (EGS) of Jin et al. (Reference Jin, Zhu, Yu, Kou, Meng, Tao and Guo2014), does take MAFs into account and could incorporate the information of the rare variant itself. We expect that this kernel function possesses very similar advantages as the EGS of Jin et al. (Reference Jin, Zhu, Yu, Kou, Meng, Tao and Guo2014), although the EGS was proposed to measure the dis-similarity of haplotype pairs.
${n_{{G_{jl}}}}$
has analogous explanation. This kernel function, motivated by the shrinkage of entropy-guided distance (EGS) of Jin et al. (Reference Jin, Zhu, Yu, Kou, Meng, Tao and Guo2014), does take MAFs into account and could incorporate the information of the rare variant itself. We expect that this kernel function possesses very similar advantages as the EGS of Jin et al. (Reference Jin, Zhu, Yu, Kou, Meng, Tao and Guo2014), although the EGS was proposed to measure the dis-similarity of haplotype pairs.
Replacing the kernel function K(G i , G j ) in formula (1), the U-statistic is given by
 $$U = {\left( {\matrix{ n \cr 2 \cr}} \right)^{ - 1}}\mathop \sum \limits_{i \lt j} {F_{ij}}\mathop \sum \limits_{l = 1}^m {K_l}\left( {{G_{il}},{G_{\,jl}}} \right).$$
Moreover, the U-statistic can be simplified into the following form
 $$U = \mathop \sum \limits_{l = 1}^m {U_l},$$
where
 $${U_l} = \displaystyle{2 \over {n - 1}}\mathop \sum \limits_{i = 1}^n {\bar F_i}\log \left( {{n_{{G_{il}}}}} \right),$$
is a U-statistic defined for the lth variant, and
![]() ${\bar F_i} = \displaystyle{1 \over n}\mathop \sum \nolimits_{j = 1}^n {F_{ij}}$
(see Appendix 1 for more details). The main difference between our U
l
and the U-statistic given by Zhang et al. (Reference Zhang, Liu and Wang2010 b
) is that our U
l
is proposed for analysing rare variants using a new kernel function. Our proposed U-statistic is a simple summation of the U-statistics for all rare variants of interest, where the number of rare variants involved in our analysis could be very large.
${\bar F_i} = \displaystyle{1 \over n}\mathop \sum \nolimits_{j = 1}^n {F_{ij}}$
(see Appendix 1 for more details). The main difference between our U
l
and the U-statistic given by Zhang et al. (Reference Zhang, Liu and Wang2010 b
) is that our U
l
is proposed for analysing rare variants using a new kernel function. Our proposed U-statistic is a simple summation of the U-statistics for all rare variants of interest, where the number of rare variants involved in our analysis could be very large.
(ii) Association test statistic W and its asymptotic
According to generalized Kendall's τ (Zhang et al., Reference Zhang, Liu and Wang2010 b ) and based on the above proposed U-statistic, we define an association test statistic as
where
 $$E\left( {U{\vert} Y} \right) = \displaystyle{2 \over {n - 1}}\mathop \sum \limits_{i = 1}^n {\bar F_i}\mathop \sum \limits_{l = 1}^m E\left( {{\rm log}\left( {{n_{{G_{il}}}}} \right){\vert} Y} \right),$$
 $$Var\left( {U{\vert} Y} \right) = {\left( {\displaystyle{2 \over {n - 1}}} \right)^2}\mathop \sum \limits_{i = 1}^n {\bar F_i}\bar F_i^{\prime} \mathop \sum \limits_{l = 1}^m Var\left( {{\rm log}\left( {{n_{{G_{il}}}}} \right){\vert} Y} \right).$$
The detailed calculation of E(U|Y) and Var(U|Y) can be found in Appendix 2. Similar to the results of Zhang et al. (Reference Zhang, Liu and Wang2010 b ), it can be determined that under the null hypothesis of no association between rare variants and multiple traits, the statistic W follows an asymptotic Chi-square distribution, where the degrees of freedom are given by the rank of the variance matrix Var(U|Y).
3. Simulation studies
We conduct simulation studies to evaluate the performance of our proposed method (NM-RV). In the simulations, we compare the performance of the proposed method and five other competing tests: SUM, CAST, SKAT, SKAT-O and WSS. Two traits are considered in our comparisons.
(i) Simulation design
To comprehensively demonstrate the validity of NM-RV, we conduct two simulations: a simulation based on designed parameters and a simulation based on a real data set. In each simulation we consider the association analyses between multiple rare variants and two kinds of bivariate traits, respectively (i.e. two ordinal traits and a mixture of binary and ordinal traits).
(a) Simulation 1. Simulation based on designed parameters
In this simulation, m(= 20 and 40) rare variants and two ordinal traits, as well as a mixture of binary and ordinal traits are simulated. A total of 12 causal variants out of the 20 rare variants are assigned if m = 20, and 20 causal variants out of the 40 rare variants are assigned if m = 40. Sample size n = 500 is considered. Firstly, genotypes of m rare variant loci are generated independently with the MAF
![]() ${p_l} \sim U (0.001, 0.01 ), l = 1, \ldots ,m$
, where U(0·001, 0·01) denotes a uniform distribution in the interval (0·001, 0·01). Under the assumption of Hardy–Weinberg equilibrium law, the frequencies of genotypes AA, Aa and aa at locus l are
${p_l} \sim U (0.001, 0.01 ), l = 1, \ldots ,m$
, where U(0·001, 0·01) denotes a uniform distribution in the interval (0·001, 0·01). Under the assumption of Hardy–Weinberg equilibrium law, the frequencies of genotypes AA, Aa and aa at locus l are
![]() ${\left( {1 - {p_l}} \right)^2}, \; 2{p_l}\left( {1 - {p_l}} \right){\rm \; and\; }{p_l}^2 $
, respectively. Then the genotype of any individual i can be randomly generated according to the probability distribution. Based on the generated genotype (AA, Aa, aa), the corresponding genotypic score G
il
( = 0, 1, 2) can be recorded. Secondly, the trait value vector
${\left( {1 - {p_l}} \right)^2}, \; 2{p_l}\left( {1 - {p_l}} \right){\rm \; and\; }{p_l}^2 $
, respectively. Then the genotype of any individual i can be randomly generated according to the probability distribution. Based on the generated genotype (AA, Aa, aa), the corresponding genotypic score G
il
( = 0, 1, 2) can be recorded. Secondly, the trait value vector
![]() ${T_i} = {\left( {{T_i}^{\left( 1 \right)}, {T_i}^{\left( 2 \right)}} \right)^{\prime}}$
of two quantitative traits of individual i is generated according to the following model,
${T_i} = {\left( {{T_i}^{\left( 1 \right)}, {T_i}^{\left( 2 \right)}} \right)^{\prime}}$
of two quantitative traits of individual i is generated according to the following model,
where
![]() ${\left( {{\varepsilon _{i1}},{\varepsilon _{i2}}} \right)^{\prime}} \sim N\left( {0,{\bi \Sigma }} \right),\; \; {\rm and}\; {G_i} = {({G_{i1}}, \cdots ,{G_{im}})^{\prime}}$
is the genotypic score vector at m loci for individual i. We set
${\left( {{\varepsilon _{i1}},{\varepsilon _{i2}}} \right)^{\prime}} \sim N\left( {0,{\bi \Sigma }} \right),\; \; {\rm and}\; {G_i} = {({G_{i1}}, \cdots ,{G_{im}})^{\prime}}$
is the genotypic score vector at m loci for individual i. We set
![]() $\mu = 0,{\bi \Sigma } = \left( {\matrix{ 1 & {0 \cdot 25} \cr {0 \cdot 25} & 1 \cr } } \right)$
,
$\mu = 0,{\bi \Sigma } = \left( {\matrix{ 1 & {0 \cdot 25} \cr {0 \cdot 25} & 1 \cr } } \right)$
,
![]() ${\gamma_j} = {\beta_j} \cdot $
${\gamma_j} = {\beta_j} \cdot $
![]() $\left( {1,1,0,0,1,1,1,1,1,0,0,0,1,1,1,1,0,1,0,0} \right){^{\prime}}$
if m = 20,
$\left( {1,1,0,0,1,1,1,1,1,0,0,0,1,1,1,1,0,1,0,0} \right){^{\prime}}$
if m = 20,
![]() ${\gamma _j} = {\beta _j} \cdot(1,1,0,0,1,1,1,1,1,0,0,0,1,1,1,$
${\gamma _j} = {\beta _j} \cdot(1,1,0,0,1,1,1,1,1,0,0,0,1,1,1,$
![]() $1,0,1,0,0,1,0,1,0,1,1,1,0,0,0,0,0,0,{\rm \; }0,0,1,1,{\rm \; }0,{\rm \; }0,. 1)^{\prime}$
if m = 40, where the element 1 in
$1,0,1,0,0,1,0,1,0,1,1,1,0,0,0,0,0,0,{\rm \; }0,0,1,1,{\rm \; }0,{\rm \; }0,. 1)^{\prime}$
if m = 40, where the element 1 in
![]() ${\rm vector\; }{\gamma _j}$
represents that the corresponding locus is a causal variant. In the simulation, the values of β
1 are taken as 0, 0·2, 0·4, 0·6 and 0·8, and we take
${\rm vector\; }{\gamma _j}$
represents that the corresponding locus is a causal variant. In the simulation, the values of β
1 are taken as 0, 0·2, 0·4, 0·6 and 0·8, and we take
![]() ${\beta _2} = \displaystyle{1 \over 2}{\beta _1}$
correspondingly. It is noteworthy that the simulated data when (β
1, β
2) = (0, 0) are under the null hypothesis and are used to calculate Type I errors, whereas the simulated data when (β
1, β
2) ≠ (0, 0) are under the alternative hypothesis and are used to caulate powers for each method. Lastly, the ordinal (or mixed) trait value vector
${\beta _2} = \displaystyle{1 \over 2}{\beta _1}$
correspondingly. It is noteworthy that the simulated data when (β
1, β
2) = (0, 0) are under the null hypothesis and are used to calculate Type I errors, whereas the simulated data when (β
1, β
2) ≠ (0, 0) are under the alternative hypothesis and are used to caulate powers for each method. Lastly, the ordinal (or mixed) trait value vector
![]() ${Y_i} = {\left( {{Y_i}^{\left( 1 \right)}, {Y_i}^{\left( 2 \right)}} \right)^{{\prime}}}$
is generated by discretizing the values of
${Y_i} = {\left( {{Y_i}^{\left( 1 \right)}, {Y_i}^{\left( 2 \right)}} \right)^{{\prime}}}$
is generated by discretizing the values of
![]() ${T_i}^{\left( 1 \right)} $
and
${T_i}^{\left( 1 \right)} $
and
![]() ${T_i}^{\left( 2 \right)} $
separately. For simplicity, we set the numbers of categories of
${T_i}^{\left( 2 \right)} $
separately. For simplicity, we set the numbers of categories of
![]() ${Y_i}^{\left( 1 \right)} $
and
${Y_i}^{\left( 1 \right)} $
and
![]() ${Y_i}^{\left( 2 \right)} $
to be 3 and 4 for two ordinal traits, respectively. We use the 50 and 67% sample percentiles to discretize
${Y_i}^{\left( 2 \right)} $
to be 3 and 4 for two ordinal traits, respectively. We use the 50 and 67% sample percentiles to discretize
![]() ${T_i}^{\left( 1 \right)} $
and generate
${T_i}^{\left( 1 \right)} $
and generate
![]() ${Y_i}^{\left( 1 \right)} $
, and use the 33, 54 and 75% sample percentiles to discretize
${Y_i}^{\left( 1 \right)} $
, and use the 33, 54 and 75% sample percentiles to discretize
![]() ${\rm \;} {T_i}^{\left( 2 \right)} $
and
${\rm \;} {T_i}^{\left( 2 \right)} $
and
![]() ${\rm \; generate\;} {Y_i}^{\left( 2 \right)} $
. To generate the trait value vector
${\rm \; generate\;} {Y_i}^{\left( 2 \right)} $
. To generate the trait value vector
![]() ${Y_i} = {\left( {{Y_i}^{\left( 1 \right)}, {Y_i}^{\left( 2 \right)}} \right)^{{\prime}}}$
of the mixture of binary and ordinal traits, where
${Y_i} = {\left( {{Y_i}^{\left( 1 \right)}, {Y_i}^{\left( 2 \right)}} \right)^{{\prime}}}$
of the mixture of binary and ordinal traits, where
![]() ${Y_i}^{\left( 1 \right)} \; \left( { = 0,\; 1} \right)$
denotes the binary trait value and
${Y_i}^{\left( 1 \right)} \; \left( { = 0,\; 1} \right)$
denotes the binary trait value and
![]() ${Y_i}^{\left( 2 \right)} $
( = 1, 2, 3, 4) denotes the ordinal trait value, we use the 40% sample percentile to discretize
${Y_i}^{\left( 2 \right)} $
( = 1, 2, 3, 4) denotes the ordinal trait value, we use the 40% sample percentile to discretize
![]() ${T_i}^{\left( 1 \right)} $
and generate
${T_i}^{\left( 1 \right)} $
and generate
![]() ${Y_i}^{\left( 1 \right)} $
, and still use the 33, 54 and 75% sample percentiles to discretize
${Y_i}^{\left( 1 \right)} $
, and still use the 33, 54 and 75% sample percentiles to discretize
![]() ${\rm \;} {T_i}^{\left( 2 \right)} $
and generate
${\rm \;} {T_i}^{\left( 2 \right)} $
and generate
![]() ${\rm \; \;} {Y_i}^{\left( 2 \right)} $
. Thus the simulated data including m rare variants and two ordinal traits, as well as the mixture of binary and ordinal traits are obtained.
${\rm \; \;} {Y_i}^{\left( 2 \right)} $
. Thus the simulated data including m rare variants and two ordinal traits, as well as the mixture of binary and ordinal traits are obtained.
(b) Simulation 2. Simulation based on a real data set
To better show the performance of the proposed method, we apply the proposed NM-RV and the other five methods to real genotype data from GAW17, which are extracted from the sequence alignment files provided by the 1000 Genomes Project for their pilot3 study (http://www.1000genomes.org).
We chose the real genotype data of 697 unrelated individuals from GAW17, and chose the TG and COL6A3 genes as candidate genes. The TG gene encodes thyroglobulin, and mutation of the TG gene may cause hypothyroidism and autoimmune disorders (Maierhaba et al., Reference Maierhaba, Zhang, Yu, Wang, Xiao, Quan and Dong2008); while the COL6A3 gene encodes one component of collagen VI, and mutation of this gene will cause the occurrence of collagen disease and myopathy dystrophy (Baker et al., Reference Baker, Mörgelin, Peat, Goemans, North, Bateman and Lamandé2005). The TG gene has 146 SNPs and 113 out of the 146 SNPs are rare (MAF <5%), while the COL6A3 gene has 187 SNPs and 143 out of the 187 SNPs are rare. For each of these two genes, we randomly chose the genotype data of 20 and 40 rare variants of the 697 individuals, and we assumed that all the causal variants in the selected rare variants had the same direction of effects. To perform simulation studies based on the real genotype data set, the values of traits (two ordinal traits or a mixture of binary and ordinal traits) of each individual were simulated in the same way as in Simulation 1.
For each of the two above simulations, the nominal significance levels 0·01 and 0·05 were used. The six methods (NM-RV, SUM, CAST, SKAT, SKAT-O and WSS) were used to analyse the simulated data. For Type I error evaluation and power comparisons, the simulation results were obtained from 1000 replications for all six methods. When using the other five competing methods to analyse the bivariate traits, we first tested for each trait separately, then applied Bonferroni correction to adjust for corresponding multiple testing. It should be pointed out that the significance level of each single-trait test was set to 0·01/2 and 0·05/2 based on Bonferroni adjustment for the other five competing tests, and each single-trait test was counted on its own, giving rise to 2000 tests under the null hypothesis.
(ii) Simulation results
(a) Evaluation of Type I errors
The simulated data were generated under the null hypothesis, that is, there exists no association between the rare variants and the bivariate traits when calculating Type I errors. The results of the estimated Type I errors for the two simulations are listed in Tables 1–6.
Table 1. Estimated Type I errors of the six methods for a mixture of binary and ordinal traits in simulation 1.
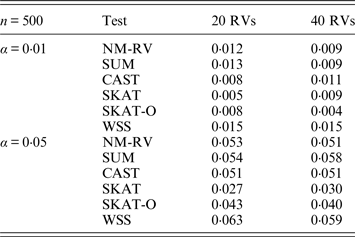
Table 2. Estimated Type I errors of the six methods for two ordinal traits in simulation 1.
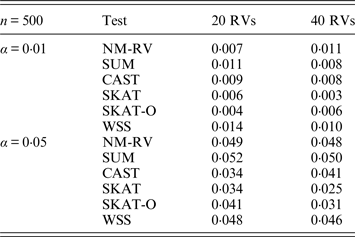
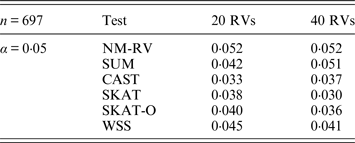
Table 3. Estimated Type I errors of the six methods in the association studies of the TG gene and a mixture of binary and ordinal traits at α = 0·05 in simulation 2.
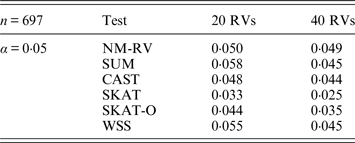
Table 4. Estimated Type I errors of the six methods in the association studies of the TG gene and two ordinal traits at α = 0·05 in simulation 2.
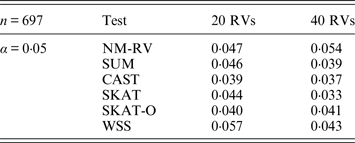
Table 5. Estimated Type I errors of the six methods in the association studies of the COL6A3 gene and a mixture of binary and ordinal traits at α = 0·05 in simulation 2.
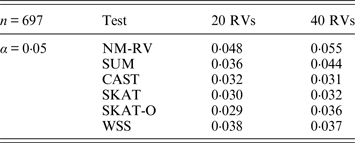
Table 6. Estimated Type I errors of the six methods in the association studies of the COL6A3 gene and two ordinal traits at α = 0·05 in simulation 2.
Tables 1 and 2 show the estimated Type I errors of the six methods at different nominal significance levels when analysing the two kinds of bivariate traits in Simulation 1. The traits considered in Table 1 are the mixture of binary and ordinal ones. The upper part of Table 1 lists the estimated results at the nominal significance level of 0·01, and the lower part corresponds to the nominal significance level of 0·05. From Table 1 we can see that each estimated Type I error was very close to the corresponding nominal significance level. The Type I errors can be well controlled by our proposed method (NM-RV) at different nominal significance levels for each of the two settings of rare variants. The other five methods can also control the estimated Type I errors. By comparison, the estimated Type I errors of the SKAT and the SKAT-O seem a little lower than those of the other methods, that is to say the two test methods are somewhat conservative. Table 2 lists the estimated Type I errors of the six methods when both of the two traits are ordinal, and it is not hard to see that the characteristics of the results are similar to those exhibited in the association analyses of the mixture of binary and ordinal traits.
Tables 3 and 4 present the estimated Type I errors of the six methods for the TG gene when the significance levelα is equal to 0·05 in Simulation 2, and the estimated Type I errors of various methods for the COL6A3 gene in Simulation 2 are listed in Tables 5 and 6. It can be seen that similar conclusions can be drawn, while this time CAST seems a little conservative alongside SKAT and SKAT-O. In addition, from Tables 1–6 we can see that the number of rare variants has little impact on Type I errors for each method, as does the proportion of causal variants.
(b) Power comparison
In order to better show the advantages of NM-RV in the association analysis between the rare variants and the multiple traits, we generated data under the alternative hypothesis and calculated test powers of each method under each setting. The simulation results of power comparisons for the six methods are listed in Tables 7–12.
Table 7. Power comparisons of the six methods for a mixture of binary and ordinal traits in simulation 1.
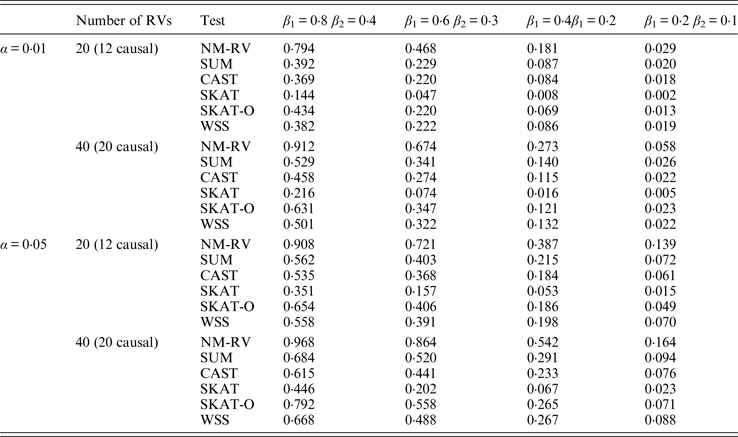
Table 8. Power comparisons of the six methods for two ordinal traits in simulation 1.
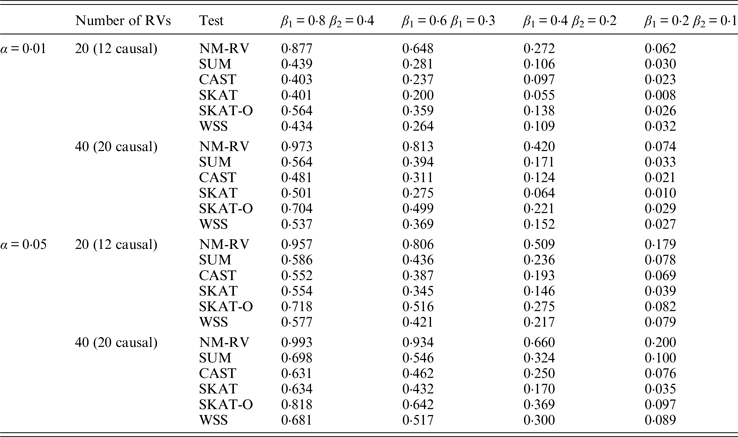
Table 9. Power comparisons of the six methods in the association studies of the TG gene and a mixture of binary and ordinal traits at α = 0·05 in simulation 2.

Table 10. Power comparisons of the six methods in the association studies of the TG gene and two ordinal traits at α = 0·05 in simulation 2.

Table 11. Power comparisons of the six methods in the association studies of the COL6A3 gene and a mixture of binary and ordinal traits at α = 0·05 in simulation 2.
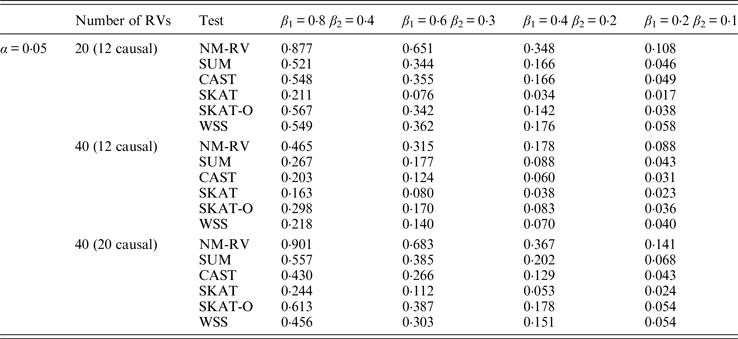
Table 12. Power comparisons of the six methods in the association studies of the COL6A3 gene and two ordinal traits at α = 0·05 in simulation 2.
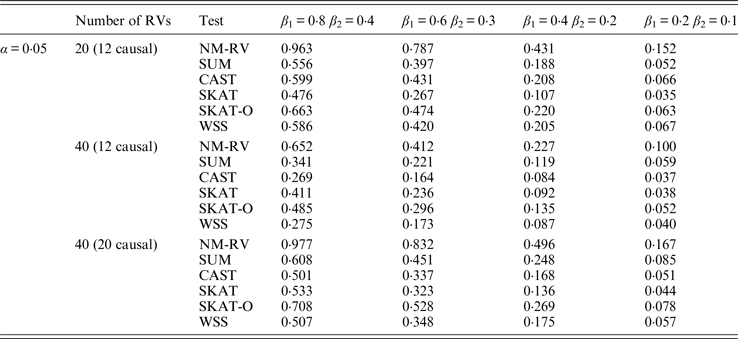
Tables 7 and 8 present the power comparison results of the six methods for a mixture of binary and ordinal traits, and two ordinal traits in simulation 1. From the two tables we can draw several conclusions. The power of NM-RV is higher than that of the other methods in any situation. With an increase in the number of rare variants or the number of true causal variants, the power of NM-RV becomes much higher. When the number of rare variants m = 40 is considered, although the proportion of causal variants is less than that of m = 20, the power attains the greatest value (0·993) when (β 1, β 2) =(0·8, 0·4) at α = 0·05 (Table 8). Besides, a common tendency of the six methods is that the power increases with an increase in the values of β 1 and β 2. Because large β 1 and β 2 values correspond to high heritability, the simulated results confirm that heritability is an important factor that has significant impact on the test powers. By comparing the details of the simulation results in Tables 7 and 8, we found that in each case with the same parameters, the power of the proposed NM-RV is higher when the two traits are ordinal than when the traits are mixed.
Tables 9 and 10 list the simulation results of power comparisons for the TG gene when considering associations with two bivariate traits in simulation 2. We also consider two situations: 12 out of the 20 rare variants are causal variants and 20 out of the 40 rare variants are causal. Significance level is taken as 0·05. At this time, we yield the same conclusions as the aforementioned analysis, that is, NM-RV has the highest power in any simulation situation; the larger the number of rare variants or the number of the true causal variants is, the higher the power will be for each method, but the power of NM-RV is still the highest; and the proposed NM-RV is more powerful in the association analysis between rare variants and two ordinal traits.
In the power comparisons for the COL6A3 gene in simulation 2, we consider three situations: 12 out of the 20 rare variants are causal variants, 12 out of the 40 rare variants are causal, and 20 out of the 40 rare variants are causal. From Tables 11 and 12 it is not hard to see the same conclusion; that the power of NM-RV is still the highest out of all of the six methods. Besides, as expected, the power in the situation of 20 causal variants is higher than in the situation of 12 causal variants when the number of rare variants m = 40 is considered; the power in the situation of 20 rare variants is higher than in the situation of 40 rare variants when the number of causal variants is 12, that is to say the proportion of causal variants is an important factor that affects power.
All in all, through comparing Type I errors and powers of the six methods, we validate that our proposed NM-RV is effective, powerful and robust; it does not matter if the genotype data m = 40 are randomly generated or are based on real data. When the multivariate traits are all ordinal, the advantages of the proposed method are more obvious. In fact, the main reason is that the proposed method sufficiently mines the joint information of multiple traits (even if partially or approximately true information), which helps to enhance the power of identifying associations between rare variants and multiple traits.
4. Discussion
With the innovation and development of biotechnology, it is now possible to obtain a huge amount of genetic data, among which is a massive amount of rare variant data, which impels us to find new statistical methods to be used in genetic association studies. Since comorbidity is common in mental illness and behaviour disorders, researchers are beginning to study the associations between multiple traits and genetic loci. Zhang et al. (Reference Zhang, Liu and Wang2010 b ) proposed a method to test for associations between multiple traits and marker loci based on generalized Kendall's τ. Referring to the method of Zhang et al. (Reference Zhang, Liu and Wang2010 b ), we proposed a nonparametric approach to test for associations between rare variants and multivariate phenotypes. The reason that we adopted a nonparametric statistical method was to avoid problems caused by parameter models, such as overfitting and strong collinearity. The more parameters used in the model, the more stable the model will be; however, it will bring difficulties to parameter estimation and lead to greater calculation burden. In the simulation studies, we used both simulated genotype data and real genotype data from GAW17, among which we analysed the TG and COL6A3 genes. The simulation results suggested that our proposed method outperforms the existing methods when multiple traits are analysed jointly, especially for ordinal traits.
In our method, we first defined a new kernel function to measure the difference of multiple rare variants between individual pairs. Then we constructed a U-statistic. By calculating the conditional expectation and variance of the U-statistic under the condition of traits, we finally proposed an association test statistic W, which has an asymptotic Chi-square distribution. Therefore we can easily calculate p-values in the simulations based on the asymptotic distribution, one advantage of which is the saving of time.
Meanwhile, our method can be easily extended to analyse family-based data, as well as to consider cases with covariates such as gender, age and environmental factors. In this article, we assume that all rare variant loci that we considered are independent and each locus has equal weight in the kernel function K(G
i
, G
j
). In fact, we can also consider how to add a suitable weight ω
l
to the kernel function K(G
i
, G
j
) to better discriminate each locus, so that the improved association test statistic W based on the new kernel function
![]() $K\left( {{G_i},{G_j}} \right) = \mathop \sum \nolimits_{l = 1}^m \; {\omega _l}\; {K_l}\left( {{G_{il}},{G_{jl}}} \right)$
may gain higher power in the association test between rare variants and multiple traits. The weighted idea in Madsen & Browning (Reference Madsen and Browning2009) may be a better reference for us to use when defining the weight ω
l
. Of course, how to choose an optimal weight ω
l
is one of the issues we will continue to consider.
$K\left( {{G_i},{G_j}} \right) = \mathop \sum \nolimits_{l = 1}^m \; {\omega _l}\; {K_l}\left( {{G_{il}},{G_{jl}}} \right)$
may gain higher power in the association test between rare variants and multiple traits. The weighted idea in Madsen & Browning (Reference Madsen and Browning2009) may be a better reference for us to use when defining the weight ω
l
. Of course, how to choose an optimal weight ω
l
is one of the issues we will continue to consider.
Although the simulation results indicated that our method is better than other existing methods when analysing multiple traits, the proposed method still has some shortcomings. A limitation of our proposed test is that it may lose power when all rare variants influence traits in different directions. Besides, in this article we did not consider the problem of population stratification and the interactions among genes. We will carry out further investigations and develop new methods to deal with these issues in future work.
Appendix 1
The simplification of the proposed U-statistic
According to the definition of the proposed U-statistic, and further replacing the expression of the kernel function K l (G il , G jl ) in the statistic, we have
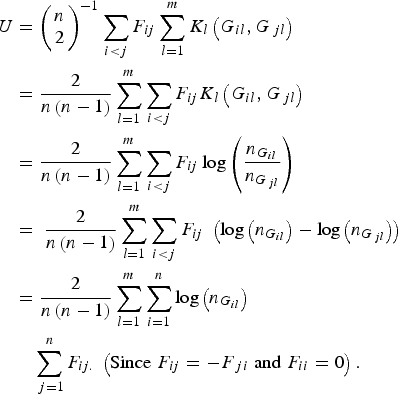 $$\eqalign{U & = {\left( {\matrix{ n \cr 2 \cr } } \right)^{ - 1}}\mathop \sum \limits_{i \lt j} {F_{ij}}\mathop \sum \limits_{l = 1}^m {K_l}\left( {{G_{il}},{G_{\,jl}}} \right) \cr&= \displaystyle{2 \over {n\left( {n - 1} \right)}}\mathop \sum \limits_{l = 1}^m \mathop \sum \limits_{i \lt j} {F_{ij}}{K_l}\left( {{G_{il}},{G_{\,jl}}} \right) \cr & = \displaystyle{2 \over {n\left( {n - 1} \right)}}\mathop \sum \limits_{l = 1}^m \mathop \sum \limits_{i \lt j} {F_{ij}}\log \left( {\displaystyle{{{n_{{G_{il}}}}} \over {{n_{{G_{\,jl}}}}}}} \right)\; \cr&= \; \displaystyle{2 \over {n\left( {n - 1} \right)}}\mathop \sum \limits_{l = 1}^m \mathop \sum \limits_{i \lt j} {F_{ij}}\; \left( {{\rm log}\left( {{n_{{G_{il}}}}} \right) - {\rm log}\left( {{n_{{G_{\,jl}}}}} \right)} \right) \cr & = \displaystyle{2 \over {n\left( {n - 1} \right)}}\mathop \sum \limits_{l = 1}^m \mathop \sum \limits_{i = 1}^n {\rm log}\left( {{n_{{G_{il}}}}} \right)\cr&\quad\mathop \sum \limits_{\,j = 1}^n {F_{ij.}}\; \left( {{\rm Since}\; {F_{ij}} = - {F_{\,ji}}\; {\rm and}\; {F_{ii}} = 0} \right).} $$
Let
 ${\overline {F} _i} = \displaystyle{1 \over n}\mathop \sum \limits_{j = 1}^n {F_{ij}}$
, then
 $$U = \displaystyle{2 \over {\left( {n - 1} \right)}}\mathop \sum \limits_{l = 1}^m \mathop \sum \limits_{i = 1}^n {\bar F_i}{\rm log}\left( {{n_{{G_{il}}}}} \right).$$
Further let
 $${U_l} = \displaystyle{2 \over {n - 1}}\mathop \sum \limits_{i = 1}^n {\bar F_i}\log \left( {{n_{{G_{il}}}}} \right),$$
so, the U-statistic can be expressed as
 $$U = \mathop \sum \limits_{l = 1}^m {U_l}. $$
Appendix 2
The calculating process of E(U|Y) and Var(U|Y) under the null hypothesis
Because the rare variant loci are independent, it is easy to obtain
 $$E\left( {U{\vert} Y} \right) = \displaystyle{2 \over {n - 1}}\mathop \sum \limits_{i = 1}^n {\bar F_i}\mathop \sum \limits_{l = 1}^m E\left( {{\rm log}\left( {{n_{{G_{il}}}}} \right){\vert} Y} \right),$$
 $$Var\left( {U{\vert} Y} \right) = {\left( {\displaystyle{2 \over {n - 1}}} \right)^2}\mathop \sum \limits_{i = 1}^n {\bar F_i}\bar F_i^{\prime} \mathop \sum \limits_{l = 1}^m Var\left( {{\rm log}\left( {{n_{{G_{il}}}}} \right){\vert} Y} \right).$$
So we only need to calculate
![]() $E\left( {\log \left( {{n_{{G_{il}}}}} \right){\vert}Y} \right)$
and
$E\left( {\log \left( {{n_{{G_{il}}}}} \right){\vert}Y} \right)$
and
![]() $Var\left( {{\rm log}\left( {{n_{{G_{il}}}}} \right){\vert}Y} \right).$
Under the null hypothesis and the assumption of Hardy–Weinberg equilibrium law for each locus, we have
$Var\left( {{\rm log}\left( {{n_{{G_{il}}}}} \right){\vert}Y} \right).$
Under the null hypothesis and the assumption of Hardy–Weinberg equilibrium law for each locus, we have
 $$\eqalign{{\rm \; \; } & ={\left( {1 - {\,p_l}} \right)^2}\log {n_0} + 2{\,p_l}\left( {1 - {\,p_l}} \right){\rm log}{n_1}\, + \,{\rm \; }{\,p_l}^2 {\rm log}{n_2} \cr & = {\rm log}n + 2{\left( {1 - {\,p_l}} \right)^2}\log \left( {1 - {\,p_l}} \right), \cr & + 2{\,p_l}\left( {1 - {\,p_l}} \right)\log \left[ {2{\,p_l}\left( {1 - {\,p_l}} \right)} \right] + 2{\,p_l}^2 \log {\,p_l}} $$
where
![]() ${n_{{G_{il}}}}$
represents the total number of observed genotype G
il
( = 0, 1, 2) for all individuals at variant l. Similarly,
${n_{{G_{il}}}}$
represents the total number of observed genotype G
il
( = 0, 1, 2) for all individuals at variant l. Similarly,
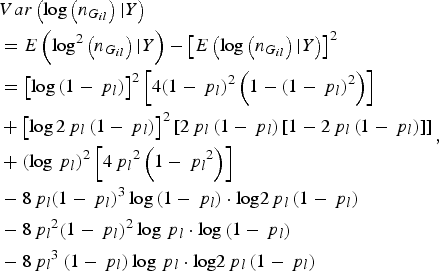 $$\eqalign{&Var\left( {\log \left( {{n_{{G_{il}}}}} \right){\vert}Y} \right) \cr&= E\left( {{\rm lo}{{\rm g}^2}\left( {{n_{{G_{il}}}}} \right){\vert}Y} \right) - {\left[ {E\left( {\log \left( {{n_{{G_{il}}}}} \right){\vert}Y} \right)} \right]^2} \cr &= {\left[ {\log \left( {1 - {\,p_l}} \right)} \right]^2}\left[ {4{{\left( {1 - {\,p_l}} \right)}^2}\left( {1 - {{\left( {1 - {\,p_l}} \right)}^2}} \right)} \right] \cr & + {\left[ {\log 2{\,p_l}\left( {1 - {\,p_l}} \right)} \right]^2}\left[ {2{\,p_l}\left( {1 - {\,p_l}} \right)\left[ {1 - 2{\,p_l}\left( {1 - {\,p_l}} \right)} \right]} \right] \cr & + {\left( {\log {\,p_l}} \right)^2}\left[ {4{\,p_l}^2 \left( {1 - {\,p_l}^2 } \right)} \right] \cr & - 8{\,p_l}{\left( {1 - {\,p_l}} \right)^3}\log \left( {1 - {\,p_l}} \right)\cdot {\rm log}2{\,p_l}\left( {1 - {\,p_l}} \right) \cr & - 8{\,p_l}^2 {\left( {1 - {\,p_l}} \right)^2}\log {\,p_l}\cdot {\rm log}\left( {1 - {\,p_l}} \right) \cr & - 8{\,p_l}^3 \left( {1 - {\,p_l}} \right)\log {\,p_l}\cdot {\rm log}2{\,p_l}\left( {1 - {\,p_l}} \right)}, $$
where p l is the MAF of the lth rare variant.
The authors are indebted to the editor and the referees for their constructive comments and suggestions, which made the improvement of the original manuscript of this article possible. This research was supported by the National Natural Science Foundation of China (nos. 11371083, 11001044 and 11201129), the Natural Science Foundation of Jilin Province (no. 201215007), the Fundamental Research Funds for the Central Universities (no. 11CXPY007), China Scholarship Council (201406625026), Program for Changjiang Scholars and Innovative Research Team in University, the Natural Science Foundation of Heilongjiang Province (A201207), the Scientific Research Foundation of Department of Education of Heilongjiang Province (no. 1253G044) and the Science and Technology Innovation Team in Higher Education Institutions of Heilongjiang Province (no. 2014TD005).
Declaration of interest
None.


