There is a consensus that the detrimental alteration of glucose homeostasis, leading to the metabolic syndrome and type 2 diabetes, occurs due to a combination of genetic and environmental factors. Nutrition is a strong environmental factor, given that both an excess and a lack( Reference DeFronzo 1 ) of nutrients are predisposing factors for the development of type 2 diabetes.
The development of the endocrine pancreas occurs during intra-uterine growth and also in the early postnatal stages( Reference Remacle, Dumortier and Bol 2 ). Studies have shown decreased vascularisation and increased apoptosis to occur in the pancreatic islets of fetuses exposed to gestational protein restriction( Reference Snoeck, Remacle and Reusens 3 ). Therefore, protein restriction can permanently impair the development and function of the pancreatic islets.
Hales & Barker( Reference Hales and Barker 4 ) proposed the so-called thrifty phenotype to describe a situation in which an early-life exposure to a nutrient-restricted environment would lead to permanent, or at least long-lasting, changes in glucose homeostasis to cope with the challenge of maintaining an adequate supply of nutrients to peripheral tissues, without compromising blood glycaemia and body composition( Reference Hales 5 ). These changes would preserve nutrients and energy, maximising these resources in an ‘economical’ layout.
Dietary protein restriction after lactation is useful for understanding metabolic adaptations that might occur in adult life( Reference Batista, Ribeiro and da Silva 6 – Reference Camargo, Batista and Ribeiro 8 ). Although our animal model was not exposed to gestational or lactational malnutrition, protein malnourishment after weaning was able to induce physiological adaptations that could have an impact on glucose homeostasis in adult life.
Over the years, accumulated evidence has provided a solid background for the thrifty phenotype hypothesis and also that this phenotype includes changes in insulin secretion and sensitivity( Reference Rafacho, Giozzet and Boschero 9 – Reference Reis, Carneiro and Mello 12 ). The downside is that once exposed to a regular diet, these individuals or animals still consume more and expend fewer nutrients and less energy, thereby increasing the predisposition to develop obesity and type 2 diabetes( Reference Hales 5 , Reference Masiello 13 – Reference Law 16 ).
In a review of the initial hypothesis, Hales & Barker( Reference Hales and Barker 17 ) wisely conceived of other possible changes in liver physiology that could help explain the thrifty phenotype. It is now well known that the plasma insulin concentration, or insulinaemia, is not solely dependent on the amount of insulin secreted by the pancreatic islets but also dependent, at least to the same extent, on the rate by which insulin is removed from the plasma, known as insulin clearance( Reference Hwang, Seo and Kim 18 – Reference Mittelman, Van Citters and Kim 23 ).
Approximately 50 % of the secreted insulin is removed from the plasma after its second passage through the liver, the organ that is involved in 70–80 % of insulin clearance( Reference Duckworth, Bennett and Hamel 24 – Reference Butterfield 26 ). Insulin clearance itself is mainly controlled by insulin-degrading enzyme (IDE) expression and activity in the peripheral tissues and especially, as expected, in the liver( Reference Duckworth, Bennett and Hamel 24 , Reference Authier, Posner and Bergeron 27 ).
In the present study, we aimed to determine whether a low-protein diet after weaning could contribute to the thrifty phenotype, including changes in insulin clearance and IDE expression mainly in the liver and also in the skeletal muscle and white adipose tissue (WAT).
Materials and methods
Animals and experimental design
In the present study, 30-d-old weaned C57BL/6 mice were randomly distributed into two experimental groups in a 22°C, humidity-controlled, 12 h light–12 h dark cycle environment with free access to food and water in individual cages. A normal-protein diet (NP) was fed to one group and a low-protein diet (LP) to the other group for 14 weeks, after which the animals were subjected to experimental procedures. All the experiments were approved by the Ethics Committee of the State University of Campinas, and every effort was made to minimise animal suffering. The composition of the diets is given in Table 1, and it was the same as that described previously( Reference Batista, Ribeiro and da Silva 6 ).
Table 1 Composition of the diets used in the study
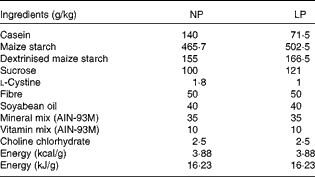
NP, normal-protein diet; LP, low-protein diet.
Western blot analysis
Protein expression and phosphorylation were evaluated using Western blot analysis as described previously( Reference Santos, Oliveira and Boschero 28 ).
Collection of tissue samples
Liver, gastrocnemius muscle and WAT samples were isolated from 14 h fasting mice and were then snap-frozen in liquid N2 and stored for subsequent protein extractions. Pancreatic islet samples were isolated from the mice by the collagenase method, as described previously( Reference Rezende, Vieira and Negro 29 ).
Evaluation of pancreatic islet glucose-stimulated insulin secretion
Batches of ten islets were pre-incubated for 1 h in Krebs–Henseleit buffer solution (KHBS) containing 0·5 g/l bovine serum albumin and 5·6 mm-glucose and equilibrated at 95 % O2 and 5 % CO2 at 37°C. The medium was discarded, and the islets were incubated for an additional 1 h in 1 ml of KHBS containing 2·8 or 16·7 mm-glucose. Subsequently, the supernatant fraction was collected to evaluate insulin secretion, and the remaining islets were homogenised in an alcohol/acid solution to measure the total insulin content. Both insulin secretion and total content were evaluated using RIA, as described previously( Reference Rezende, Stoppiglia and Souza 30 ).
Intraperitoneal glucose tolerance test
The mice were intraperitoneally injected with glucose (1 g/kg in 0·9 % NaCl) after 14 h of fasting. Blood samples (75–100 μl) were collected from the tail immediately before and 15, 30, 45 and 120 min after injection to determine glucose and insulin concentrations. Glucose concentrations were determined using a glucose strip on an Accu-Chek Performa II instrument (Roche).
Intraperitoneal insulin tolerance test
The non-fasting mice were intraperitoneally injected with insulin (1 U/kg). Blood glucose concentrations were measured using test strips (Accu-Chek Performa II; Roche) at baseline (0 min, before insulin administration) and 5, 10, 15, 20 and 30 min after insulin administration. Glucose measurements were then converted to the natural logarithm (Ln). The slope was calculated using linear regression (time × Ln(glucose)) and was multiplied by 100 to obtain the glucose decay constant rate during the insulin tolerance test (k ITT) per min (%/min). Insulin concentrations were measured using RIA, as described previously( Reference Rezende, Stoppiglia and Souza 30 ).
Evaluation of in vivo insulin clearance
The plasma insulin concentrations of C57BL/6 mice submitted to the intraperitoneal ITT were determined. Insulin clearance was evaluated as described previously( Reference Ahrén, Thomaseth and Pacini 20 ). The constant rate of insulin disappearance (insulin decay) was calculated by first converting insulin measurements to the Ln; the slope was calculated using linear regression (time × Ln(insulin)) and was multiplied by 100 to obtain the insulin decay constant rate per min (%/min). Insulin concentrations were measured using RIA, as described previously( Reference Rezende, Stoppiglia and Souza 30 ).
Statistical analyses
Point-to-point comparisons were made using Student's t test. The groups were also compared using Student's t test. The results were considered significantly different if P <0·05. Sample size was determined taking into account the size effect. Bilateral statistic with a significance level of 5 % and potency of 0·98 was used to rule out type II errors. Under these conditions, the highest sample size required would be n 5 for the k ITT experiment; thus, we opted for a size of n 6 as a safety measure.
Results
Food intake and metabolic variables
Although the LP mice exhibited slightly increased food intake, these mice were isoenergetic at the end of the experiments compared with the NP mice. Additionally, the NP and LP mice had the same weight before the dietary intervention, but the LP mice had a lower weight compared with the NP mice after the 14-week dietary intervention. The lower weight gain was accompanied by lower plasma insulin concentrations and lower glycaemia under both fasting and non-fasting conditions, as shown in Table 2. To further understand how hyperglycaemia was prevented in the LP mice despite reduced insulinaemia, we first assessed the glucose tolerance of these mice.
Table 2 Food intake and metabolic variables of mice fed the normal-protein diet (NP) or the low-protein diet (LP) (Mean values with their standard errors, n 6 per group)
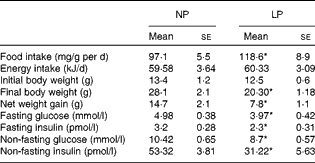
* Mean value was significantly different from that of the NP mice (P< 0·05).
Glucose tolerance and insulin dynamics
The LP mice were more glucose tolerant, as revealed by a glucose tolerance test (GTT) (Fig. 1(a)) and reflected by a lower AUC of glucose during the GTT (Fig. 1(b)). This phenomenon might occur mainly because of changes in the capacity of insulin to increase glucose uptake by the peripheral tissues (insulin sensitivity) and the plasma insulin concentrations during a GTT (insulin dynamics). The LP mice exhibited a remarkable change in insulin dynamics. First, there was a lower plasma insulin peak at 15 min, followed by a slower reduction of insulin concentrations. At 30 min, the insulin concentrations of the LP mice equalised those of the NP mice and remained comparable for at least 60 min after glucose administration (Fig. 1(c)). This equalisation was not enough to normalise the AUC of insulin during a GTT, which was lower in the LP mice (Fig. 1(d)).
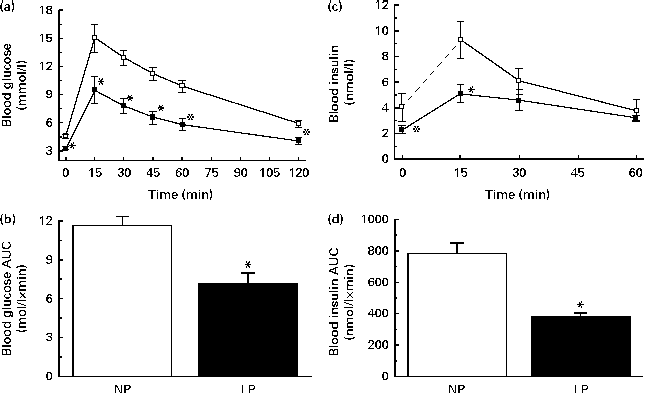
Fig. 1 (a) Glucose tolerance, (b) AUC of blood glucose during a glucose tolerance test (GTT), (c) blood insulin and (d) AUC of blood insulin during a GTT of 14 h fasting normal-protein diet (NP, ![]() ) and low-protein diet (LP,
) and low-protein diet (LP, ![]() ) mice 0, 15, 30 and 60 min after glucose administration. Values are means (n 6 per group), with their standard errors represented by vertical bars. * Mean value was significantly different from that of NP mice (P< 0·05).
) mice 0, 15, 30 and 60 min after glucose administration. Values are means (n 6 per group), with their standard errors represented by vertical bars. * Mean value was significantly different from that of NP mice (P< 0·05).
Insulin sensitivity
The LP mice were more insulin sensitive, as revealed by the lower blood glucose values observed during an ITT (Fig. 2(a)) and increased k ITT (Fig. 2(b)). This condition resulted in a lower exposure of the peripheral tissues to glucose during the ITT, as revealed by the lower AUC of glucose (Fig. 2(c)).

Fig. 2 (a) Insulin sensitivity, (b) glucose decay constant rate during the insulin tolerance test (k
ITT) and (c) AUC of blood glucose during an ITT of non-fasting normal-protein diet (NP, ![]() ) and low-protein diet (LP,
) and low-protein diet (LP, ![]() ) mice. Values are means (n 6 per group), with their standard errors represented by vertical bars. * Mean value was significantly different from that of the NP mice (P< 0·05).
) mice. Values are means (n 6 per group), with their standard errors represented by vertical bars. * Mean value was significantly different from that of the NP mice (P< 0·05).
Liver insulin signalling
Higher insulin sensitivity was confirmed and could at least partially be explained by an increase in the phosphorylation of the insulin receptor (Fig. 3(a)), protein kinase B (AKT) (Fig. 3(b)), AMP-activated protein kinase (AMPK) (Fig. 3(c)) and acetyl-CoA carboxylase (Fig. 3(d)) in the liver of the LP mice.

Fig. 3 Phosphorylation (p) of the (a) insulin receptor (IR), (b) protein kinase B (AKT), (c) AMP-activated protein kinase (AMPK) and (d) acetyl-CoA carboxylase (ACC) in the liver of fasting normal-protein diet (NP) and low-protein diet (LP) mice. Data are expressed as a percentage of NP from the phosphorylated protein: total protein ratio. Values are means (n 6 per group), with their standard errors represented by vertical bars. * Mean value was significantly different from that of the NP mice (P< 0·05). GAPDH, glyceraldehyde 3-phosphate dehydrogenase.
Insulin secretion and total insulin content
The changes in insulin dynamics could be attributed to insulin produced by the pancreatic islets (insulin secretion) and/or insulin removed from the plasma (insulin clearance). As expected, the pancreatic islets of the LP mice secreted less insulin under both sub-stimulatory (2·8 mmol/l) and supra-stimulatory (16·7 mmol/l) glucose conditions (Fig. 4(a)). This reduction in insulin secreted by the pancreatic islets of the LP mice could be attributed to impaired islet function (lower glucose-stimulated insulin secretion) (Fig. 4(b)) and lower total pancreatic islet insulin content (Fig. 4(c)).
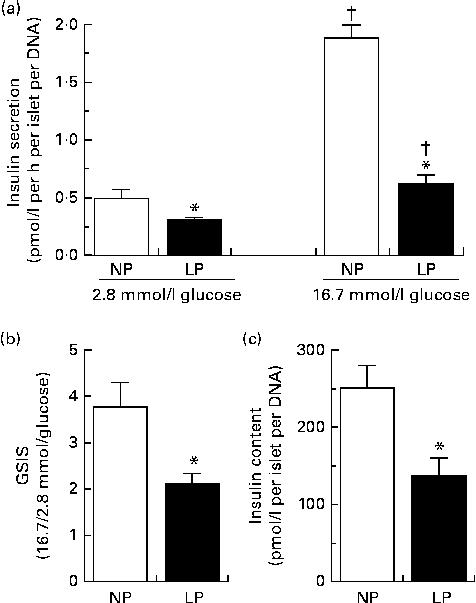
Fig. 4 (a) Insulin secretion, (b) glucose-stimulated insulin secretion (GSIS) and (c) total insulin content of pancreatic islets isolated from the normal-protein diet (NP) and low-protein diet (LP) mice. Values are means (n 12 per group), with their standard errors represented by vertical bars. * Mean value was significantly different from that of the NP mice (P< 0·05). †Mean value was significantly different from that of the respective 2·8 mmol/l glucose mice (P< 0·05).
Insulin clearance
Reduced insulin secretion does not explain why the insulin concentrations of the LP mice were equal to those of the NP mice from 30 to 60 min during the GTT. This apparent contradiction was resolved when we observed reduced insulin clearance (Fig. 5(a)) and slower insulin decay (Fig. 5(b)) in the LP mice. These events resulted in an increased availability of insulin after the administration of exogenous insulin (Fig. 5(c)).
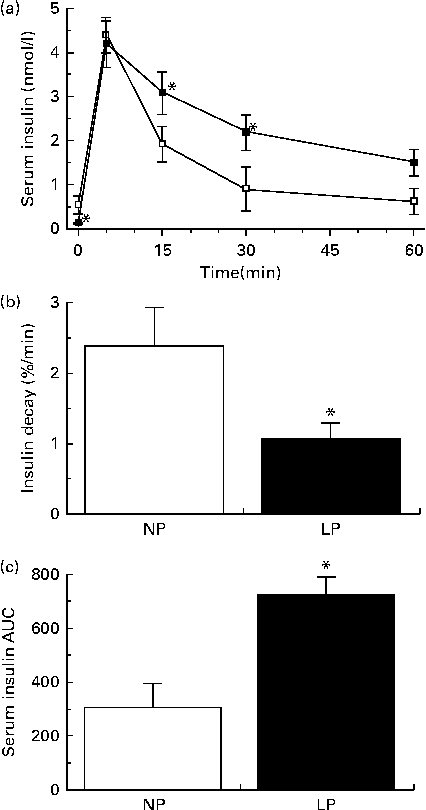
Fig. 5 (a) Insulin clearance, (b) insulin decay rate and (c) AUC of serum insulin during an insulin tolerance test of fasting normal-protein diet (NP) and low-protein diet (LP) mice. Values are means (n 6 per group), with their standard errors represented by vertical bars. * Mean value was significantly different from that of the NP mice (P< 0·05).
Insulin-degrading enzyme expression
Given its major role in the control of insulin clearance and its possible effects on peripheral tissue insulin sensitivity, we also evaluated IDE expression in the liver, gastrocnemius muscle (GCK) and WAT. The expression of IDE was reduced by roughly 50 % in the liver (Fig. 6(a)) and by about 25 % in GCK (Fig. 6(b)), although it remained unchanged in the WAT (Fig. 6(c)).

Fig. 6 Insulin-degrading enzyme (IDE) protein levels in the (a) liver, (b) gastrocnemius muscle and (c) white adipose tissue of fasting normal-protein diet (NP) and low-protein diet (LP) mice. Values are means (n 6 per group), with their standard errors represented by vertical bars. * Mean value was significantly different from that of the NP mice (P< 0·05). GAPDH, glyceraldehyde 3-phosphate dehydrogenase.
Discussion
Most iterations of the thrifty phenotype share three major aspects: reduced insulin secretion by the pancreatic islets; increased insulin sensitivity in the peripheral organs; overall changes in organ development( Reference Hales and Barker 4 , Reference Hales 5 , Reference Hales 15 , Reference Hales and Barker 17 ).
The present study provides solid evidence that mice fed a protein-restricted diet also exhibit reduced insulin clearance associated with reduced IDE expression mainly in the liver and, to a lesser extent, in the skeletal muscle also.
IDE is a 110 kDa zinc metalloproteinase that is present in virtually every insulin-responsive tissue and that responds to the bulk of insulin that is removed and/or degraded from the plasma( Reference Duckworth, Bennett and Hamel 24 , Reference Authier, Posner and Bergeron 27 , Reference Amata, Marino and Russo 31 – Reference Yonezawa, Yokono and Yaso 37 ). Many changes observed in the LP mice can at least partially be attributed to reduced IDE expression in the liver.
First, the primary function of IDE in insulin-responsive organs is to degrade and/or partially inactivate insulin, thus playing, as expected, a pivotal role in the promotion of insulin clearance( Reference Duckworth, Bennett and Hamel 24 , Reference Authier, Posner and Bergeron 27 , Reference Amata, Marino and Russo 31 – Reference Yonezawa, Yokono and Yaso 37 ). Therefore, it is not surprising that the reduced expression of IDE is often associated with reduced insulin clearance in many human and animal models( Reference Rezende, Santos and Santos-Silva 38 – Reference Groves, Wiltshire and Smedley 45 ). The mounting evidence that alterations in IDE are closely related to the development of metabolic diseases, mainly type 2 diabetes, also supports the role of IDE in glucose homeostasis( Reference Farris, Mansourian and Chang 46 – Reference Abdul-Hay, Kang and McBride 48 ). It is likely that the reduction of IDE expression in the liver of the LP mice is the mechanism through which insulin clearance was reduced in our model. It has also recently been found that IDE expression in pancreatic islet β-cells is required for adequate insulin secretion( Reference Steneberg, Bernardo and Edfalk 49 ), suggesting yet another role for this protein in the control of glucose homeostasis, which, although certainly relevant, was not the focus of the present study.
Second, once insulin binds to its receptor in insulin-responsive tissues, the receptor is internalised and continues to signal to downstream cascades, such as AKT, for as long as insulin is still bound to the receptor( Reference Amata, Marino and Russo 31 , Reference Leissring, Malito and Hedouin 50 – Reference Di Guglielmo, Drake and Baass 52 ). Therefore, the lower expression of IDE in LP mice may cause the insulin receptor to be active for a longer period, thus improving the effects of insulin and increasing the uptake of glucose. This hypothesis is also supported by evidence that the selective and specific inhibition of IDE in hepatocytes indeed leads to increased insulin receptor phosphorylation and possibly to increased glucose uptake( Reference Amata, Marino and Russo 31 , Reference Duckworth, Hamel and Peavy 35 , Reference Leissring, Malito and Hedouin 50 – Reference Sato, Terasaki and Mizuguchi 57 ).
Third, although insulin secretion was nearly four times lower in the LP mice, their plasma insulin concentrations under both fasting and non-fasting conditions were only approximately two times lower, which is apparently incongruous. However, once we consider that insulin clearance in the LP mice is half that in the NP mice, we find solid evidence that reduced IDE expression in the liver and subsequently lower insulin degradation contribute to the amelioration of plasma insulin concentrations in the LP mice, which could otherwise be even more hypoinsulinaemic.
The improvement of glucose tolerance and insulin sensitivity in the LP model used in the present study has recently been demonstrated by our research group( Reference Cappelli, Zoppi and Barbosa-Sampaio 7 ). The impairment of insulin secretion in response to glucose in LP rodents after weaning is related to the impairment of intracellular Ca handling( Reference Batista, Ribeiro and da Silva 6 ). Rats exposed to a protein-restricted diet have been found to exhibit lower glucose-induced insulin secretion and improved insulin signalling due to increased concentrations of the insulin receptor in the muscle( Reference Latorraca, Reis and Carneiro 11 ). From the results of the present study, it was found that insulin tolerance improved in the LP mice as a result of the lowering of the AUC values in the ITT and also elevation of the phosphorylated AMPK:AMPK and phosphorylated AKT:AKT ratios in the liver, despite no difference being observed in the phosphorylated AKT:AKT ratio in the liver of the insulin-stimulated animals, as described by Batista et al. ( Reference Batista, Ribeiro and da Silva 6 ). However, there was no difference in the glycaemic and insulinaemic fasting levels, probably because the fasting time in the previous study( Reference Batista, Ribeiro and da Silva 6 ) was shorter than that in the present study. The reduced IDE levels found in the skeletal muscle constitute a corroborating evidence for this insulin-sensitising role of reduced IDE expression, even though it remained unchanged in the WAT. Nevertheless, considering the pivotal importance of liver IDE expression in insulin clearance, it is unlikely that this would have a meaningful impact on the reduced insulin clearance that we observed in the LP mice, which can more likely be attributed to the reduced IDE expression in the liver.
As has been suggested previously( Reference Hales and Barker 17 ), these changes are not a problem per se because when kept in a nutrient-restricted environment, animals and individuals do not develop type 2 diabetes. The actual problem occurs when animals and individuals are suddenly exposed to an excess-nutrient diet, such as a high-fat diet. Under this condition, these entities retain the thrifty phenotype while experiencing nutrient uptake significantly above their metabolic and physiological needs, leading to a process known as catch-up growth, in which animals gain increasingly more weight, particularly in the fat pads, quickly reaching and even surpassing the weight of NP mice( Reference Hales 15 , Reference Claris, Beltrand and Levy-Marchal 58 – Reference Cianfarani, Germani and Branca 60 ). This phenomenon leads to many detrimental changes in glucose homeostasis, mainly increased insulin resistance( Reference Cianfarani, Germani and Branca 60 ) and impaired insulin secretion in response to several secretagogues, such as amino acids and neurotransmitters( Reference Araujo, Amaral and Filiputti 10 – Reference Reis, Carneiro and Mello 12 ). These events ultimately lead to an increased risk of metabolic disorders and type 2 diabetes( Reference Hales and Barker 4 , Reference Hales and Barker 17 ).
In this context, we can speculate that the reduced insulin clearance that helps to manage hypoinsulinaemia in malnourished mice might lead to hyperinsulinaemia, which promotes responsive peripheral insulin resistance when the mice are exposed to a normal and/or a high-nutrient diet.
Although our animal model is not a thrifty phenotype per se, the evidence that we found in the present study might help to expand the knowledge about the thrifty phenotype, given that mice fed a protein-restricted diet not only produce and secrete less insulin, thus preserving nutrients and energy, but also remove and degrade less insulin, which could have the double benefit of sparing insulin while prolonging and potentiating its effects, possibly due to the down-regulation of IDE expression in the liver, and these changes could have implications for the actual instance of the thrifty phenotype.
Acknowledgements
The present study was funded by Fundação de Amparo à Pesquisa do Estado de São Paulo (FAPESP), National Counsel of Technological and Scientific Development (CNPq), and Obesity and Comorbidities Research Center (OCRC). FAPESP, CNPQ and OCRC had no role in the design and analysis of the study or in the writing of this article.
The authors' contributions are as follows: R. L. C. and L. F. R. designed the study; R. L. C., L. F. R., R. C. S. B. and A. P. G. C. conducted the study; R. L. C., L. F. R., E. M. C. and A. C. B. analysed the data; R. L. C. and L. F. R. wrote the article; E. M. C. and A. C. B. reviewed the article; L. F. R. had primary responsibility for the final content. All authors read and approved the final manuscript.
None of the authors has any conflicts of interest to declare.


