Introduction
Snow avalanches are common phenomena in the mountainous areas of snowbound western and central Himalayan regions of the northern Indian border. Avalanches threaten lives and property, both of army staff and of civilians, and disrupt both public and military transport.
A number of mathematical models have been developed worldwide to describe the motion of snow avalanches (Reference SalmSalm, 1966; Reference Perla, Cheng and McClungPerla and others, 1980; Reference Dent and LangDent and Lang, 1983; Reference Norem, Irgens and SchieldropNorem and others, 1987, Reference Norem, Irgens and Schieldrop1989; Reference NohguchiNohguchi, 1989; Reference Savage and HutterSavage and Hutter, 1989; Reference SalmSalm, 1993; Reference McClung and MearsMcClung and Mears, 1995; Reference Bartelt, Salm and GruberBartelt and others, 1999, Reference Bartelt, Buser and Kern2005, Reference Bartelt, Buser and Platzer2006; Reference Naaim, Naaim-Bouvet, Faug and BouchetNaaim and others, 2004). These models have improved the understanding of avalanche motion. However, they are primarily based on point-mass concepts or the hydraulic Saint-Venant equations or their modified form using active–passive pressures first proposed by Reference SalmSalm (1966) and later by Reference Savage and HutterSavage and Hutter (1989) to include the granular media concept. Further, these models consider snow density a constant. Since the volume of snow mobilized is highly variable and depends upon a number of terrain, meteorological and snow parameters, the development of a mathematical model for simulating real-life avalanches becomes complicated because of the complexities involved in constitutive equations of moving snow mass. Recent experimental studies (Reference Kern, Tiefenbacher and McElwaineKern and others, 2004; Reference Tiefenbacher and KernTiefenbacher and Kern, 2004; Reference Platzer, Bartelt and KernPlatzer and others, 2007; Reference Sovilla, Schaer, Kern and BarteltSovilla and others, 2008; Reference Kern, Bartelt, Sovilla and BuserKern and others, 2009) provide deeper insights into the rheological properties of snow avalanches, and thus help improve understanding of constitutive relationships for moving snow mass and energy contained in it.
In real-life situations, the formation zone where avalanches initiate often has density stratification, and a similar condition may exist in avalanche path and runout zones. The layering of snow causes variation in snow properties, especially density, along the depth of the snow layer. The processes that may cause changes in the density of snow mass are compaction due to weight of the overlaying snow and metamorphic changes in the structure of the snow cover due to destructive, constructive and melt metamorphisms. The snowpack properties including density may even change during the avalanche flow because of entrainment, deposition and meteorological conditions. The density variation along the depth of flow, together with the nonuniform vertical velocity profile, complicates the modelling exercise. This necessitates the accurate description of density stratification in currently used constant density avalanche models or the development of density-varying avalanche flow models.
The objective of this paper is to present a one-dimensional (1-D) avalanche dynamics model accounting for vertical density and velocity distributions. The density variation along the depth of flow and the vertical velocity distribution are combined to obtain composite distribution factors that can be readily used in governing partial differential equations describing mass and momentum conservation for snow avalanche movement within the framework of depth-integrated models. The snow flow rheology is conceptualized as a Newtonian fluid (NF) or Criminale–Ericksen–Filbey fluid (CEFF) in order to obtain two different avalanche models, as the plug flow and fluidized layer regimes are represented differently in their velocity distributions. In the following, these models are used to extend the standard Voellmy flow rheology containing a Coulomb and turbulent friction term. The model is tested in experiments carried out on an inclined snow chute at Dhundhi, Manali, India, to obtain the model flow parameters. The resulting differential equations were solved numerically, and the velocities and runout distances were computed for both fluid extensions. The model is validated by comparing computed results with experimentally observed values, and the optimum values of model parameters are obtained.
Model Description
By applying conservation of mass and momentum, a system of partial differential equations has been obtained to describe the dynamics of a snow avalanche down a general path:


where x is the length along the avalanche path, t is the time, g is the acceleration due to gravity, h(x,t) is the avalanche flow depth, p is the depth-averaged snow density, u is the averaged avalanche flow velocity, μ is the Coulomb friction coefficient, ξ is the turbulent friction coefficient, λ a is the internal friction parameter in the active zone, λ p is the internal friction parameter in the passive zone, ac is the mass flux distribution factor and am is the momentum flux distribution factor.
To take into account the density distribution in the avalanche dynamics model, Equations (1) and (2) are obtained by taking mass fluxes instead of volumetric fluxes for continuity and momentum equations.
The mass and momentum flux distribution factors are defined as

where p(.) and v(.) are, respectively, the distribution functions of snow density and velocity along the flow depth, and y is the vertical axis normal to the flow direction.
The momentum flux distribution factor is defined as

Computing distribution factors
For the vertical velocity distribution, two types of fluid models, namely, NF and CEFF, are considered. In the CEFF model, the plug flow and fluidized layer height within the flow regime are clearly defined; they can be obtained from avalanche chute experiments. The measured velocity data extracted from experiments conducted by Reference Nishimura and MaenoNishimura and Maeno (1987, Reference Nishimura and Maeno1989) on a 5.4 m long, 0.1 m wide chute with a 40° slope indicate that the flow of snow mass can be conceptualized as a NF. However, a CEFF model as observed in steady laminar shear flow has been considered by many researchers for developing constitutive flow equations (Reference Norem, Irgens and SchieldropNorem and others, 1987; Reference Bartelt, Salm and GruberBartelt and others, 1999). The experiments conducted by us at Dhundhi on a 61 m long, 2 m wide, 1 m deep chute with 30° and 12° slopes in two different sections indicate considerable slip velocity, and thus signify the strong presence of fluidized and cohesive plug layers. This velocity distribution can be conceptualized as the CEFF model.
The mass flux and momentum flux distribution factors were obtained using Equations (6) and (7) for both NF and CEFF models assuming a constant snow density gradient c 1 . These distribution factors obtained for the NF model can be expressed as


The mass and momentum flux distribution factors obtained for the CEFF model can be expressed as:

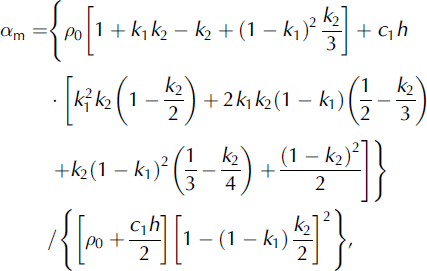
where
u 0 is the slip velocity (velocity at y = 0), u h is the flow velocity at the top surface of the avalanche and h f is the depth of the fluidized layer in the case of the CEFF model.
The average velocities computed for NF and CEFF models can be expressed as:

where U is the flow velocity of the top surface of the avalanche in the case of the NF model.
Numerical solution
The avalanche flow equations are a set of non-linear hyperbolic partial differential equations, and closed form solutions are available only for idealized cases. Thus, they are solved using a numerical technique for most cases. In the present case, a total variation diminishing Lax–Friedrichs (TVDLF) finite-difference method is used. It is an explicit scheme that is easy to use as it does not involve knowledge about the structure of solution of Riemann problems and it uses only flux evaluations. For small flow height, numerical complications can occur in flux calculation. To avoid these, a minimum cut-off value was set on the flow height, h. As soon as h < 10−10 m, the flow depth is set to zero, so the flux is not computed. The model input consists of initial conditions, boundary conditions and model parameters. A computer program was written in MATLAB to solve the set of governing equations. The system of equations was solved for several values of dynamic friction and turbulent friction parameters. The values of internal friction parameter in active and passive zones were kept as 1 and 2.5, respectively. No artificial viscosity terms have been added to the original equations, and the discretized equations contain only those parameters that are well known. It was observed that numerical instability did not occur even when the extreme initial snow-pile geometries and flow parameters were specified.
Snow-Chute Experimental Set-Up
The avalanche experiments were conducted on an inclined snow chute 61 m long, 2m wide and 1m deep (Fig. 1), constructed at Dhundhi (3050 ma.s.l.), 20km from Manali, by the Snow and Avalanche Study Establishment (SASE) of the Indian Defence Research and Development Organisation (DRDO). The chute is divided into six sections: (1) a rectangular cross-section 2 m wide, 5.5 m long and with a 40° slope for snow feeding; (2) a rectangular diverging section 2–4m wide, 7.5 m long and with a 35° slope; (3) a converging section 4–2m wide, 6m long and with a 30° slope; (4) a rectangular cross-section 2 m wide, 22 m long and with a 30° slope; (5) a rectangular cross-section 2m wide, 8m long and with a 12° slope; and (6) an open platform 4 m wide, 12 m long and with a –1.8° slope. The bottom surface of the chute channel is made from mild steel sheets. The uppermost section of the chute is used as a snow reservoir and is separated from the rest of the chute by a release gate. A release of up to 11 m3 of snow is possible through the gate at the end of the hopper. The sliding part of the chute can have a variable slope ranging between 30° and 458. For more information on the snow chute see Reference Upadhyay, Kumar and ChaudharyUpadhyay and others (2010).
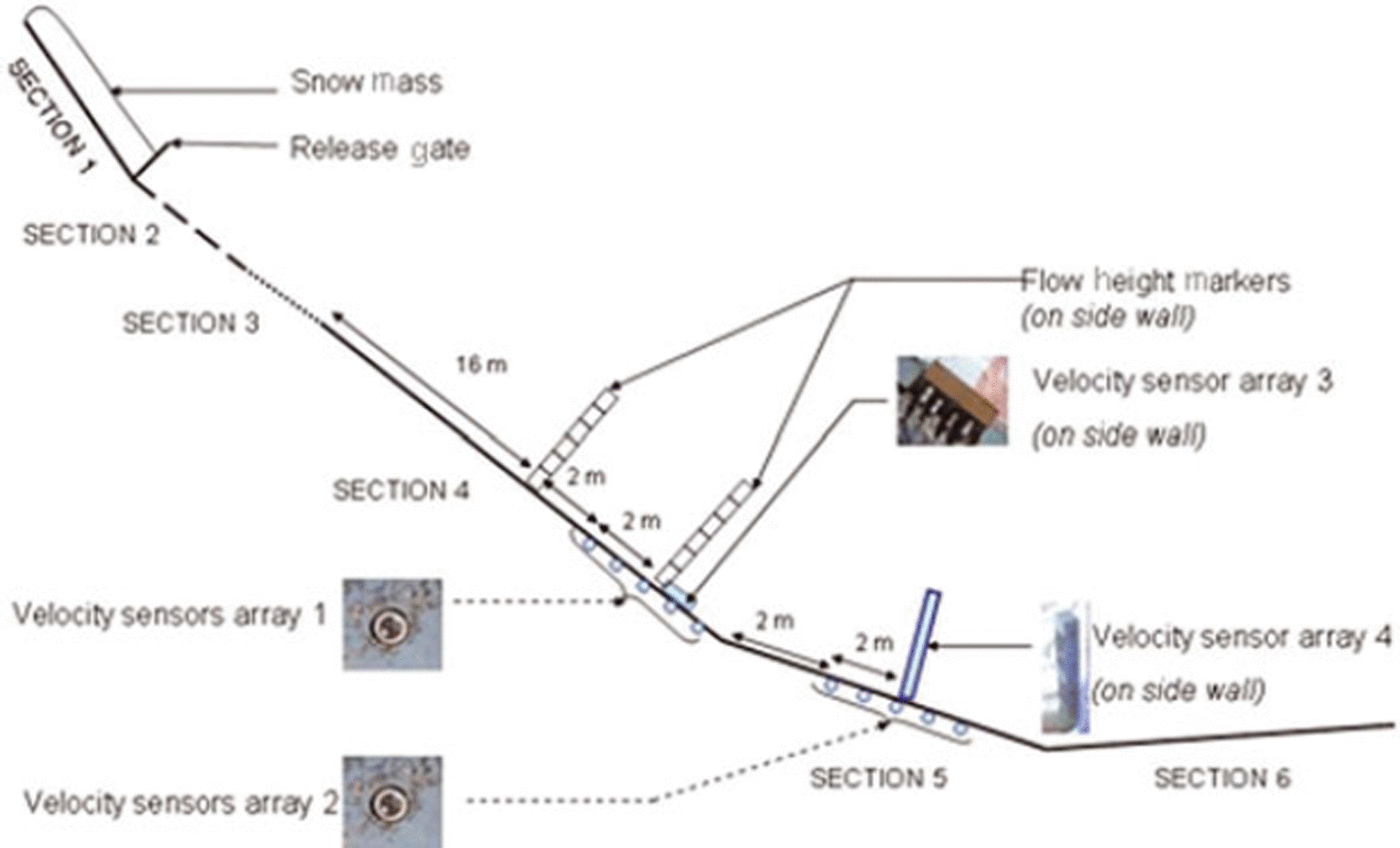
Fig. 1. Schematic diagram of avalanche chute facility at Dhundhi.
To visualize and capture the motion of snow mass in the chute, four charge-coupled device (CCD) cameras are fixed along the chute channel. These cameras are connected to a digital video recorder (DVR), which has a facility to analyse camera pictures frame by frame to study the flow parameters: velocity and height of moving snow mass. The chute surface is marked at fixed intervals of 0.5 m, and the time taken to cross these intervals is noted from the DVR which is used to calculate the velocity of moving snow mass. The optical velocity sensors are also mounted to measure the velocity of flow. To measure the vertical velocity distribution, velocity sensors are also fitted in the chute. The slip velocity of snow mass is determined using velocity sensor arrays 1 and 2 placed, respectively, at the end of section 4 and the start of section 5. Each set consists of five velocity sensors along the flow at a distance of 1 m from each other. Velocity sensor arrays 3 and 4 are mounted on the transparent side wall of the chute on 30° and 12° slopes, respectively, to measure the velocity profile.
Results and Discussion
A number of experiments were carried out on the snow chute for various release depths and different snow densities in order to understand the avalanche flow behavior and test model performance. To investigate the variation of snow density, the snow density was measured at the Dhundhi station for a period of 3 years from 2004 to 2007 while carrying out snow-chute experiments. The snow density was measured at an interval of 5–10cm using a circular sampler (total volume 97.4 cm3) and an electronic weight-balance (maximum weight 4 kg, resolution 0.01 g). It is observed that the snow density is <350kgm−3 at the surface, and increases with depth to nearly 600 kgm−3 at 2 m depth. The variation of observed snow density with flow depth is shown in Figure 2. The regression analysis was carried out using these experimental data to obtain the relationship between snow density and flow depth. This relationship having a correlation coefficient of 0.87 can be expressed as:
where ρ(h) is snow density in kgm at depth h expressed in m.
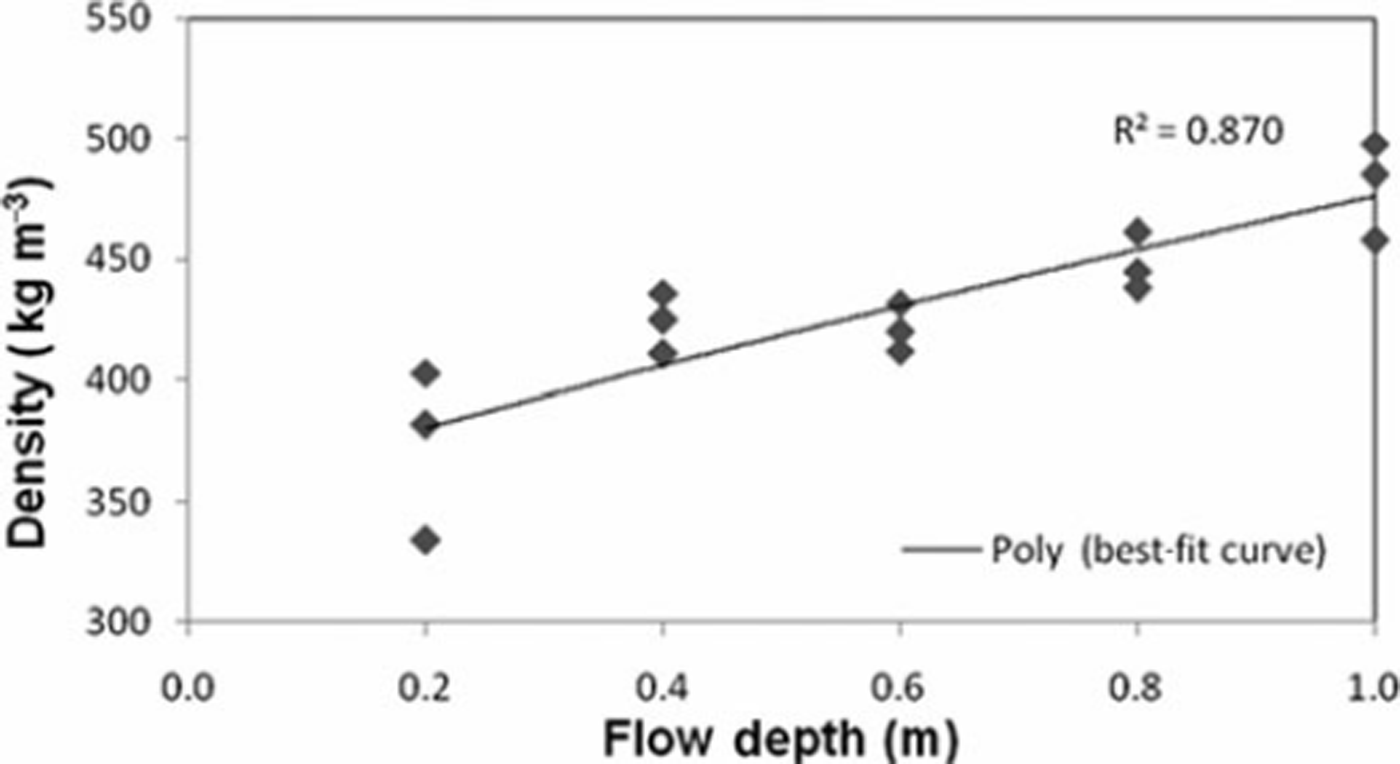
Fig. 2. Variation of snow density with flow depth.
The obtained relationship was further validated with data measured for 2007. The comparison of simulated and observed snow density is shown in Figure 3. The results are in good agreement. The snow density varies along the depth of avalanche flow as well as with time. The variation of snow density with time during avalanche flow for wet snow simulation with a fracture depth of 1 m is shown in Figure 4. The decrease in snow density with time is marginally compensated when the avalanche flow is retarded due to change in the bed slope.
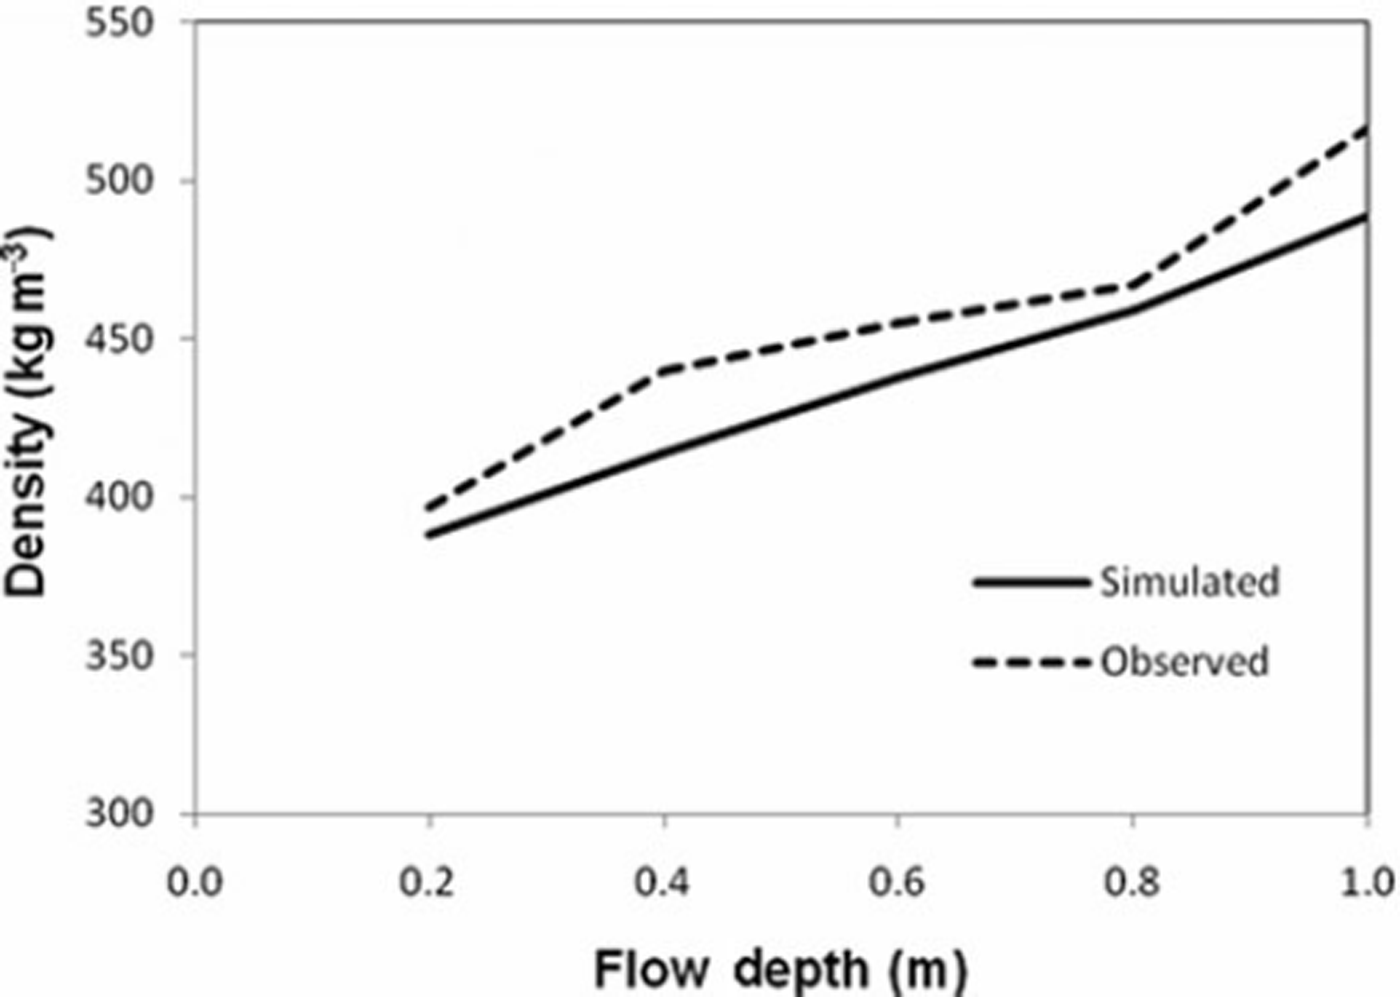
Fig. 3. Comparison of simulated and observed snow density.
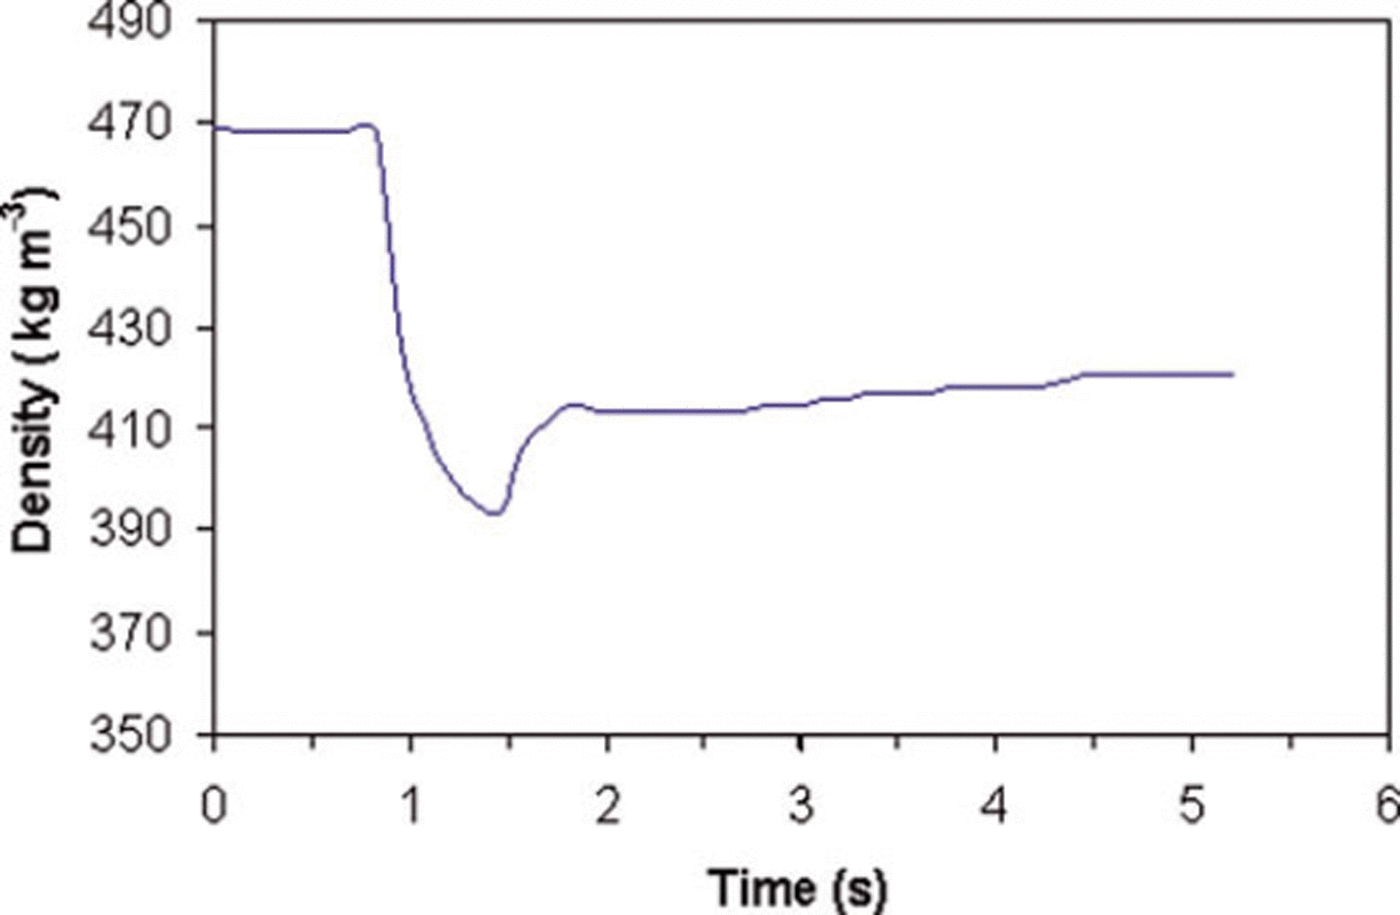
Fig. 4. Variation of snow density with time.
Based on experimental observations, generalized distribution factors were computed for the NF and CEFF models considered in the present study. Figure 5 shows the dimensionless velocity profiles for the models. For the CEFF model, parameters k 1 and k 2 are taken equal to 0.5 and 0.3, respectively. The CEFF model shows considerable slip velocity, whereas there is no slip velocity in the NF model. The cohesive plug and the fluidized layer can be seen in both models. However, the CEFF model precisely describes the cohesive plug and the fluidized layer with clearly defined regimes. Mass and momentum distribution factors were computed for two density profiles having c 1 values of 100 and 200 kg m−3 m−1, with a top-layer snow density of 400 kgm−3. The computed values of mass and momentum flux distributions for the NF model are shown in Figures 6 and 7, respectively. It is evident that the density distribution significantly changes the values of these distribution factors and these values decrease with higher density gradient and increase in the release depth. The gap between the curves of these distribution factors for various density gradients widens with the increase in release depth. Figures 8 and 9 show variations of mass and momentum distribution factors, respectively for the CEFF model. Findings similar to those obtained with the NF model are observed with the CEFF model with a variation of numerical values. The momentum distribution factor is observed to be >1 in the case of the CEFF model.
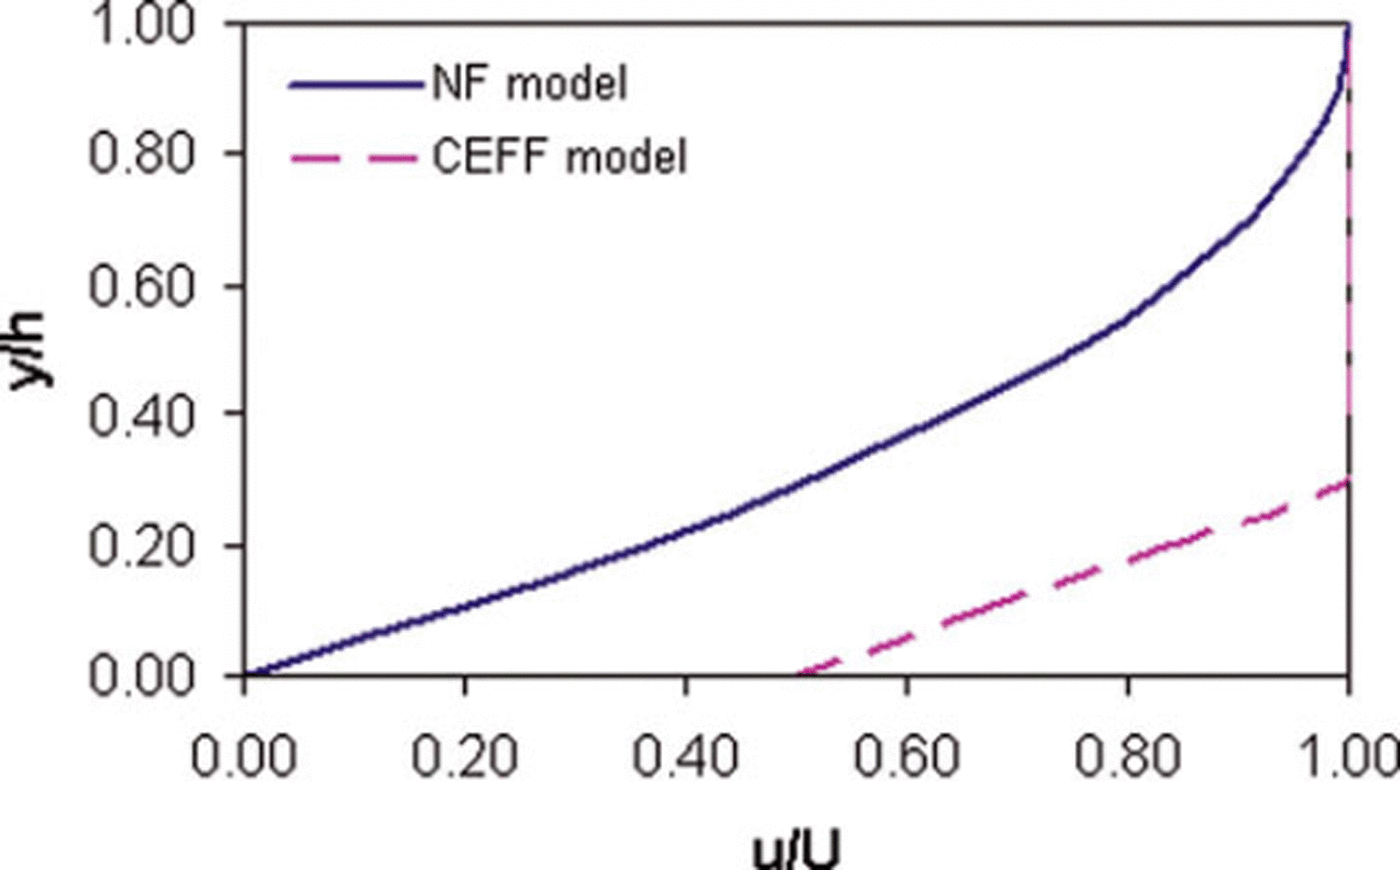
Fig. 5. Dimensionless velocity profiles for NF and CEFF models.
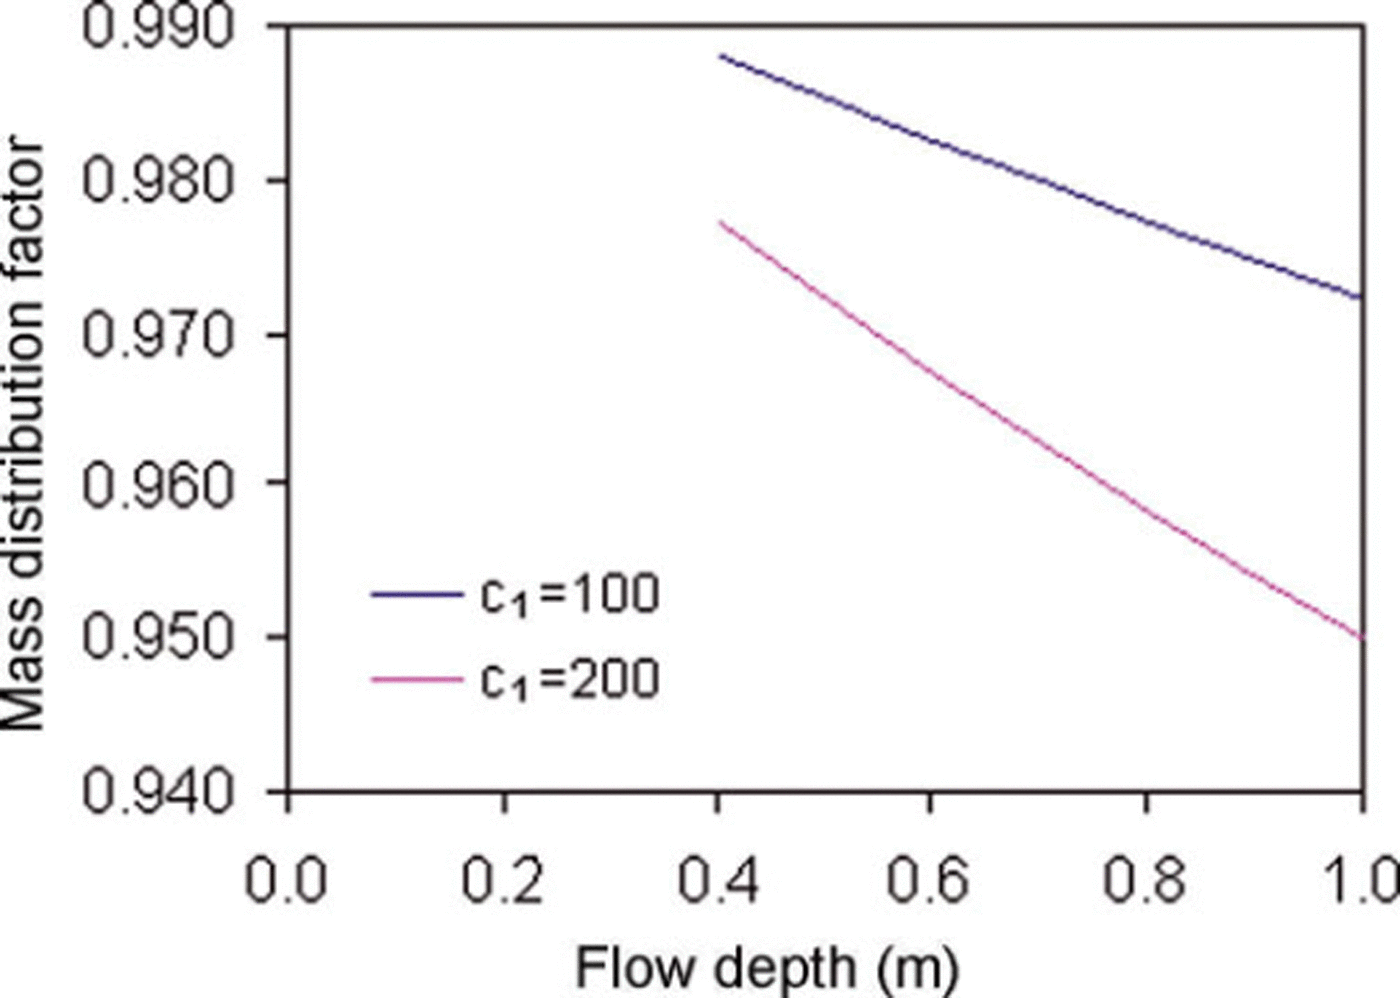
Fig. 6. Variation of mass distribution factor with flow depth for NF model.
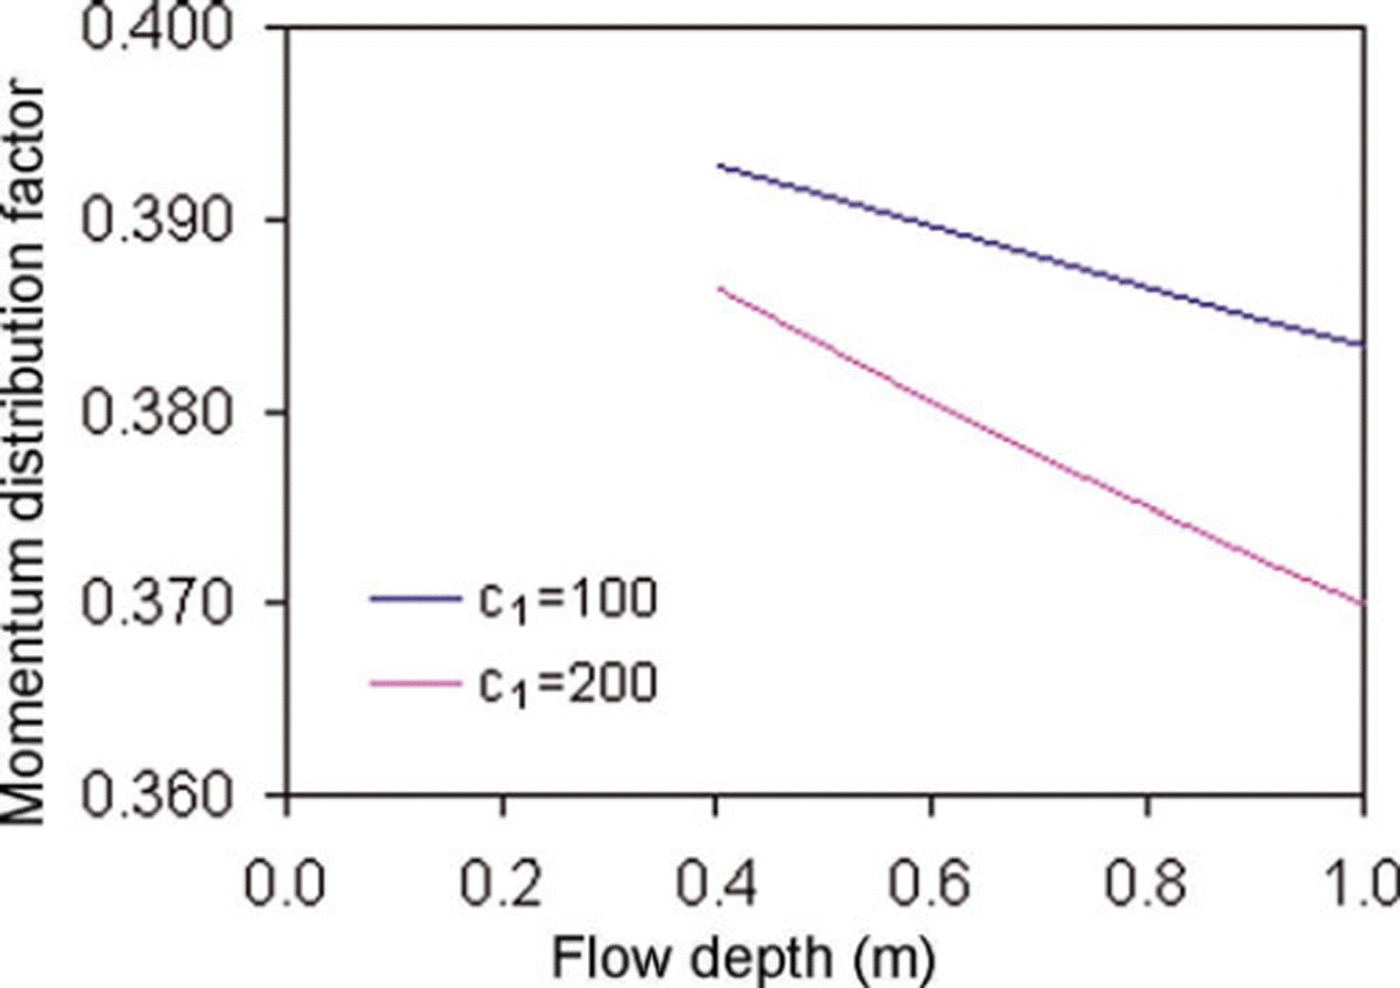
Fig. 7. Variation of momentum distribution factor with flow depth for NF model.
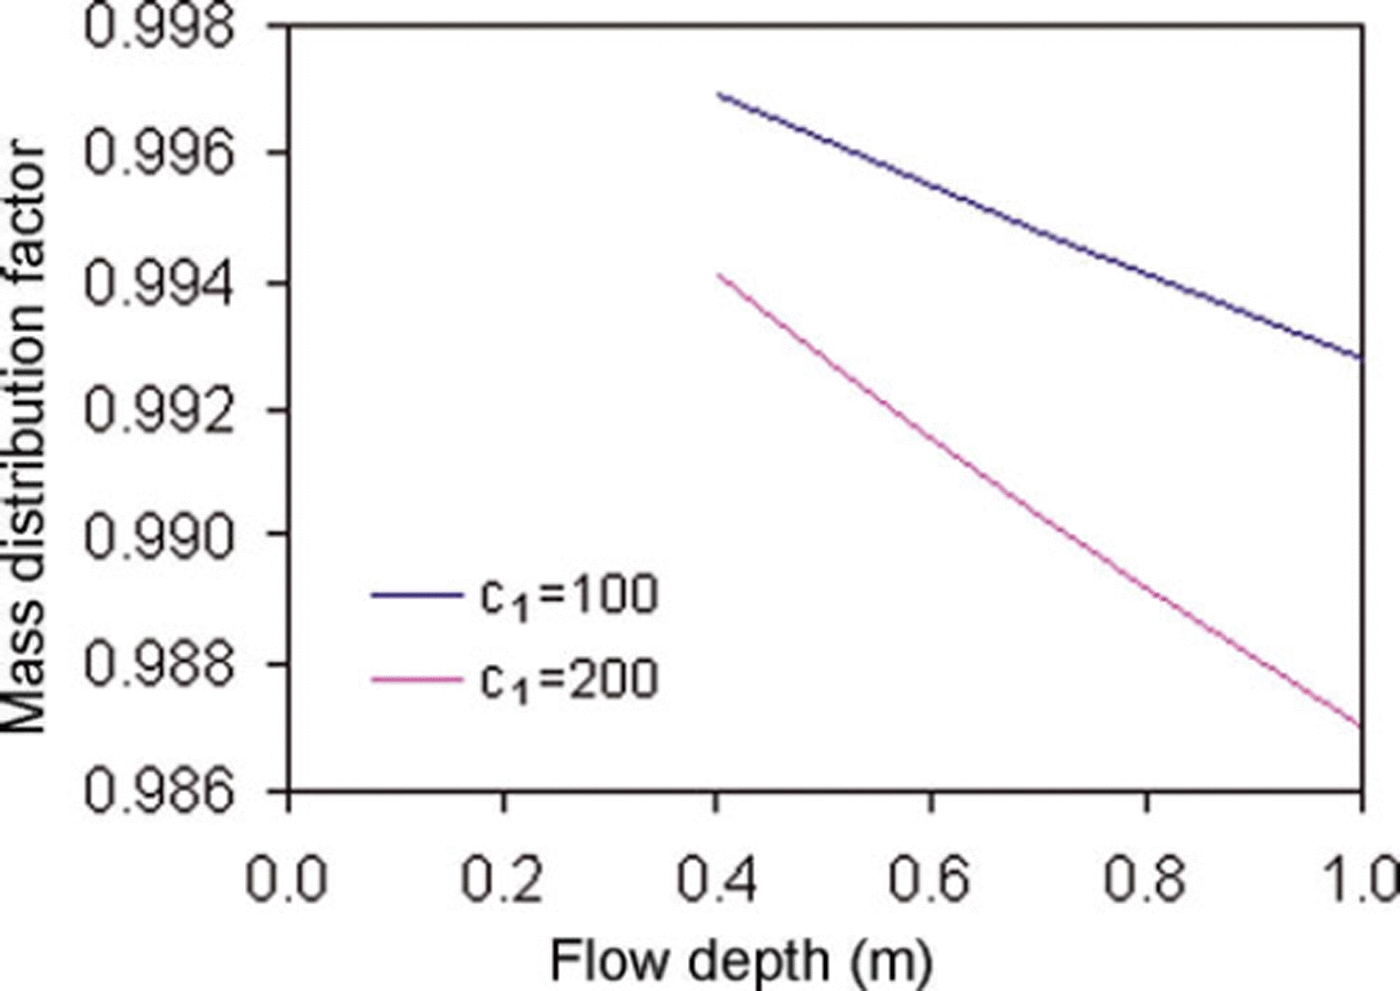
Fig. 8. Variation of mass distribution factor with flow depth for CEFF model.
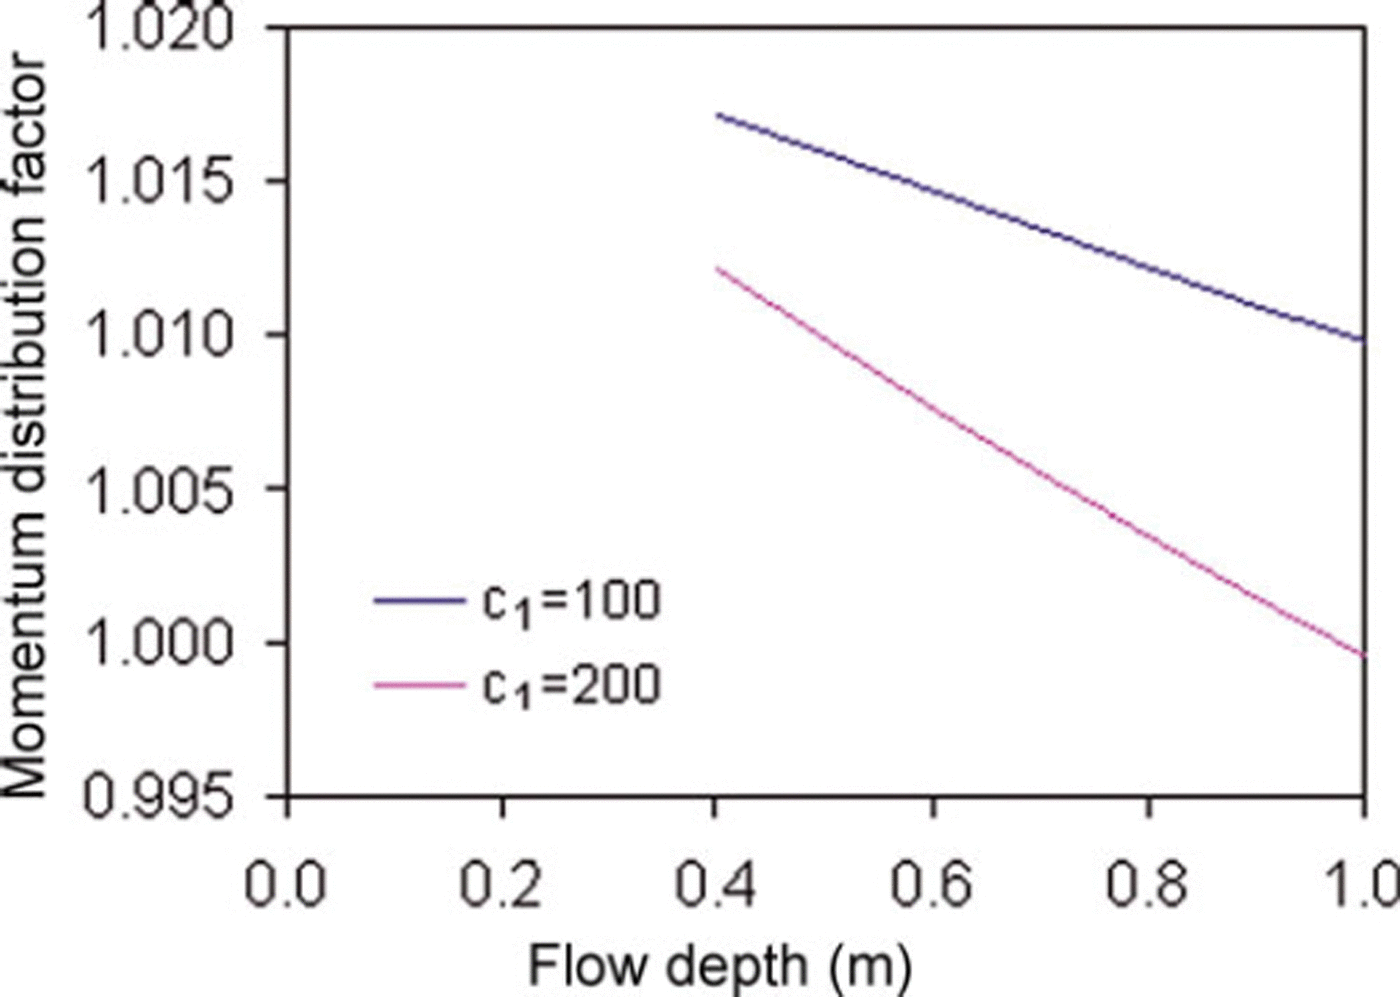
Fig. 9. Variation of momentum distribution factor with flow depth for CEFF model.
The hazard mitigation strategies rely on practical experiments and avalanche dynamics models that predict snow avalanche descent paths, velocity and runout distance. Depending upon the size of avalanche, type of snow and the surface roughness, the values of the Voellmy coefficients of dynamic friction, μ, and turbulent friction, ξ, vary from 0.15 to 0.30 and 600 to 1200, respectively. Numerous simulations of avalanche events have revealed that the magnitude of μ and ξ are site-specific and deviate from the values recommended by the Swiss Guidelines for avalanche calculations (Reference Salm, Burkard and GublerSalm and others, 1990). The values of μ and ξ can be obtained from the measured velocity and runout distance for the known initial and boundary conditions for an avalanche. The fracture depth is varied between 0.3 and 1 m. The velocity and runout distances are simulated for μ at 0.15–0.30 at an interval of 0.05 and for constant ξ values ranging from 600 to 1200 at an interval of 100. The most suitable values of μ and ξ to satisfy runout distance for the developed models are found to be 0.25 and 800, respectively, whereas the most suitable values of μ and ξ to satisfy velocity are found to be 0.2 and 1000, respectively. The values of Coulomb friction agree with measurements by Reference Platzer, Bartelt and KernPlatzer and others (2007) on the Swiss snow chute in Davos. Reference Kern, Bartelt, Sovilla and BuserKern and others (2009) measured velocity profiles in real avalanches at the Vallée de la Sionne test site in Switzerland, which Reference Bartelt and BuserBartelt and Buser (2010) used to deduce the range of Voellmy friction parameters μ and ξ. The values found from our back-calculations are clearly within this range.
Figures 10 and 11 show the variation of runout distance for the NF and CEFF models, respectively. It is evident that the runout distance is significantly influenced by the mass in the release zone. Keeping fracture length constant, the runout distance increases linearly when the fracture depth is raised, showing that runout distance is directly proportional to fracture depth. It is also observed that the runout distance increases when the fracture depth is increased, maintaining constant values for both friction coefficients. Increasing the value of μ causes a decrease in velocity and a shorter runout distance, while decreasing the value of μ gives the converse result. Increasing the value of ξ causes an increase in runout distance for all values of fracture depth. Comparison of the results obtained for both fluid models shows that the CEFF model simulates runout distance better under different initial conditions as compared to the NF model. Figures 12 and 13 show the variation of velocity for the NF and CEFF models, respectively. The results show that velocity is strongly sensitive to μ and is less influenced by ξ As the fracture depth increases, the velocity also increases. It is evident from these figures that the CEFF model simulates velocity better under different initial conditions than does the NF model.
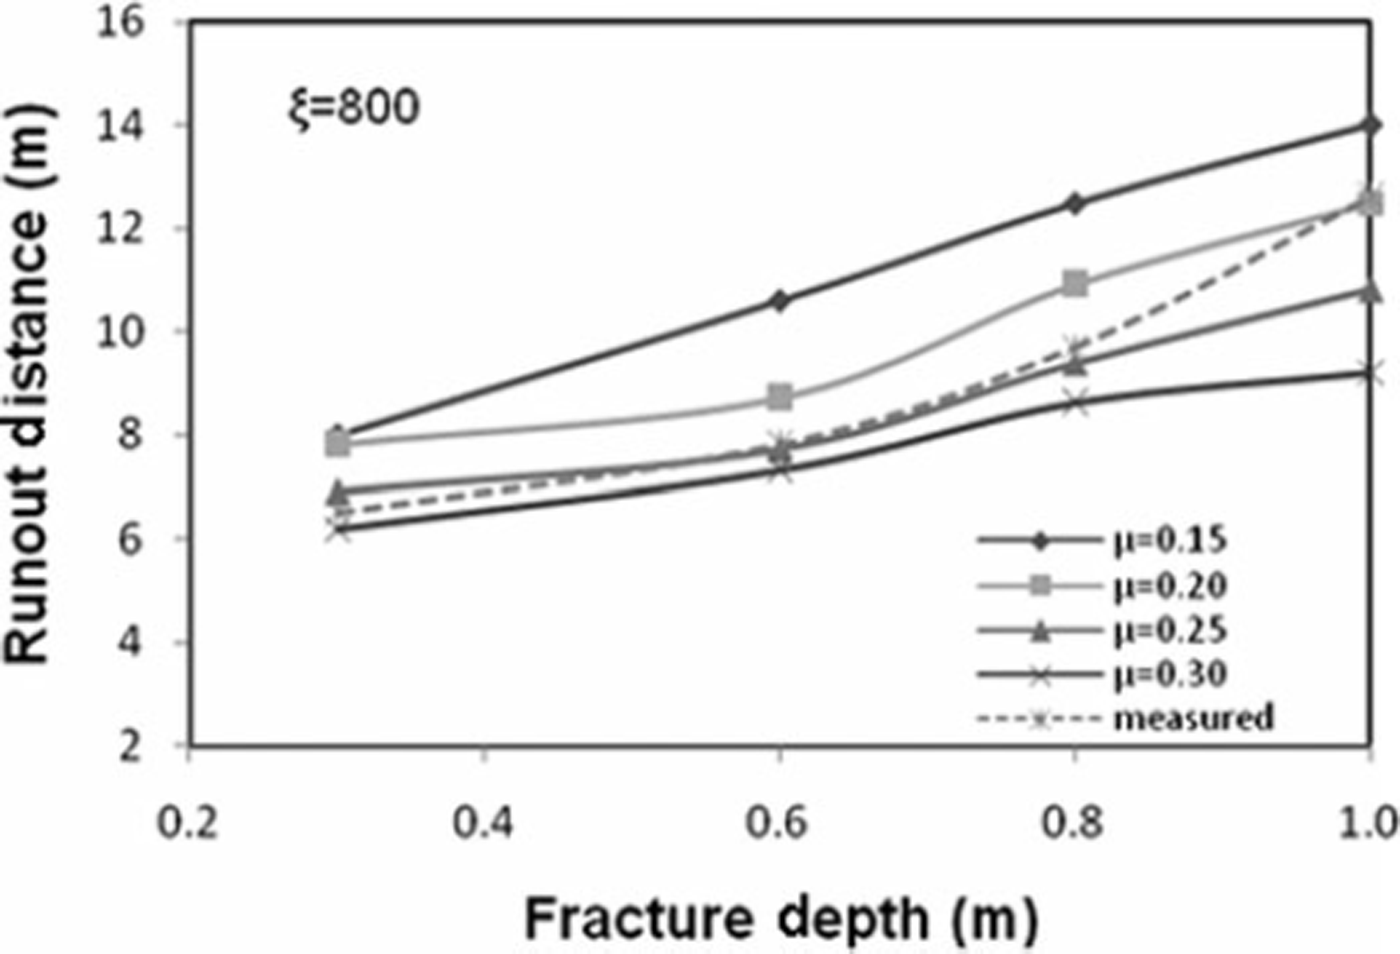
Fig. 10. Variation of runout distance with fracture depth for NF model.
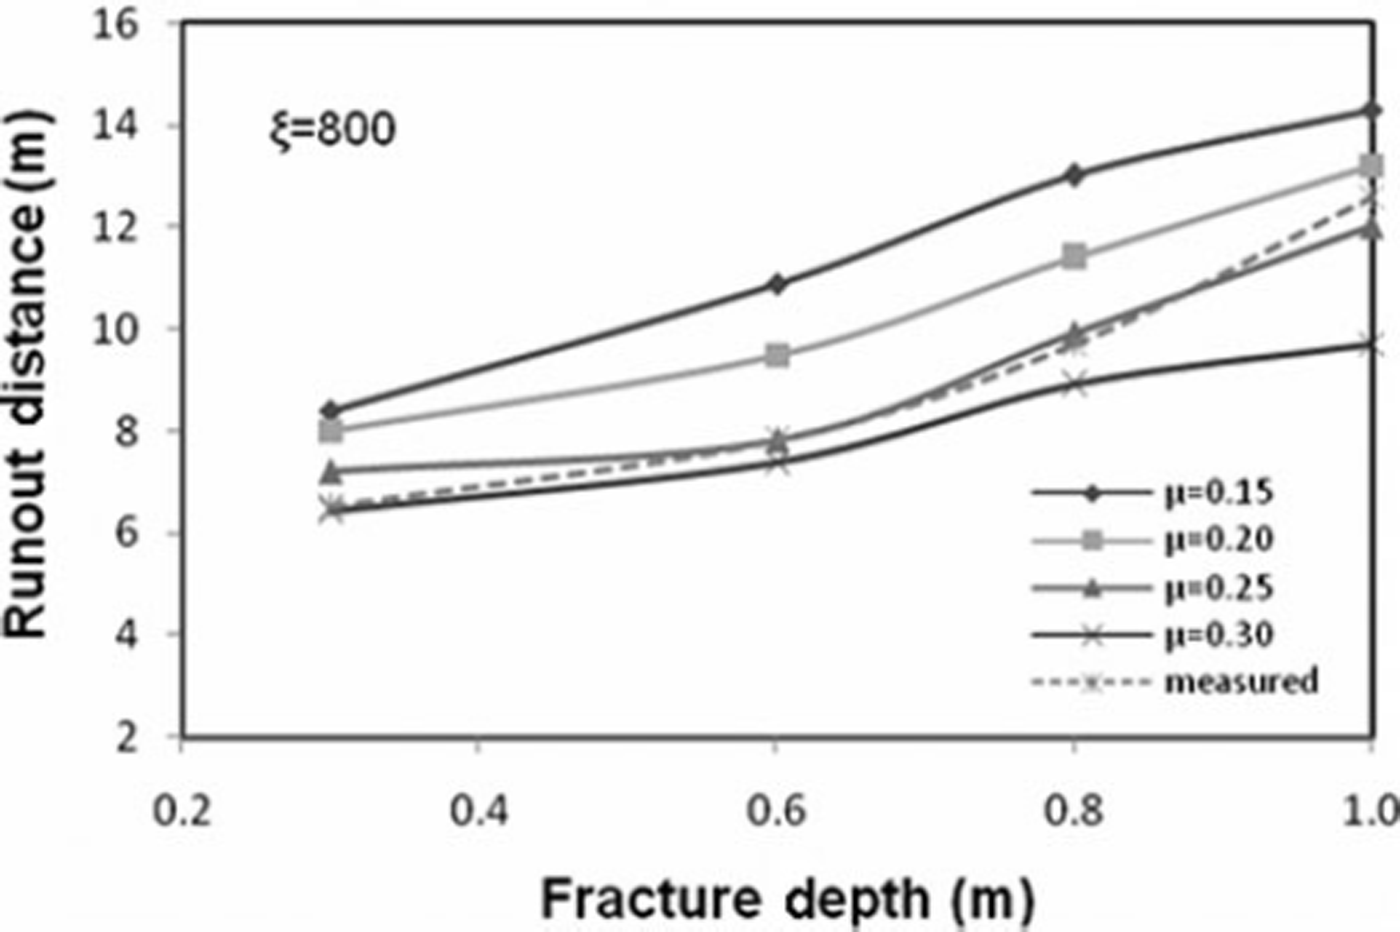
Fig. 11. Variation of runout distance with fracture depth for CEFF model.
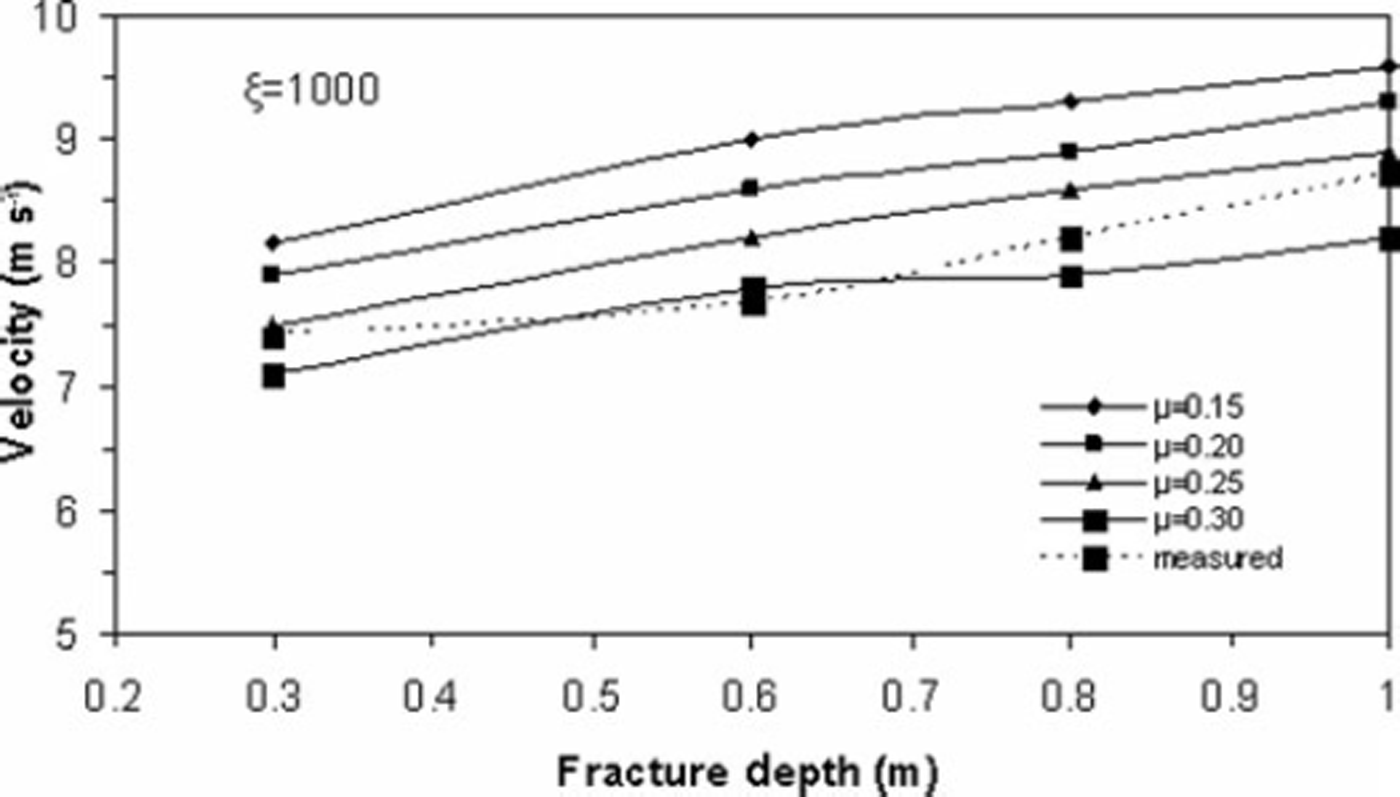
Fig. 12. Variation of velocity with fracture depth for NF model.
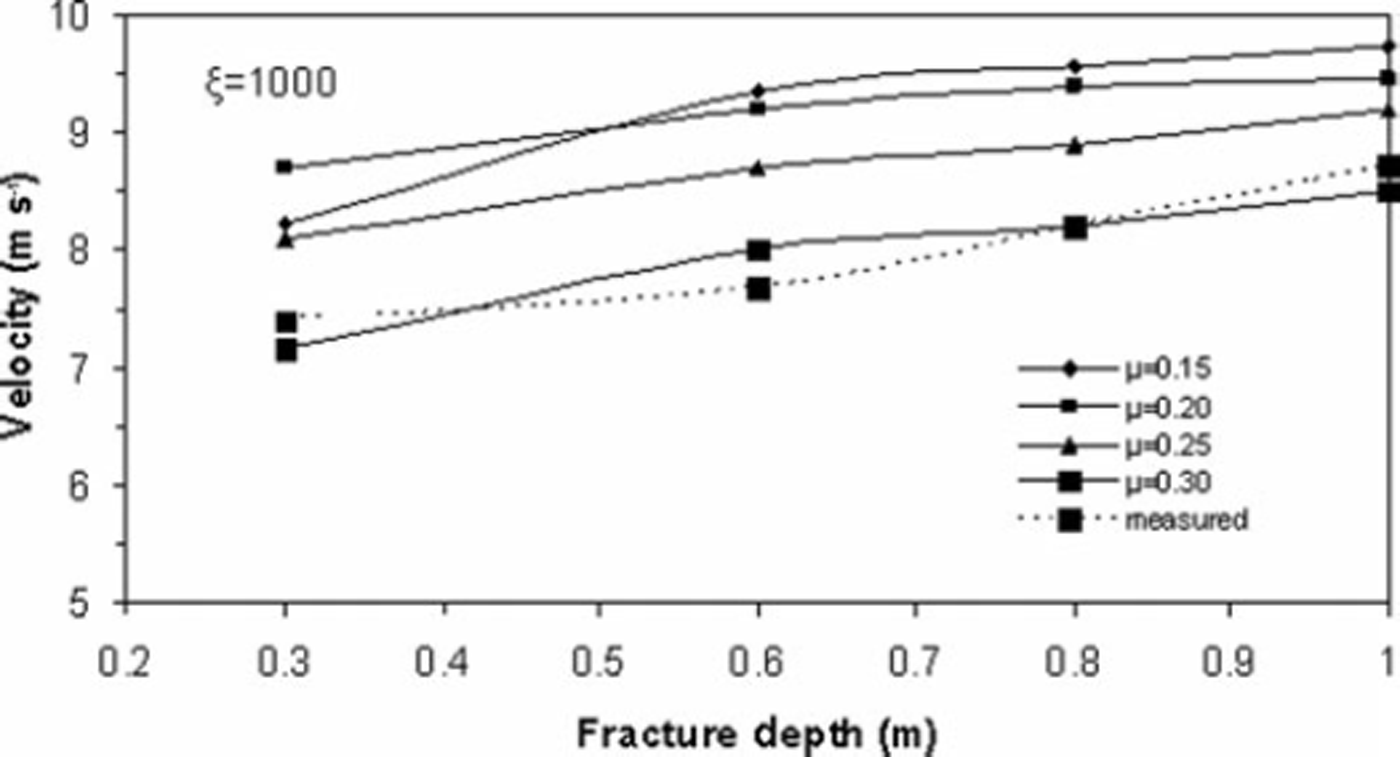
Fig. 13. Variation of velocity with fracture depth for CEFF model
Conclusions
The description of an avalanche dynamics model depends upon formation and terrain characteristics, meteorological condition and snowpack properties. The properties of moving snow mass are highly variable because of associated snow mobilization processes, compaction and metamorphisms. The snow density varies along the depth of the avalanche flow as well as with time. A 1-D numerical model incorporating vertical density and velocity distributions is presented for studying the dynamics of snow avalanches. It resolves many deficiencies of the Vollemy-Salm model, the Norwegian NIS (Norem–Irgens-Schiel-drop) model and the depth-integrated constant density Saint-Venant equations based models. Solutions are obtained using a TVDLF finite-difference method. The study reveals that the cohesive plug and the fluidized layer exist in the velocity profile, and their thicknesses depend upon the snow properties (e.g. snow wetness and snow density). The slip velocity is also observed and its magnitude appears to be controlled by the snow wetness. The avalanche flow can be conceptualized as the NF or the CEFF model depending upon the site-specific conditions. The density stratification can be taken with the vertical velocity distribution to obtain the mass and momentum flux distribution factors for the NF and CEFF models. The values of these distribution factors decrease with higher density gradient and increase in release depth. The gap between the curves of these distribution factors for various density gradients widens with the increase in release depth. The computed velocity and the runout distance show good agreement with the values observed in snow-chute experiments. The avalanche flow velocity is found to be more sensitive to the dynamic friction coefficient than the turbulent friction coefficient. The optimum values of these coefficients for the present case are found to be μ = 0.20–0.25 and ξ = 800–1000, respectively. The CEFF model is observed to simulate the avalanche-flow condition better than does the NF model.
Acknowledgements
Part of this study was carried out under a project financially supported by SASE, DRDO, Chandigarh. We acknowledge SASE for this financial support, and R.N. Sarwarde (Director, SASE) for suggesting and helping to carry out this study. We also thank SASE scientists, particularly A. Ahmed and A. Upadhyay, for help in carrying out snow-chute experiments.


