


1. Introduction
The internal flow of evaporating droplets has received considerable research attention owing to its rich fluid dynamics phenomena and ubiquity in nature and industrial processes (Gelderblom, Diddens & Marin Reference Gelderblom, Diddens and Marin2022; Wilson & D'Ambrosio Reference Wilson and D'Ambrosio2023). In several technical applications, such as coating technology (Brutin & Starov Reference Brutin and Starov2018; Brutin & Sefiane Reference Brutin and Sefiane2022), biological sensors (Brutin et al. Reference Brutin, Sobac, Loquet and Sampol2010; Wen, Ho & Lillehoj Reference Wen, Ho and Lillehoj2013) and the deposition of DNA/RNA microarrays (Miele et al. Reference Miele, Accardo, Falqui, Marini, Giugni, Leoncini, De Angelis, Krahne and Di Fabrizio2015; Chandramohan et al. Reference Chandramohan, Dash, Weibel, Chen and Garimella2016), the flow inside the droplet has been utilized as a method to achieve certain specific functions by controlling its structure. For example, by modifying surface wettability, Dash et al. (Reference Dash, Chandramohan, Weibel and Garimella2014) demonstrated a 15 times increase in the velocity of the recirculating flow inside a water droplet on a superhydrophobic substrate. The manipulation and mixing of particles inside droplets are important for microfluidic devices in biological and chemical applications (Squires & Quake Reference Squires and Quake2005). Wen et al. (Reference Wen, Ho and Lillehoj2013) concentrated aptamer-target complexes in droplets through the internal droplet flow, and established a new biosensor platform for the rapid detection of proteins. Consequently, research on the mechanism of flow convection inside evaporating droplets is an urgent priority, as it can provide valuable insights into the fundamental characteristics of this phenomenon and facilitate its effective utilization.
The convection inside the sessile droplets is generally driven by non-uniform evaporation, surface tension and buoyancy. During the study of the so-called ‘coffee-ring’ effect (i.e. a ring-like deposit left behind by a drying coffee droplet), Deegan et al. (Reference Deegan, Bakajin, Dupont, Huber, Nagel and Witten1997) deemed that the deposition pattern is caused by a capillary flow inside the evaporating droplet that is driven by the non-uniform evaporation rate along the droplet surface, associated with the effect of the pinned contact line. The surface tension also impacts the droplet profile, and any surface tension imbalance generated either by a composition (Sefiane et al. Reference Sefiane, Christy, Duursma, Ebeling, Seewald and Harmand2022) or a temperature (Tam et al. Reference Tam, von Arnim, McKinley and Hosoi2009; Sáenz et al. Reference Sáenz, Sefiane, Kim, Matar and Valluri2015) gradient will impose shear stress on the surface liquid, to form a recirculating flow which is called Marangoni convection. The study of the Marangoni convection can be traced back to as early as the experimental research on wine tears conducted in 1855 by Thomson (Reference Thomson1855). Subsequently, Marangoni (Reference Marangoni1865) developed a detailed theoretical analysis of the phenomenon of wine tears. To commemorate this seminal work, such convection directly driven by surface tension has become known as Marangoni convection.
In previous studies, strong Marangoni convection has been observed in various organic liquids such as methanol, ethanol and 1-hexanol (Sobac & Brutin Reference Sobac and Brutin2012; Bennacer & Sefiane Reference Bennacer and Sefiane2014; Chandramohan et al. Reference Chandramohan, Dash, Weibel, Chen and Garimella2016). However, only very weak flows have been experimentally observed in evaporating water droplets (Savino, Paterna & Favaloro Reference Savino, Paterna and Favaloro2002), despite models that forecast intense thermal Marangoni convection should occur (Hu & Larson Reference Hu and Larson2005). Nguyen & Stebe (Reference Nguyen and Stebe2002) explored the effect of surface-active contaminants on Marangoni convection and explained why Marangoni convection is suppressed in aqueous systems. Contaminants adsorbed on the surface of water droplets can stabilize the interface and greatly inhibit Marangoni flow. Hu & Larson (Reference Hu and Larson2006) pointed out that the Marangoni number corresponding to the flow observed inside water droplets is 100-fold smaller than that predicted theoretically.
In addition to non-uniform evaporation and surface tension, buoyancy can also drive the internal convection of droplets, which is also called natural convection or Rayleigh convection (Kang et al. Reference Kang, Leel, Lee and Kang2004; Trouette et al. Reference Trouette, Chenier, Doumenc, Delcarte and Guerrier2012; Dietrich et al. Reference Dietrich, Wildeman, Visser, Hofhuis, Kooij, Stefan, Harold and Lohse2016). Buoyancy, as a volumetric force, acts on all fluid contained in the droplet based on a density gradient, which causes the lighter fluid to flow upwards and the heavier fluid downwards. The density gradient is generally caused by a concentration gradient (solutal buoyancy) or temperature gradient (thermal buoyancy). Recently, solutal buoyancy has been extensively explored and shown to determine the flow in multicomponent droplets (Edwards et al. Reference Edwards, Atkinson, Cheung, Liang, Fairhurst and Ouali2018; Li et al. Reference Li, Diddens, Lv, Wijshoff, Versluis and Lohse2019; Diddens, Li & Lohse Reference Diddens, Li and Lohse2021). Also, the thermal Rayleigh convection has been widely reported in evaporating water droplets (Kang et al. Reference Kang, Leel, Lee and Kang2004; Pan et al. Reference Pan, Dash, Weibel and Garimella2013; Dash et al. Reference Dash, Chandramohan, Weibel and Garimella2014), where the Marangoni effect is inhibited. For instance, Kang et al. (Reference Kang, Leel, Lee and Kang2004) observed an axisymmetric toroidal flow driven by the buoyancy inside the evaporating droplet on a hydrophobic substrate in which the fluid at the bottom flows upwards along the axis to the apex, and then flows downwards along the droplet surface to the contact line.
An axisymmetric internal convection pattern inside the droplet is expected on account of the axisymmetric shape of the droplet and the axisymmetric boundary condition, including the temperature field surrounding the droplet (Masoudi & Kuhlmann Reference Masoudi and Kuhlmann2017; Josyula, Mahapatra & Pattamatta Reference Josyula, Mahapatra and Pattamatta2022). However, this axisymmetric internal flow is not strictly stable, and various instability mechanisms can trigger the transition to a non-axisymmetric flow structure inside the droplet. For example, various instability patterns of Marangoni flow in evaporating droplets have been reported, such as hydrothermal waves (Carle, Sobac & Brutin Reference Carle, Sobac and Brutin2012; Zhu & Shi Reference Zhu and Shi2021) and Benard–Marangoni cells (Zhu, Shi & Feng Reference Zhu, Shi and Feng2019; Shen, Ren & Duan Reference Shen, Ren and Duan2022). However, the instability mode of Rayleigh–Bénard convection driven by buoyancy is seldomly explored within evaporating droplets, despite extensive investigation in other objects such as rectangular containers (Chong & Xia Reference Chong and Xia2016; Yang et al. Reference Yang, Chong, Wang, Verzicco, Shishkina and Lohse2020), cylindrical containers (Liu et al. Reference Liu, Zeng, Qiu and Yin2021) and liquid bridges (Wanschura, Kuhlmann & Rath Reference Wanschura, Kuhlmann and Rath1996). Dash et al. (Reference Dash, Chandramohan, Weibel and Garimella2014) observed the existence of the non-axisymmetric buoyancy-driven flow patterns in water droplets evaporating on a heated superhydrophobic substrate (where the initial contact angle of the droplet is 160 $^{\circ }$). Subsequently, Yim, Bouillant & Gallaire (Reference Yim, Bouillant and Gallaire2021) conducted a linear stability analysis on the internal flow driven by the buoyancy in a droplet for different contact angles. The results show that the axisymmetric toroidal flow is stable in the droplets with a contact angle of 110
 $^{\circ }$, while for a contact angle of 160
 $^{\circ }$, the axisymmetric flow is unstable and the buoyancy-driven instability will cause non-axisymmetric convection. Currently, the conditions and underlying mechanisms responsible for the generation of a non-axisymmetric flow driven by buoyancy inside the droplet under axisymmetric boundary conditions have not been unravelled.
In the present study, we investigate the transition of internal flow inside an evaporating sessile droplet on both unheated and heated substrates via numerical simulations. First, the simulations are conducted under varying substrate temperature, droplet volume and contact angle, and the influences of these parameters on the internal flow pattern and other evaporation characteristics are investigated. Then, the mechanism by which small perturbations are amplified and affect the stability of the temperature and flow fields is utilized to interpret how these parameters affect the ultimate internal flow pattern. Finally, we compare the convective intensity and heat transfer efficiency within droplets under different flow patterns.
2. Problem statement and assumptions
The current research investigates the internal flow characteristics of a sessile water droplet evaporating on non-wetting substrates with different hydrophobicities, as depicted in figure 1. The different hydrophobicities are realized by setting the contact angles of the droplet resting on the substrate as 110 $^{\circ }$, 140
 $^{\circ }$ and 160
 $^{\circ }$, respectively.

Figure 1. Three-dimensional schematic diagram of a sessile droplet evaporating on hydrophobic substrates with contact angles of 110 $^{\circ }$, 140
 $^{\circ }$ and 160
 $^{\circ }$.
The evaporation process of a sessile droplet on the heated substrate involves various physical mechanisms, such as vapour diffusion, thermal conduction, evaporative cooling and natural convection. To establish an accurate physical model for describing droplet evaporation and internal convection, the following basic assumptions are made.
(i) The shape of liquid droplets remains spherical during the evaporation process. This is justified as the height of all droplets considered in the study does not exceed 1.74 mm, which is smaller than the capillary length of water (2.7 mm), i.e.  $h < (\gamma/(\rho g))^{1/2}$, where
  $h$ is the droplet height,
  $\gamma$ is the surface tension coefficient,
  $\rho$ is the density and
  $g$ is gravitational acceleration; the influence of gravity on the droplet shape can be ignored.
(ii) The evaporation of a droplet is assumed as a quasi-static process. For slowly evaporating droplets, the characteristic time for vapour molecules to diffuse into the gas phase is approximately  $10^{-2}$ s (Cazabat & Guéna Reference Cazabat and Guéna2010), while the total time for complete evaporation of the droplet in this paper is of the order of
  $10^{2}$ s, so the quasi-static assumption is applicable. Under the quasi-static assumption, the evaporation behaviour of the droplet depends only on the instantaneous volume of the droplet and the ambient conditions.
(iii) The Marangoni effect, caused by the surface tension gradient, is neglected for its relatively weak observed effect in water sessile droplets (Dash et al. Reference Dash, Chandramohan, Weibel and Garimella2014). The exact reason for the suppression of thermal Marangoni convection within water droplets remains a topic of considerable discussion in the literature (Hu & Larson Reference Hu and Larson2006; van Gaalen et al. Reference van Gaalen, Wijshoff, Kuerten and Diddens2022). However, further speculation and commentary on this issue are beyond the scope of this work.
(iv) The simulation domain comprises only half of the liquid droplet and its surrounding gas domain. All possible internal flow patterns observed in both previous experiments and simulations have shown symmetry about a vertical central plane. Hence, the consideration of this half-domain is acceptable, aiming to reduce computational cost while maintaining accuracy.
(v) At the droplet–gas interface, the water vapour is assumed to be saturated.
3. Mathematical formulation
3.1. Gas-phase conservation equations
In the gas domain, the continuity, momentum and energy conservation equation can be expressed as follows: continuity equation
 \begin{equation} \boldsymbol{\nabla}\boldsymbol{\cdot}({{\rho }_{g}}\boldsymbol{u})={{S}_{m,g}}, \end{equation}
momentum equation
 \begin{equation} \boldsymbol{\nabla}\boldsymbol{\cdot} ({{\rho }_{g}}\boldsymbol{uu})={-}\boldsymbol{\nabla} p-\tfrac{2}{3}\boldsymbol{\nabla} ({{\mu }_{g}}\boldsymbol{\nabla} \boldsymbol{u})+\boldsymbol{\nabla}\boldsymbol{\cdot} (2{{\mu }_{g}}S)+{{\rho }_{g}}\boldsymbol{g}, \end{equation}
energy equation
 \begin{equation} \boldsymbol{\nabla} \boldsymbol{\cdot} ({{\rho }_{g}}{{c}_{p,g}} \boldsymbol{u}T)-\boldsymbol{\nabla}\boldsymbol{\cdot} ({{\lambda }_{g}}\boldsymbol{\nabla} T)={{S}_{h,g}}, \end{equation}
where  $\rho _{g}$,
  $\mu _{g}$,
  $c_{p,g}$ and
  $\lambda _{g}$ denote the density, dynamic viscosity, thermal conductivity and specific heat capacity of the gas; u, p, g and T are the velocity, pressure, gravitational acceleration and temperature, respectively; S represents the rate-of-strain tensor. The terms
  $S_{m,g}$, and
  $S_{h,g}$ respectively refer to the mass source term and energy source term allocated to the neighbouring cells located at the interface, serving as a method of simulating mass and heat transfer across the interface. Further elaboration on these source terms
  $S_{m,g}$ and
  $S_{h,g}$ will be provided in § 3.3.
In addition, the density of gas, which is an air and water vapour mixture, is calculated based on the ideal gas law
 \begin{equation} {{\rho }_{g}}={{c}_{v}}{{M}_{v}}+\left(\frac{{{p}_{atm}}}{RT}-{{c}_{v}}\right){{M}_{air}}, \end{equation}
in which  $c_{v}$ is the molarity of the water vapour,
  $M_{v}$ and
  $M_{air}$ respectively denote the molecular mass of water vapour and air and R is the universal gas constant equal to 8.3144 J (mol K)
 $^{-1}$.
In the gas domain, the concentration of water vapour plays a crucial role in affecting the evaporation rate of the droplet. Therefore, accurate determination of the spatial distribution of water vapour concentration is necessary. Considering the diffusion and convection of water vapour in the air, the governing equation for the mass fraction of water vapour is
 \begin{equation} \boldsymbol{\nabla}\boldsymbol{\cdot} ({{\rho }_{g}}{{Y}_{v}} \boldsymbol{u})-\boldsymbol{\nabla}\boldsymbol{\cdot} ({{\rho }_{g}}D\boldsymbol{\nabla}{{Y}_{v}})=0, \end{equation}
where  ${{Y}_{v}}={{{c}_{v}}{{M}_{v}}}/{{{\rho }_{g}}}$ is the mass fraction of the water vapour and D is the diffusivity, which is dependent on temperature (Carle et al. Reference Carle, Semenov, Medale and Brutin2016)
 \begin{equation} D(T)={{D}_{ref}}{{\left(\frac{T}{{{T}_{ref}}}\right)}^{1.5}}, \end{equation}
in which the reference diffusivity  $D_{ref} = 2.6\times 10^{-5}\,{\rm m}^{2}\,{\rm s}^{-1}$ corresponds to the value at a reference temperature of
  $T_{ref} = 298.15$ K.
3.2. Liquid-(droplet-)phase conservation equations
In the liquid (droplet) domain, the governing equations that account for continuity, momentum and energy conservation are expressed as follows:
 $$\begin{gather} \boldsymbol{\nabla}\boldsymbol{\cdot} ({{\rho }_{l}}\boldsymbol{u})={{S}_{m,l}}, \end{gather}$$
 $$\begin{gather}\boldsymbol{\nabla}\boldsymbol{\cdot} ({{\rho }_{l}}\boldsymbol{uu})={-}\boldsymbol{\nabla} p-\tfrac{2}{3}\boldsymbol{\nabla} ({{\mu }_{l}}\boldsymbol{\nabla} \boldsymbol{u})+\boldsymbol{\nabla}\boldsymbol{\cdot} (2{{\mu }_{l}}S)+{{\rho }_{l}}\boldsymbol{g}, \end{gather}$$
 $$\begin{gather}\boldsymbol{\nabla} \boldsymbol{\cdot} ({{\rho }_{l}}{{c}_{p,l}}\boldsymbol{u}T)-\boldsymbol{\nabla}\boldsymbol{\cdot} ({{\lambda }_{l}}\boldsymbol{\nabla} T)={{S}_{h,l}}. \end{gather}$$
 The symbols  $S_{m,l}$ and
  $S_{h,l}$ denote the mass source term and energy source term and will be provided in § 3.4.
It is noteworthy that, in previous literature, the Boussinesq assumption has been typically employed to estimate the buoyancy term in the momentum conservation equation. However, this assumption becomes inadequate considering the significant temperature difference/gradient that exists in an evaporating droplet on a heated substrate. As a result, the current study implements a more accurate description of the liquid density by considering it as a polynomial function of temperature, as depicted in table 1.
Table 1. Fluid properties (Linstrom & Mallard Reference Linstrom and Mallard2023) (the symbol T denotes temperature with the unit of Kelvin).

3.3. Gas-phase boundary conditions
The boundary which defines the gas-phase region consists of the droplet–gas interface, the heated substrate and the outer domain boundary.
The outer domain boundary of the gas phase is defined by a pressure-outlet boundary condition, while the temperature and relative humidity are specified as  $T_{\infty } = 21\,^{\circ }$C and
  $H_{\infty } = 36\,\%$, respectively. We seek an idealized representation of the domain where the droplet evaporation should have no interaction with the outer boundary of the gas phase, which requires the distance between the outer boundary of the ambient atmosphere and the droplet to be infinitely large. However, in the numerical simulations, a finite spherical outer boundary is used to represent the ideally infinite environmental boundary. A more detailed discussion on the outer boundary size is given in § 4.3.
The heated substrate is set with a no-slip boundary condition and maintained at a constant temperature  $T_{h}$ above the ambient.
Based on the above assumptions, the boundary conditions at the gas–liquid interface can be described as follows:
 $$\begin{gather} {{\tau }_{lv}}=0, \end{gather}$$
 $$\begin{gather}{{p}_{lv}}={{p}_{sat}}({{T}_{lv}}), \end{gather}$$
where  $\tau _{lv}$ is the shear stress of the gas–liquid interface;
  $p_{sat}$ represents the saturated vapour pressure of water vapour at the corresponding temperature, which can be calculated by the Clausius–Clapeyron equation;
  $p_{lv}$ and
  $T_{lv}$ denote the pressure and temperature at the gas–liquid interface, respectively.
According to the assumption that the water droplet is saturated at the droplet–gas interface, the local evaporation flux of the droplet should be equal to the amount of water vapour transferred from the droplet surface to the ambient through diffusion and convection. The evaporation flux can therefore be calculated as
 \begin{equation} m''={{M}_{v}}({-}D\boldsymbol{n}\boldsymbol{\cdot}\boldsymbol{\nabla} {{c}_{v}}+{{u}_{n}}{{c}_{v}}), \end{equation}
where M denotes the relative molecular mass, and  $u_{n}$ is the normal velocity caused by Stefan flow. In (3.12), the right-hand side comprises two terms that respectively account for the transport of water vapour due to diffusion and convection (Stefan flow). Moreover, because the mass transport of air passing through the droplet–gas interface is zero, we can deduce the normal velocity at the interface as
 \begin{equation} {{{{u}_{n}}|}_{lv}}={-}\frac{{\rm D}\boldsymbol{n}\boldsymbol{\cdot}\boldsymbol{\nabla} {{c}_{v}}}{{{c}_{g}}-{{c}_{v}}}. \end{equation}
By combining (3.12) with (3.13), the expression for the local evaporation flux can be derived as
 \begin{equation} m''={-}\frac{{{M}_{v}}D}{1-{{c}_{v}}/{{c}_{g}}}{{(\boldsymbol{n}\boldsymbol{\cdot} \boldsymbol{\nabla} {{c}_{v}})|}_{lv}}, \end{equation}
where  $c_{v}$ and
  $c_{g}$ respectively are the molar concentrations of water vapour and total gas, which can be calculated using the ideal gas law:
  ${{c}_{v\,|\,lv}}={{{p}_{sat}}({{T}_{lv}} )}/{R{{T}_{lv}}}$,
  ${{c}_{g\,|\,lv}}={{{p}_{atm}}}/{R{{T}_{lv}}}$.
During the process of droplet evaporation, transport of mass and heat/energy will occur at the droplet–gas interface directly proportional to the evaporation flux. In the present research, the associated source terms are imposed on one layer of mesh adjacent to the gas–liquid interface to model the mass and heat transfer across the interface. On the gas side, the mass and heat source terms are given as
 $$\begin{gather} {{S}_{m,g}}=m''{{A}_{cell}}/{{V}_{cell}}, \end{gather}$$
 $$\begin{gather}{{S}_{h,g}}={{S}_{m,g}}{{h}_{sen}}(T), \end{gather}$$
where  $A_{cell}$ and
  $V_{cell}$ respectively refer to the area and volume of the mesh cell adjacent to the droplet interface;
  $h_{sen}$ represents the energy transport caused by sensible heat during evaporation, which can be expressed as
 \begin{equation} {{h}_{sen}}(T)={{c}_{p}}(T-{{T}_{ref}}), \end{equation}
in which  $c_{p}$ is the specific heat at constant pressure, and
  $T_{ref}$ denotes the reference temperature that has been incorporated into the numerical simulation, which is set as 298.15 K.
3.4. Liquid-(droplet-)phase boundary conditions
The boundary of the liquid (droplet) domain can be characterized by the droplet–gas interface and the heated substrate. The boundary condition settings for the heated substrate are the same as those established in the gas domain, namely, no slip and a constant surface temperature. At the interface, the transport of mass and heat resulting from the process of evaporation is also realized through the use of source terms. On the liquid side, the mass and heat source terms are given as
 $$\begin{gather} {{S}_{m,l}}={-}m''{{A}_{cell}}/{{V}_{cell}}, \end{gather}$$
 $$\begin{gather}{{S}_{h,l}}={{S}_{m,l}}{{h}_{sen}}(T)+{{S}_{m,l}}{{h}_{fg}}, \end{gather}$$
where  $h_{fg}$ denotes the latent heat of vaporization, and the second term on the right side in (3.19) simulates the evaporative cooling effect.
4. Numerical methodology and validation
4.1. Numerical implementation
The governing equations are solved using the ANSYS 15.0 software package, which utilizes the pressure-based FLUENT solver and incorporates user-defined functions to implement the heat and mass transport source terms at the droplet interface. The Semi-Implicit Method for Pressure Linked Equations (SIMPLE) algorithm is used to achieve pressure–velocity coupling for the low-speed incompressible flows in the domain. The Green–Gauss node-based method, which provides second-order accuracy, is employed for spatial discretization to accurately evaluate scalar gradients. The body force weighted scheme is used for pressure discretization, as it is better suited for buoyancy-related calculations. For momentum, energy and user-defined scalars, the first-order upwind scheme is selected, and a convergence criterion of  $1\times 10^{-6}$ is employed for continuity and momentum equations,
  $1\times 10^{-15}$ for the energy equation and
  $1\times 10^{-9}$ for user-defined scalars.
4.2. Mesh generation and independence
An unstructured mesh is employed throughout the three-dimensional computational domain, as depicted in figure 2. To accurately capture the coupled transport phenomena of heat and mass near the liquid–gas interface, local refinement of the mesh is performed until mesh independence is confirmed. To investigate grid convergence, four successively finer grids were considered, namely grid I (with 700 k cells), grid II (1380 k cells), grid III (2850 k cells) and grid IV (5210 k cells). Grid III was observed to provide insensitivity to further mesh refinement and was selected for the simulation. Across all cases, the total number of mesh cells ranges from approximately 2.6 to 3.3 million, with a minimum grid size of approximately  $6.5\times 10^{-6}$ m.

Figure 2. Illustration of the mesh set-up of the three-dimensional computational domain.
4.3. Gas domain size verification
The current study aims to investigate an evaporating droplet placed in a large open space. While it is infeasible to have an ideally infinitely large domain in numerical simulations, the domain size is set to have a large finite distance  $L_{\infty }$ from the origin of the coordinate system, as shown in figure 1. For two-dimensional axisymmetric models typical in the literature, a very large size of
  $L_{\infty } = 200r$ (where r is the radius of the droplet) is often chosen as the outer boundary of the computational domain (Pan et al. Reference Pan, Dash, Weibel and Garimella2013; Pan, Weibel & Garimella Reference Pan, Weibel and Garimella2020). However, considering the significant increase in the computational cost of the three-dimensional model established in this study, two sizes of
  $L_{\infty } = 40r$ and
  $L_{\infty } = 100r$ were analysed to determine their influence on the evaporation rate. It was found that the change in the evaporation rate due to the effect of the boundary was less than 0.26 % when
  $L_{\infty }$ was increased to
  $40r$ or
  $100r$. Therefore,
  $L_{\infty } = 40r$ is deemed acceptable for the three-dimensional numerical simulations presented in this study. We recognize that far-field Robin boundary conditions could be utilized as an alternative to the Dirichlet conditions employed in our current numerical model. As suggested by Diddens (Reference Diddens2017), Robin boundary conditions can achieve comparable accuracy with significantly smaller gas domains.
4.4. Verification of temporal evolution of the droplet volume
The temporal evolution of the droplet volume predicted by the three-dimensional model is compared with the experimental results from Dash & Garimella (Reference Dash and Garimella2014), as shown in figure 3. The simulation settings are kept consistent with the experimental conditions described in the literature. The contact angle and the initial volume of droplet are 160 $^{\circ }$ and
  $3\,\mathrm {\mu }$l. The substrate temperatures are 40
  $^{\circ }$C, 50
  $^{\circ }$C and 60
  $^{\circ }$C, with the ambient temperature and relative humidity being 21
  $^{\circ }$C and 36 %, respectively. Based on the assumption that evaporation is considered a quasi-steady process, the instantaneous evaporation rate
  ${\rm d} m/{\rm d} t$ at an instantaneous volume can be solved via the steady-state numerical model mentioned above. Integration of the instantaneous evaporation rate for multiple simulations performed at different droplet volumes (corresponding to different time instants) gives the temporal evolution of droplet volume during evaporation
 \begin{equation} V(t)={{V}_{0}}-\int_{0}^{t}{\frac{{{\rm d} m}/{{\rm d} t}}{{{\rho }_{l,ave}}}}{\rm d} t, \end{equation}
where V is the droplet volume,  $V_{0}$ is the initial volume of the droplet and
  $\rho _{l,ave}$ is the average droplet density calculated based on the droplet's average temperature (table 1). The volume evolution displayed in figure 3 shows that the predictions of the present model closely match the experiments at three different substrate temperatures.

Figure 3. Comparison of the temporal variation of the droplet volume under different temperatures with the experiments of Dash & Garimella (Reference Dash and Garimella2014).
5. Results and discussion
In the following subsections that describe the buoyant flow patterns inside evaporating sessile water droplets, we first demonstrate the existence of two different internal flow patterns in § 5.1, axisymmetric and non-axisymmetric. The effects of droplet contact angle, droplet volume and substrate temperature on the flow pattern are investigated in § 5.2. Then, we analyse the flow instability mechanism which causes the internal flow transition from axisymmetric to non-axisymmetric (§ 5.3) and discuss the influencing factors of the critical Ra, which signifies the onset of the instability (§ 5.4). Finally, § 5.5 discusses the heat transfer efficiency within the droplet and analyses why the internal flow tends to transition to a non-axisymmetric flow pattern from an energy minimization perspective.
5.1. Breakdown of axisymmetric internal flow behaviours in evaporating water droplets
In this study, it is shown that an increase of substrate temperature leads to a significant change in the evaporation characteristics of evaporating water droplet, namely a transition of the internal flow characteristic from one axisymmetric flow pattern to a different non-axisymmetric pattern. This is demonstrated in the following analysis considering a droplet with a volume of  $3\,\mathrm {\mu }$l that subtends a contact angle of 140
 $^{\circ }$ with the substrate, as a representative case.
The convection inside the sessile water droplet is driven by the density gradient arising from the temperature difference between the heated substrate and the surrounding ambient. Under the combined influence of evaporative cooling at the droplet surface and heating of the substrate, the temperature field is characterized by high temperature at the bottom of the droplet and low temperature near the liquid–gas interface. Within the temperature range under investigation, the density of water exhibits an inverse proportionality with respect to temperature. In addition, water droplets are placed on horizontal substrate, and so the gravitational force acts in a vertical downward direction along the axis of the droplet. Consequently, under the buoyancy forces, there is a tendency for the fluid with higher temperature and lower density at the bottom of the droplet to ascend, while the fluid with lower temperature and higher density at the droplet surface tends to descend, thereby resulting in a buoyancy-driven convective flow within the droplet.
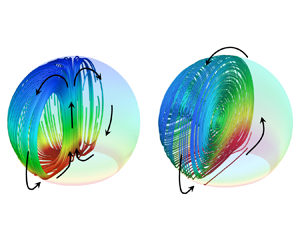
When the substrate temperature is 25  $^{\circ }$C, an axisymmetric toroidal vortex pattern is observed in the droplet, with the flow structure depicted in figure 4. The high-temperature fluid located near the substrate ascends along the central axis of the droplet, eventually reaching the droplet apex. Simultaneously, the low-temperature fluid near the droplet apex descends along the droplet surface towards a three-phase contact line and subsequently is reheated as it flows radially inward along the substrate from contact line to the centre axis. The entire flow field is axisymmetric with respect to the droplet axis, and a counter-rotating vortex pair can be observed in any cross-section through the droplet central axis.

Figure 4. Three-dimensional flow streamlines within an evaporating water droplet with a volume of  $3\,\mathrm {\mu }$l on a 25
  $^{\circ }$C substrate with a contact angle of 140
 $^{\circ }$: (a) three-dimensional, (b) side and (c) front views. The flow exhibits an axisymmetric toroidal vortex pattern. The translucent interface and streamlines are coloured by the temperature.
The upward flow along the axis facilitates the ascent of the hot fluid, and meanwhile, the downward flow along the surface drives the descent of the cold fluid. It is pertinent to note that heat transfer occurs concurrently with mass transfer in this process. Further inspection of the velocity of internal flow will be discussed in § 5.2.
As the substrate temperature is increased to 35  $^{\circ }$C, the flow structure in the droplet displays a drastically different non-axisymmetric pattern characterized by a single vortex, as depicted in figure 5. Specifically, the high-temperature fluid located at the droplet bottom ascends along one side of the droplet surface towards the apex, and subsequently flows downward along the opposite side towards the droplet bottom. This process is accompanied by a decrease in the temperature of the fluid as it traverses the surface, resulting from the effect of evaporation cooling. The fluid is reheated as it flows across the bottom of the droplet in contact with the substrate.

Figure 5. Three-dimensional flow streamlines within an evaporating water droplet with a volume of  $3\,\mathrm {\mu }$l on a 35
  $^{\circ }$C substrate with a contact angle of 140
 $^{\circ }$. (a) Three-dimensional, (b) side and (c) front views. The flow exhibits a non-axisymmetric flow pattern. The translucent interface and streamlines are coloured by the temperature; note the difference in the temperature scale relative to figure 4.
The internal convection structure depicted in figure 5 exhibits a clear lack of symmetry about the central axis of the droplet. Nonetheless, it maintains a different symmetrical characteristic with respect to on particular cross-sectional plane, shown as the  $x$–
$x$– $y$ plane in figure 5. In this symmetric plane, a single vortex occupying the entire cross-section of droplet can be observed. Furthermore, this internal flow characterized by single vortex results in a significant temperature gradient across the droplet surface, with the side exhibiting an upward flow having a substantially higher temperature than on the downward-flowing side.
To further illustrate the above-mentioned transition to non-axisymmetric evaporation characteristics, the temperature distributions, the evaporation rate and the vapour concentration are compared between the droplets on the substrate with a temperature of 25  $^{\circ }$C vs 35
  $^{\circ }$C in figure 6.

Figure 6. Evaporation characteristics of droplet with a volume of  $3\,\mathrm {\mu }$l and a contact angle of 140
 $^{\circ }$. Contour maps of the temperature on the droplet surface and the corresponding top and bottom views when the substrate temperature is (a) 25
  $^{\circ }$C vs (b) 35
  $^{\circ }$C. Temperature profiles along the mappings from the x and z axes to the droplet surface when the substrate temperature is (c) 25
  $^{\circ }$C vs (d) 35
  $^{\circ }$C. Local evaporation flux along the droplet surface when the substrate temperature is (e) 25
  $^{\circ }$C vs ( f) 35
  $^{\circ }$C. Contour maps of water vapour mass fraction (sectional view of
  $x$–
$x$– $y$ plane) in the surrounding gas domain when the substrate temperature is (g) 25
  $^{\circ }$C vs (h) 35
  $^{\circ }$C.
Figure 6(a,b) presents the temperature contour maps on the droplet surface and the corresponding top and bottom views. A more quantitative comparison can be drawn from figure 6(c,d), which depicts the temperature distribution along the surface of the droplet, where the horizontal ordinate (from  $-1$ to 1) tracks the normalized arc length along the droplet surface. Solid vs dashed lines correspond to traces along the droplet surface mapped from the
  $x$–
$x$– $y$ and
  $z$–
$z$– $y$ planes. The evaporation process involves the absorption of latent heat of vaporization, resulting in a decrease in the liquid–gas interface temperature and consequently establishing a temperature gradient between the bottom and the surface of the droplet. When the substrate temperature is maintained at 25
  $^{\circ }$C, the surface temperature variation curves mapped along the
  $x$–
$x$– $y$ and
  $z$–
$z$– $y$ planes exhibit a high degree of similarity and the temperature distribution on the droplet surface is axisymmetric. There is a gradual temperature decrease observed from the contact line towards the apex of the droplet; the temperature is minimum at the droplet apex. However, when the substrate temperature is 35
  $^{\circ }$C, the temperature variation curves mapped along the
  $x$–
$x$– $y$ and
  $z$–
$z$– $y$ planes are observed to have obvious deviations from axisymmetric profiles. The location of the lowest temperature moves away from the apex of the droplet; more precisely, the coolest location occurs at the normalized arc length of
  $-$0.38 in the x direction.
The local evaporation flux along the droplet surface is presented similarly in figure 6(e,f). It can be observed for both substrate temperatures that the evaporation flux at the contact line is significantly higher compared with other regions of the droplet. And along the droplet surface from the contact line to the apex, the evaporation rate will first decrease rapidly to a local minimum value, and then increase slowly and slightly. According to (3.11) and the ideal gas law, the evaporation rate is closely correlated with temperature. Therefore, the evaporation flux profile exhibits a trend consistent with the temperature distribution. When the substrate temperature is 25  $^{\circ }$C (figure 6e), the variation of the evaporation rate along surface exhibits a remarkable level of symmetry about the central y-axis of the droplet. When the substrate temperature is 35
  $^{\circ }$C (figure 6f), the evaporation rate along the x direction is non-axisymmetric, and the evaporation rate in the negative x-directional side of the droplet surface is observed to be higher than that on the opposite side. Contour maps of the water vapour mass fraction in the surrounding gas domain in the sectional
  $x$–
$x$– $y$ plane view are depicted in figure 6(g,h). Due to the higher evaporation rate at the contact line, the region near the contact line exhibits the highest vapour concentration. In accordance with the distribution of evaporation rates, when the substrate temperature is set at 25
  $^{\circ }$C (figure 6g), the vapour concentration field exhibits y-axis symmetry (i.e. axisymmetric), and this symmetry is lost when the temperature is increased to 35
  $^{\circ }$C (figure 6h).
5.2. Factors influencing the internal flow pattern: contact angle, substrate temperature and droplet volume
In order to assess the influence of additional parameters on the internal flow and other evaporation characteristics of the droplets, this section investigates sessile droplets on the substrates with different contact angles ranging from 110 $^{\circ }$ to 160
 $^{\circ }$, substrate temperatures ranging from 30
  $^{\circ }$C to 60
  $^{\circ }$C and droplet volumes ranging from 1 to
  $3\,\mathrm {\mu }$l.
First, we simulate the influence of droplet volume on the internal flow pattern for different volumes of 1, 2 and  $3\,\mathrm {\mu }$l, evaporating on a 40
  $^{\circ }$C substrate and the results of the internal flow pattern and velocity distribution are shown in figure 7 for contact angles of (a) 110
 $^{\circ }$, (b) 140
 $^{\circ }$ and (c) 160
 $^{\circ }$. The background shading indicates whether the flow pattern is axisymmetric (orange background) vs non-axisymmetric (blue background). Based on the simulation results, variations in droplet volume within the investigated range have negligible impact on the internal flow pattern of droplets with contact angles of 110
 $^{\circ }$ and 160
 $^{\circ }$. An axisymmetric toroidal vortex flow pattern appears in the droplet when for a contact angle of 110
 $^{\circ }$ (figure 7a), whereas there is a non-axisymmetric single vortex flow pattern at a contact angle of 160
 $^{\circ }$ (figure 7b). These findings are in concurrence with experimental results for the same variations (Dash et al. Reference Dash, Chandramohan, Weibel and Garimella2014). For the droplet with a contact angle of 140
 $^{\circ }$, as the droplet volume increases, the flow pattern transitions from an axisymmetric toroidal vortex at a volume of
  $1\,\mathrm {\mu }$l to the non-axisymmetric single vortex at
  $2\,\mathrm {\mu }$l. These observations indicate that the internal flow dynamics and transition to the non-axisymmetric flow pattern depend on both the droplet volume and contact angle of the evaporating sessile droplet.

Figure 7. Velocity distribution inside a droplet (sectional view of  $x$–
$x$– $y$ plane) with different volumes ranging from 1 to
  $3\,\mathrm {\mu }$l evaporating on 40
  $^{\circ }$C substrate when the droplet contact angle is (a) 110
 $^{\circ }$, (b) 140
 $^{\circ }$ and (c) 160
 $^{\circ }$.
Additional simulations are likewise carried out at three different substrate temperatures of 30  $^{\circ }$C, 40
  $^{\circ }$C and 60
  $^{\circ }$C for a fixed droplet volume of
  $1\,\mathrm {\mu }$l, with the results shown similarly in figure 8 for contact angles of (a) 110
 $^{\circ }$, (b) 140
 $^{\circ }$ and (c) 160
 $^{\circ }$. The simulation results exhibit a consistent trend with respect to the effect of the contact angle and substrate temperature on the flow patterns. Specifically, the droplet with contact angle of 110
 $^{\circ }$ presents an axisymmetric toroidal vortex flow pattern for all substrate temperatures, and for the higher contact angles of 140
 $^{\circ }$ and 160
 $^{\circ }$, the flow pattern undergoes a transition from axisymmetric toroidal vortex flow to non-axisymmetric single vortex flow as the substrate temperature is elevated. In addition, compared with droplets with a contact angle of 140
 $^{\circ }$, droplets with the higher contact angle of 160
 $^{\circ }$ exhibit a tendency for transition at lower substrate temperature.

Figure 8. Velocity distribution inside a droplet (sectional view of x-y plane) of  $1\,\mathrm {\mu }$l volumes under different substrate temperatures ranging from 30
  $^{\circ }$C to 60
  $^{\circ }$C when the droplet contact angle is (a) 110
 $^{\circ }$, (b) 140
 $^{\circ }$ and (c) 160
 $^{\circ }$.
Based on the results presented in figures 7 and 8, it can be generally concluded that the flow pattern within the droplet tends to transition from axisymmetric toroidal vortex flow towards a non-axisymmetric single vortex flow as the droplet volume increases, the contact angle increases or the substrate temperature increases. In the axisymmetric toroidal vortex flow, the highest flow velocity occurs at the internal region of the droplet, vs at the droplet surface for non-axisymmetric single vortex flow due to their distinct flow structures. Moreover, the velocity of the axisymmetric flow pattern is notably lower.
To further investigate the internal flow characteristics of droplets, figure 9 depicts the variation of flow velocity along the droplet axis under the different contact angles, substrate temperatures and droplet volumes. When the evaporating droplet has an axisymmetric toroidal vortex flow pattern, moving upward along the central axis from the bottom of the droplet, the flow velocity is characterized by an initial increase, reaching the absolute maximum at an intermediate height, followed by a subsequent decrease to the apex. The maximum velocity occurs at a constant dimensionless height for a given contact angle, as reported in table 2 and labelled with horizontal dashed lines in figure 9. On the other hand, when the evaporating droplet exhibits the non-axisymmetric single vortex flow pattern, the flow velocity moving upward along the central axis is characterized by a non-monotonic behaviour. This is because the central axis intersects the vortex structure, resulting in a velocity trend that initially increases, then decreases and ultimately increases again to reach its maximum value at the apex. It is pertinent to note that the velocity does not reach zero at any intermediate height, indicating that the centre of a single vortex is not strictly located on the central axis of the droplet.

Figure 9. Velocity distribution along the droplet vertical axis of symmetry under different substrate temperatures, droplet volumes and contact angles. The droplet with different volumes evaporating on a 40  $^{\circ }$C substrate is shown for contact angles of (a) 110
 $^{\circ }$, (c) 140
 $^{\circ }$ and (e) 160
 $^{\circ }$. The droplet evaporating under different substrate temperatures at a 1
  ${\rm \mu}$l volume is shown for contact angles of (b) 110
 $^{\circ }$, (d) 140
 $^{\circ }$ and ( f) 160
 $^{\circ }$.
Table 2. Dimensionless height of vortex centre and location of maximum velocity (*the non-axisymmetric single vortex flow pattern is not observed in the evaporating droplet with a contact angle of 110 $^{\circ }$).

Further inspection reveals that, for axisymmetric toroidal vortex flow, the centre of the counter-rotating vortex pair viewing a cut symmetric plane remains at a constant dimensionless height for the same contact angle across all cases considered, including varying substrate temperatures (ranging from 30  $^{\circ }$C to 60
  $^{\circ }$C) and volumes (ranging from 1 to
  $3\,\mathrm {\mu }$l). Likewise, for the non-axisymmetric single vortex flow, the centre of the single vortex on the symmetry plane also remains at a constant dimensionless height, given a constant contact angle. Table 2 presents the dimensionless height
  $y^*$ of the centre for both the counter-rotating vortex pair and single vortex at varying contact angles, where the dimensionless height
  $y^*$ is obtained through normalization by the droplet height h and can be calculated as
  $y^* = y/h$. In the axisymmetric toroidal vortex flow, the dimensionless height
  $y^*$ of the vortex centre tends to decrease with an increase in the contact angle, while the opposite trend is exhibited in the case of non-axisymmetric single vortex flow.
Changes in the droplet volume, contact angle and substrate temperature not only influence the internal flow of the droplet, but thereby also lead to corresponding variations in other evaporation characteristics, such as temperature distribution and evaporation rate along the droplet surface, further inspected below in figures 10 and 11, respectively.

Figure 10. Temperature profiles along the mappings from x and z axes to droplet surface under different parameters. The droplet with different volumes evaporating on a 40  $^{\circ }$C substrate is shown for contact angles of (a) 110
 $^{\circ }$, (c) 140
 $^{\circ }$ and (e) 160
 $^{\circ }$. The droplet evaporating under different substrate temperatures at a 1
  ${\rm \mu}$l volume is shown for contact angles of (b) 110
 $^{\circ }$, (d) 140
 $^{\circ }$ and ( f) 160
 $^{\circ }$.

Figure 11. Local evaporation flux along the mappings from x and z axes to droplet surface under different parameters. The droplet with different volumes evaporating on a 40  $^{\circ }$C substrate is shown for contact angles of (a) 110
 $^{\circ }$, (c) 140
 $^{\circ }$ and (e) 160
 $^{\circ }$. The droplet evaporating under different substrate temperatures at a 1
  ${\rm \mu}$l volume is shown for contact angles of (b) 110
 $^{\circ }$, (d) 140
 $^{\circ }$ and ( f) 160
 $^{\circ }$.
Figure 10 shows the temperature profiles along the droplet surface with varying droplet volume, contact angle and substrate temperature. When the internal flow of droplet is an axisymmetric toroidal vortex flow, the temperature variation along the droplet surface is the same in the  $x$–
$x$– $y$ and
  $z$–
$z$– $y$ planes, indicating symmetry about the y-axis. The maximum temperature is observed at the contact line and minimum temperature at the droplet apex. And the temperature difference between the contact line and the apex of the droplet increases with droplet volume, contact angle and substrate temperature. In the case of a non-axisymmetric single vortex flow, the temperature variation along the droplet surface is no longer symmetric about the y-axis. Additionally, the location of minimum temperature shifts along the droplet surface away from the apex to a downstream region, specifically in the negative x direction. And the location of minimum temperature shifts further away from droplet apex with increasing droplet volume and substrate temperature. This is attributed to the increase in the internal flow velocity with increases in the droplet volume or the substrate temperature, as reported in figure 9 above.
Figure 11 shows the local evaporation flux along the droplet surface with varying droplet volume, contact angle and substrate temperature. Increasing the droplet volume or raising the substrate temperature results in an augmentation of the local evaporation flux at the droplet surface. When the internal flow of the droplet is axisymmetric, the distribution of evaporation rates on the droplet surface exhibits axisymmetric characteristics as well. Conversely, axisymmetric internal flow leads to an axisymmetric distribution of evaporation flux as, depicted in figure 11. Moreover, the maximum local evaporation flux occurs at the contact line of the droplet, significantly surpassing the evaporation flux observed in other regions of the droplet surface.
5.3. Mechanistic analysis of the flow instability causing transition to a non-axisymmetric single vortex
In the previous sections, two distinct flow patterns were introduced. The axisymmetric toroidal vortex flow pattern is prone to transition into the non-axisymmetric single vortex flow pattern with increased droplet contact angle, droplet volume and substrate temperature. The transition of the flow pattern inside the evaporating droplets is analysed here as a type of flow instability.
In this section, a three-dimensional transient numerical model is established to analyse the causes of flow instability and explore the details of heat and mass transfer during the transition processes. Similar to the steady numerical model, the transient numerical model also considers the physical process such as evaporative cooling, vapour diffusion, heat conduction and natural convection during droplet evaporation.
The transient continuity, momentum and energy conservation equation in the gas and liquid domains can be expressed as follows: continuity equation
 \begin{equation} \frac{\partial \rho }{\partial t}+\boldsymbol{\nabla}\boldsymbol{\cdot}(\rho \boldsymbol{u})={{S}_{m}}, \end{equation}
momentum equation
 \begin{equation} \frac{\partial (\rho \boldsymbol{u})}{\partial t}+\boldsymbol{\nabla}\boldsymbol{\cdot} (\rho \boldsymbol{uu})={-}\boldsymbol{\nabla} p-\frac{2}{3}\boldsymbol{\nabla} (\mu \boldsymbol{\nabla} \boldsymbol{u})+\boldsymbol{\nabla}\boldsymbol{\cdot} (2\mu S)+\rho \boldsymbol{g}, \end{equation}
energy equation
 \begin{equation} \frac{\partial (\rho {{c}_{p}}T)}{\partial t}+\boldsymbol{\nabla} \boldsymbol{\cdot} (\rho {{c}_{p}}\boldsymbol{u}T)- \boldsymbol{\nabla}\boldsymbol{\cdot} (\lambda \boldsymbol{\nabla} T)={{S}_{h}}, \end{equation}
where t denotes time, and the physical quantities represented by other symbols in the formula are consistent with the expressions given in § 3.1.
In the transient simulation, the time step is dynamically adjusted in the range of  $2.5\times 10^{-4}$ to
  $1\times 10^{-3}$ s, based on variations in flow velocity at the liquid–gas interface. As the physical time of transient simulation takes approximately ten seconds, compared with the evaporation lifetime of approximately thousand seconds, the variation in droplet volume is approximately 1 %. Therefore, we assumed that the droplet volume remains constant during transient simulation.
The steady simulation results, based on a  $3\,\mathrm {\mu }$l droplet with a contact angle of 140
 $^{\circ }$ evaporating on a 25
  $^{\circ }$C substrate, are utilized as the initial conditions for transient simulation. At
  $t = 0$ s, the axisymmetric toroidal vortex flow pattern is observed inside the droplet and the substrate temperature suddenly changes from 25
  $^{\circ }$C to 35
  $^{\circ }$C simultaneously. Subsequently, the droplet temperature changes accordingly and the internal flow pattern transitions from axisymmetric to non-axisymmetric, as shown in figure 12. The video in the Supplementary Material contains more information about the transition process available at https://doi.org/10.1017/jfm.2024.628.

Figure 12. Transition process of internal flow from axisymmetric to non-axisymmetric: velocity distribution on the  $x$–
$x$– $y$ plane at different times (a) 0.1 s, (b) 5 s, (c) 10 s, (d) 15 s and (e) steady; and contour of temperature distribution on the
  $x$–
$x$– $y$ plane at different times ( f) 0.1 s, (g) 5 s, (h) 10 s, (i) 15 s and ( j) steady.
The onset of the flow transition, which occurs in the internal flow of the sessile droplet, can be analysed by considering a small perturbation and the mechanism by which it is amplified, as depicted in figure 13. We first assume there is a slight perturbation present within the droplet as an internal axisymmetric toroidal flow. In practical scenarios, these small perturbations can arise due to various factors, such as a slightly non-uniform distribution of temperature on the substrate; the flow field is subject to the same perturbations in numerical simulations, consider the residual generated during each iteration of the solution process. As displayed in figure 13(b), the effect of the perturbation on the internal flow is as follows.

Figure 13. The onset of the flow transition: (a) illustration of the mechanism by which a small perturbation to the axisymmetric flow pattern is amplified (sectional view of  $x$–
$x$– $y$ plane); (b) logic diagram for describing the effect of disturbance on the internal flow.
(i) The perturbation will induce a subtle difference in the intensity of the vortices present on each side of the axis as viewed in a cross-sectional plane; for discussion, it is posited in the current analysis that the intensity of the vortex on the left-hand side of the central axis is greater than that on the right-hand side, as shown in figure 13(a).
(ii) When the vortices located on both sides of the droplet axis flow radially inward along the bottom of the droplet, the horizontal velocity of vortices on opposite sides cannot be completely offset due to the higher velocity of the vortex on the left-hand side of the central axis. After convergence, the vortex situated on the left-hand side maintains a discernible horizontal velocity. As a result, the streamline, which originally moves vertically upwards along the central axis, deviates slightly to the right.
(iii) When the streamlines near the droplet axis deviate to the right, there is a direct impact on the left and right vortex domains. Specifically, the left vortex domain will expand, while the right vortex domain will contract correspondingly.
(iv) As illustrated in figure 13(a), the flow domain that has been expanded by the left vortex will bring more low-temperature fluid toward the apex; as a consequence, the fluid temperature contained within the left vortex is comparatively lower in the upper region of the droplet.
(v) The downward flow on the droplet surface is driven by the density difference between the top and bottom of the droplet, which is proportional to the temperature difference. The droplet bottom is maintained at a constant temperature, while the fluid within the left vortex is cooler in the upper region of the droplet surface, leading to a larger temperature difference and a stronger driving force. Consequently, the velocity of the left vortex is further enhanced, establishing a potential positive feedback loop if there are no other counteracting factors.
Specifically, there are two counteracting factors. The liquid viscosity tends to equilibrate the velocity of vortices on opposite sides of the droplet axis by inducing greater drag on the relatively faster vortex located on the left side. Additionally, thermal diffusion acts to reduce the temperature difference across the droplet, specifically between  $T_{1}$ and
  $T_{2}$ on either side of the droplet as labelled in figure 13(a).
The internal flow of the sessile droplet can therefore be considered as being subjected to a driving force (buoyancy force) and two stabilizing factors (thermal diffusion and liquid viscosity) (Chong et al. Reference Chong, Yang, Huang, Zhong, Stevens, Verzicco, Lohse and Xia2017). When the strength of the former positive feedback effect related with the buoyancy force surpasses that of the stabilizing thermal diffusion and liquid viscosity effects, we propose an instability arises in the internal flow of droplet and the axisymmetric toroidal flow transforms into non-axisymmetric single vortex flow. This balance is well characterized by the Rayleigh number (Ra) expressed as
 \begin{equation} Ra=\frac{\rho g\beta }{\alpha \mu }\Delta T{{L}^{3}}, \end{equation}
in which,  $\rho$,
  $g$,
$g$,  $\beta$,
  $\alpha$ and
  $\mu$ denote the fluid density, acceleration due to gravity, thermal expansion coefficient, thermal diffusion coefficient and dynamic viscosity, respectively. Here,
  $\Delta T$ is the maximum temperature drop on the droplet surface, and L represents the characteristic length, defined here as the height of the droplet.
The Rayleigh number, which characterizes the strength of natural convection inside a liquid droplet due to thermal buoyancy, is proportional to the volume of the droplet and the temperature difference across the droplet height, wherein this temperature difference is directly correlated with the substrate temperature. Moreover, as the contact angle increases for a given droplet volume, the contact surface area between the droplet and the heated substrate decreases, while the surface area and height of the droplet increase; the net effect of these changes with increasing contact angle ultimately leads to an increase in the heat transfer resistance from the bottom of the droplet to its surface and an intensified evaporative cooling effect, causing a reduction in the surface temperature and an enlargement in the temperature difference between the surface and bottom of the droplet. Increasing the droplet volume, the substrate temperature or the contact angle, which leads to an increase in Ra; these are the same factors that were observed to cause a transition in the internal flow pattern in § 5.2 (figures 7 and 8). We therefore postulate that there is a critical Ra value above which the onset of the flow pattern transition will be triggered.
5.4. Critical Rayleigh number (Ra) for the flow pattern transition
In the current section, the correlation between the critical Ra and droplet volume, substrate temperature, as well as contact angle will be investigated, and the impacting mechanism will be analysed by considering the alterations in boundary conditions resulting from the changes in the contact angle.
To investigate the dependence of the critical Ra on the droplet volume, substrate temperature and contact angle, the critical Ra values are obtained for the droplets with different contact angles and volumes. In each case, the temperature of the substrate was increased step by step in increments. Once the Ra value exceeds the critical threshold, the non-axisymmetric single vortex flow is observed in the droplet, at which point the corresponding temperatures of the droplet surface and substrate are recorded. The critical Ra value corresponding to the transition temperature was then calculated following (5.4).
Figure 14 presents the variation of Ra with respect to the Biot number (Bi) with different contact angles and different volumes. The Biot number is a dimensionless parameter used to quantify the evaporation rate of droplets defined as follows (see reference Pan & Wang (Reference Pan and Wang2013) for the detailed derivation process):
 \begin{equation} Bi=\frac{{{h}_{fg}}L}{\lambda }\frac{{\rm d}{m}''}{{\rm d} T}, \end{equation}
in which  $h_{fg}$ and
  $\lambda$ denote the latent heat of vaporization and thermal conductivity, respectively,
  $T$ is the substrate temperature,
  $m''$ is the evaporation flux and L represents the characteristic length, defined as the height of the droplet.

Figure 14. Rayleigh number as a function of Biot number. The droplet at a  $3\,\mathrm {\mu }$l volume is shown for contact angle of (a) 110
 $^{\circ }$ under different substrate temperatures ranging from 21
  $^{\circ }$C to 60
  $^{\circ }$C, (b) 140
 $^{\circ }$ under substrate temperatures ranging from 21
  $^{\circ }$C to 40
  $^{\circ }$C and (c) 160
 $^{\circ }$ under substrate temperatures ranging from 15
  $^{\circ }$C to 31
  $^{\circ }$C. The droplet with a contact angle of 140
 $^{\circ }$ is shown for volume of (d)
  $1\,{{\rm \mu} }$l under substrate temperatures ranging from 40
  $^{\circ }$C to 60
  $^{\circ }$C, (e) 2
  ${\rm \mu}$l under substrate temperatures ranging from 30
  $^{\circ }$C to 45
  $^{\circ }$C and ( f)
  $3\,\mathrm {\mu }$l under substrate temperatures ranging from 21
  $^{\circ }$C to 40
  $^{\circ }$C.
As depicted in figure 14, droplets with the same contact angle exhibit similar critical Ra, whereas droplets with different contact angles show significantly different critical Ra. Specifically, the critical Ra value will decrease with the increase of droplet contact angle. For a contact angle of 160 $^{\circ }$, the critical Ra is found to be
  $\sim$514, whereas, for a reduced contact angle of 140
 $^{\circ }$, the critical Ra increases to
  $\sim$645. Notably, even though Ra increased to
  $\sim$945, the flow transition did not occur inside the droplet with a contact angle of 110
 $^{\circ }$, indicating that Rayleigh instability may not occur inside the droplet with a contact angle of 110
 $^{\circ }$.
Generally, the critical non-dimensional parameter that characterizes the transition of flow patterns depends on boundary conditions. Specifically, the critical Ra, which signifies the onset of the instability within the internal flow of the droplet, remains constant only under geometrically similar conditions. Once the droplet shape changes due to the contact angle, geometric similarity is lost, and the critical value will change.
Here, we analyse how the contact angle affects the critical Ra value and attribute the effect to the differential viscous resistance on the contact surface experienced by droplets with different contact angles. To compare the viscous resistance on the contact surface, cases where the substrate temperature and droplet volume are adjusted to ensure that droplets with different contact angles have an equal Ra value (309), which is below the critical Ra value for all droplets mentioned above. The velocity magnitude and x-direction velocity component for these different contact angle cases are depicted in figure 15(a). Figures 15(b) and 15(c) illustrate the radial distribution of the shear stress and the friction force in the unit ring on the contact surface of droplets under the same Ra value. The total friction force generated on the contact surface is represented by the area beneath the curve depicting the radial variation of friction force within the unit ring. It is evident that the friction force generated by the droplet's contact surface exhibits a significant increase as the contact angle decreases while maintaining the same Ra value.

Figure 15. (a) Contour maps of the velocity magnitude and x-direction velocity component. (b) Plot of the radial distribution of the shear stress on the contact surface of droplets having the same Ra value and (c) plot of the radial distribution of the friction force in the unit ring on the contact surface of droplets. All figures are shown for three different contact angles of 110 $^{\circ }$, 140
 $^{\circ }$ and 160
 $^{\circ }$ at the same Ra of 309.
According to the analysis in § 5.3, when the positive feedback effect related to the driving force (buoyancy) within the droplet exceeds the influence of thermal diffusion and viscous resistance, an instability arises in the internal flow of the droplet. Under equal Ra conditions, as the contact angle decreases, the viscous resistance on the contact surface significantly increases, thereby enhancing its ability to suppress the occurrence of flow instability and maintain a stable internal flow region within the droplet. Hence, a smaller contact angle means a more stable internal flow and leads to a higher critical Ra value.
In order to further confirm the effect of the droplet shape on the critical Ra value, a test is carried out by performing a simulation where the shear stress on the contact surface between the droplet and the substrate is fictitiously removed, shown in figure 16. For the conditions shown, the droplet would normally exhibit an axisymmetric toroidal vortex flow as in figure 16(a); when the shear stress at the contact surface is eliminated, the internal flow pattern of the droplet transitions to a non-axisymmetric single vortex flow as in figure 16(b). This results in a significant increase in the internal flow velocity of the droplet, leading to an elevated droplet surface temperature and an increased Ra. This observation indicates that the elimination of shear stress at the contact surface leads to a decrease in the critical Ra for a droplet with a contact angle of 140 $^{\circ }$, reducing it to a value below 437. In contrast, under normal conditions, the critical Ra was determined to be 645.

Figure 16. Contour maps of temperature and velocity inside a  $3\,\mathrm {\mu }$l water droplet with a contact angle of 140
 $^{\circ }$ evaporating on 30
  $^{\circ }$C substrate: (a) normal boundary conditions result in an axisymmetric toroidal vortex; (b) fictitiously eliminating the shear stress on the contact surface results in a non-axisymmetric single vortex.
Additionally, influenced by the angular momentum conservation and the inherent viscosity of the fluid, vortices tend to follow circular flow patterns (Wang et al. Reference Wang, Verzicco, Lohse and Shishkina2020, Reference Wang, Jiang, Liu, Zhu and Sun2021). Within droplet evaporating on the superhydrophobic substrate, the single vortex flow pattern aligns more closely with this tendency compared with the toroidal vortex flow pattern. Therefore, the alteration of the geometric shape of the droplet induced by the change in contact angle also serves as a contributing factor to the influence on internal convection.
5.5. Heat transfer efficiency inside the evaporating sessile droplet
In the previous sections, we introduced two flow patterns inside the evaporating sessile droplet and analysed the transition process of internal flow from axisymmetric to non-axisymmetric. In this section, we postulate why the flow inside the droplet tends to a non-axisymmetric flow pattern under some conditions from an energy minimization perspective, through an analysis of the heat transfer rate inside the droplet.
Under the action of the thermal buoyancy-driven flow, heat transfer occurs inside the droplet between the substrate and the evaporating liquid–gas interface. This convective heat transfer can be characterized by the dimensionless Nusselt number (Nu), as an indicator of the heat transfer coefficient
 \begin{equation} Nu=\frac{Qh}{{{A}_{c}}\Delta {{T}_{ave}}\lambda }, \end{equation}
in which  $\lambda$ denotes the thermal conductivity,
  $A_{c}$ is the area of contact surface area,
  $\Delta T_{ave}$ is the average temperature on the droplet surface, Q is the heat transfer from the droplet contact surface to the droplet surface and h represents the characteristic length defined as the height of the droplet.
The correlation between Nu with Ra indicates a positive relationship, as illustrated in figure 17. This is because an increase of buoyancy within the droplet leads to a higher internal flow intensity, which in turn results in enhanced heat transfer efficiency from the heated substrate to the droplet surface.

Figure 17. Nusselt number as a function of Rayleigh number for a  $3\,\mathrm {\mu }$l droplet with the contact angle of (a) 110
 $^{\circ }$ under different substrate temperatures ranging from 21
  $^{\circ }$C to 60
  $^{\circ }$C, (b) 140
 $^{\circ }$ under substrate temperatures ranging from 21
  $^{\circ }$C to 40
  $^{\circ }$C and (c) 160
 $^{\circ }$ under substrate temperatures ranging from 15
  $^{\circ }$C to 31
  $^{\circ }$C.
In addition to the gravitational potential energy inside the droplet, other forms of potential energy are constant during the evaporation process. Therefore, according to the minimization of total potential energy, internal convection tends to minimize the total gravitational potential energy of all fluids inside the droplet. Selecting the droplet contact surface as the datum plane ( $z = 0$), we can use the following formula to calculate the gravitational potential energy of the droplet:
 \begin{equation} \int_{V}{(\rho gz)\,{\rm d}}V, \end{equation}
where g and  $\rho$ denote gravitational acceleration and density, respectively. According to (5.7), the total gravitational potential energy of the droplet is solely determined by the spatial distribution of liquid density, which is inversely related to temperature. The temperature at the droplet bottom can be approximately equal to the substrate temperature and the temperature at the droplet surface is determined by the evaporative cooling effect and heat transfer rate from the bottom to surface inside the droplet.
The influence of the internal flow pattern on the total gravitational potential energy of the droplet is reflected in the convective heat transfer rate. The higher the convection heat transfer efficiency, the higher the temperature of the droplet surface, and the lower the total gravitational potential energy within the droplet.
It is worth noting that, when the flow transition occurs, there is a significant increase observed in Nu, as shown in figure 17. This means that the transition of the internal flow pattern from axisymmetric to non-axisymmetric leads to a sudden increase in convective heat transfer rate and a sudden decrease in total gravitational potential energy. Therefore, the transition of internal flow patterns in droplets can be regarded as a specific manifestation of the principle of minimum total potential energy in the droplet systems.
6. Conclusion
The present study investigates the buoyancy-driven flow inside an evaporating sessile water droplet on non-wetting substrates. Numerical simulations are performed for a range of substrate temperatures, droplet volumes and contact angles. The simulation results indicate that, with an increase in each of these factors, there is a transition in the internal flow pattern of the droplet from an axisymmetric toroidal vortex flow to a non-axisymmetric single vortex flow. The change in the droplet evaporation characteristics, such as temperature and evaporation rate, associated with each of these unique flow structures have been analysed.
The transition of the internal flow pattern can be attributed to a flow instability inside droplet, and the onset of the flow transition is analysed by considering the amplification of a small perturbation to the axisymmetric flow structure. This analysis concludes that when the positive feedback effect related to the driving force (buoyancy) within the droplet exceeds the influence of thermal diffusion and viscous resistance, that is, when the Rayleigh number (Ra) exceeds the critical value, the flow instability will occur inside the droplet. Moreover, the Ra value exhibits direct proportionality to substrate temperature, droplet volume and contact angle. Consequently, when there is an increase in any of these parameters, the internal flow of droplet is more likely to undergo this transition due to the flow instability.
Then, the influencing factors of the critical Ra, which signifies the onset of the instability, were discussed. Our findings reveal that the critical Ra value is only influenced by the contact angle and is independent of droplet volume and substrate temperature. This effect can be attributed to the fact that droplets with different contact angles experience different viscous resistance on the contact surface.
Finally, the heat transfer efficiency within the droplets has also been examined under two distinct flow patterns. Results indicate that the transition to the non-axisymmetric single vortex flow exhibits an increase in the heat transfer efficiency between the bottom and surface of the droplet when compared with the axisymmetric toroidal vortex flow, as well as a change in the correlation of the dimensionless Nusselt number (Nu) with the Rayleigh number. This explains why the flow inside the droplet tends to a non-axisymmetric flow pattern under some conditions from an energy minimization perspective.
Supplementary movie
Supplementary movie is available at https://doi.org/10.1017/jfm.2024.628.
Funding
This research received no specific grant from any funding agency, commercial or not-for-profit sectors.
Declaration of interests
The authors report no conflict of interest.


