INTRODUCTION
Cervical cancer is the most serious disease associated with human papillomavirus (HPV) infection [Reference Bosch1] and is an important public health problem. Following impressive advances in molecular biology, in 2006 a vaccine (Gardasil®; Sanofi-Pasteur MSD, Lyon, France) against HPV infections was granted licensing authorization by the European Medicines Agency (EMEA), and another vaccine (Cervarix®; GlaxoSmithKline; Brentford, UK) has recently been authorized.
Some European countries have decided to include these HPV vaccines in their national immunization schedules. In Italy this vaccination will be offered free of charge to 12-year-old females from 2008 onwards.
In Italy, implementation of this vaccination campaign from 2008 onwards is the subject of lively debate. Because financing for prevention is limited, mathematical and economic models play an important role in identifying the best policies. While some authors have conducted cost-effectiveness studies and drawn up mathematical models [Reference Dasbash, Elbasha and Insinua2], only a few have considered a multi-cohort approach.
Models calculating ICER (incremental cost-effectiveness ratio) on HPV vaccination are described in the literature [Reference Elbasha, Dasbach and Insigna3]. Most of these, usually referred to as Markov models [Reference Beck and Pauker4], concern one cohort of vaccinated subjects and are typically static, probabilistic and linear. Dynamic [Reference Elbasha and Galvani5] and hybrid models have also been created.
The aim of the present study was to compare several different hypotheses of multi-cohort vaccination. The outcome we chose was that of ‘avoidable infections’. This surrogate endpoint was selected on the basis of its feasibility, and its relative evaluation constitutes a preliminary stage in constructing a full projection of the consequences of a multi-cohort vaccination strategy.
METHODS
Rationale
Although natural immunity against HPV viruses is not yet fully understood, we assumed that infection confers a protective immunological defence. Our study was designed to combine natural immunity with the immunity elicited by vaccination. The goal was to identify the best HPV vaccination policy in order to choose the best way of allocating resources. Several strategies were compared to find the best multi-cohort target for vaccination through a suitable comparison.
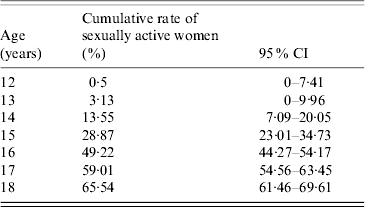
In order to calculate the outcome, we used the results of our study on the sexual habits of Ligurian (North Italy) women (Table 1) [written communication: R. Gasparini Epidemiology of sexual habits in Ligurian women: preliminary results. Conference: New Perspectives of vaccination. Genoa, 8 May 2007].
Table 1. Cumulative percentages of sexually active females in Liguria
CI, Confidence interval.
The results yielded an estimate of HPV infections by high-risk genotypes which could be potentially prevented by vaccinating females aged 12–18 years (from 69·65% at 12 years to 24·05% at 18 years). The study took into account the age at first intercourse, the risk of HPV (oncogenic genotypes) infection and natural clearance of the virus [Reference Plummer6].
Population
On the basis of data from the Italian Statistical Institute [7], seven cohorts of females aged from 12 to 18 years were considered in the different vaccination strategies; for only one hypothesis was a cohort of 25-year-old females considered. The female population aged 12–18 years in Italy has varied very little in recent years. Because of the very small variation in numbers among the different age groups from 12 to 18 years, a mean number of 281 000 subjects per cohort was considered. The number of 25-year-olds was 330 000.
Decisional tree
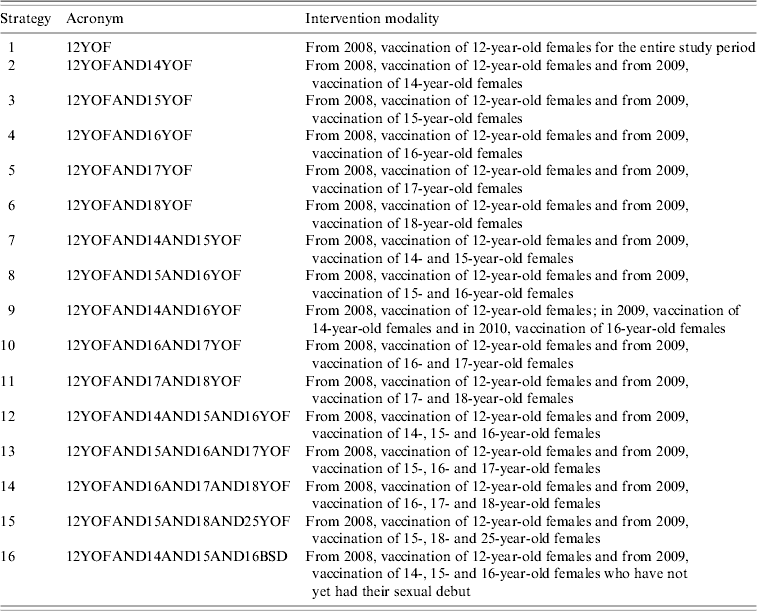
On the basis of the concept that the goal was to add vaccine immunity to natural immunity, and considering that almost 65% of females in Liguria are already sexually active by the age of 18 years (Table 1), the decisional tree illustrated in Figure 1 was constructed. The 16 different vaccination strategies are reported in the decisional tree and in Table 2.
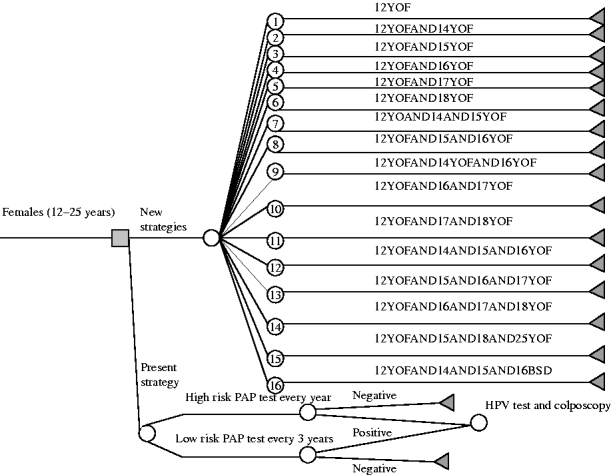
Fig. 1. Decisional tree for the choice of the human papillomavirus (HPV) vaccination strategy.
Table 2. Number of cohort and age on vaccination by different strategies
Model
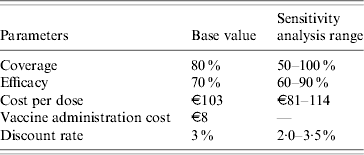
Parameters associated with the model in the basic case and in the sensitivity analysis range are illustrated in Table 3.
Table 3. Parameters associated with the model in the basic case and in the sensitivity analysis range
The model takes into account:
(a) After their sexual debut, the proportion of susceptible females who acquire HPV infection is determined by the force of infection. Currently, we cannot estimate the force of infection because many factors influence acquisition of the infection. Variable rates of acquisition of at least one high-risk genotype are known to correlate with time of first intercourse [Reference Winer8]. We resorted to a very simple ‘worst case’ scenario (acquisition of the infection after 1 year), by postulating that: (i) almost all women experience infection by at least one HPV genotype 1–4 years after the beginning of sexual activity, and (ii) most infections are by high-risk genotypes [Reference Winer9, Reference Brown10]. Obviously, if acquisition of the first HPV infection occurred, for instance, in 2 or 4 years, the costs of avoidable infection would be doubled or quadrupled, respectively. In this manner, the age distribution of the onset of sexual activity is, under stationary circumstances, all that is needed to obtain a rough estimate of the incidence of infection by age in the range of interest (from 12 to 25 years). If B(x−1, x) denotes the fraction of women acquiring HPV infection, with an average interval of i years (here we take i=1) from the beginning of sexual activity, we have:
where Px=cumulative percentage of females with sexual debut before age x (Px−1=cumulative percentage of females with sexual debut before age x−1).
(b) Vaccination is assumed to prevent 70% of the infections caused by high-risk genotypes (which lead to cervical cancer) [Reference Sharma and Sharma11]. By assuming a coverage rate of 100%, with a vaccine efficacy of 100%, the expected proportion of B(x−1, x) infections in women aged (x−1, x) potentially avoidable by vaccination is then:
where E denotes the vaccine efficacy, and CR the coverage rate. In the special case E=CR=100% then:
The overall cost of the vaccination campaign (Cs) for the s-th strategy was evaluated as:
where DC=cost per dose, DR=discount rate, Ns=281 000∗ls is the total number of women eligible for vaccination in the s-th strategy, and ls is the number of cohorts involved in the s-th strategy (for the 25-year-old cohort the number of eligible females is 330 000).
The model was created under these conditions:
(1) The vaccination campaign was set to start in January 2008.
(2) The period of simulation was from 2008 to 2011. A short period was chosen so that the endpoint of the study would be verifiable in the short term. The choice of avoided infections as the outcome was intended as the first stage in a broader study, in which the medium- and long-term impact of different policies would be assessed in terms of the prevention of ASCUS (atypical squamous cells of undetermined significance), CIN1 (cervical intraepithelial neoplasia), CIN2, CIN3, genital warts and avoided deaths. Another reason for the choice was that the clinical trials performed up to now have shown that HPV antibodies persist for 5·5 years. In other words, we are reasonably sure that protection would be for 5·5 years at the current maximum.
(3) The vaccination of 12-year-old girls from 2008 onwards was always envisioned.
(4) The vaccination of other cohorts was envisioned, according to the strategy chosen, from 2009 onwards.
(5) Regarding compliance, it was hypothesized that 80% of females would accept the entire cycle of vaccination. This hypothesis came from the recent experience of vaccination against Streptococcus pneumoniae in Liguria: after 1 year, an average of 80% of eligible subjects had been vaccinated (data not shown). In the sensitivity analysis, acceptance of vaccination ranged from 50% to 100% (the lower limit was chosen on the basis of the sensitivity analysis conducted by Garnett et al. [Reference Garnett12] in 2006 and the upper limit taking into account the Italian context, in which we can assume a high compliance with HPV vaccination; indeed, through our quoted surveillance source, we found a very great interest in HPV vaccination among adolescents).
(6) For protection, we considered a protection ratio of 70% (efficacy) with regard to the infections which can lead to cervical cancer [Reference Munoz13], although in the sensitivity analysis we used a range from 60% to 90% efficacy. This interval was chosen in accordance with the hypothesis that the vaccine appears to have cross-protection effects and that this characteristic could enable 90% of cases of cervical cancer to be avoided (90% efficacy) [Reference Pagliusi14, Reference Mao15]; the low limit was fixed on the basis of the efficacy variability reported in several clinical trials [Reference Paavonen16, Reference Joura17]. Furthermore, we considered that every vaccinated woman was protected during the study period; indeed, it is known that the vaccine elicits high titres of antibodies lasting for almost 60 months [Reference Harper18, Reference Villa19].
(7) With regard to the cost of the vaccine, the cost per dose was set at €188 and €154 by the AIFA (Italian Agency of Drug) for Gardasil and Cervarix, respectively. Sanofi-Pasteur MSD (Gardasil) and GlaxoSmithKline (Cervarix) will offer a discount to local health agencies of the Italian regions, setting a maximum price of €114 and €90 for a single dose, respectively. The vaccine schedule involves three doses. For the sensitivity analysis the cost range was set at €81–114 per dose.
(8) The cost of administering the vaccine was fixed at €8 per dose (forfeit) [Reference Sewell, Jacobson and Weniger20, Reference Coudeville21].
(9) The costs related to adverse events due to vaccination are not considered in the present study because our preliminary evaluation of clinical trials indicates a small additional cost of about €0.38 per vaccinated subject (data not shown).
(10) The risk of increased infections in older women was regarded as minimal, because, owing to HPV biology, replacement with non-vaccine oncogenic HPV types (such as genotypes 31 and 45) is improbable [Reference Bosch and de22].
Furthermore, this latter risk is probably reduced by the cross-protection provided by the present vaccines [Reference Sewell, Jacobson and Weniger20]. However, a more complete understanding of the natural history of HPV infection is required [Reference Woodman, Collins and Young23].
(11) To assess the potential avoidable infections, we assumed that the members of the cohorts would be protected as of the year subsequent to the year of completion of the vaccination cycle.
(12) No changes in the present policy of cervical cancer prevention, such as PAP test, colposcopy and HPV test, were assumed.
(13) A discount rate of 3% per annum was considered in the base case. For the sensitivity analysis the range was set at 2·0–3·5%.
(14) We performed the analyses from the perspective of the National Health System.
In the first stage of the analysis 16 policies were evaluated on the basis of the following criteria:
• potentially avoidable infections,
• cost per avoidable infection,
• results of sensitivity analyses.
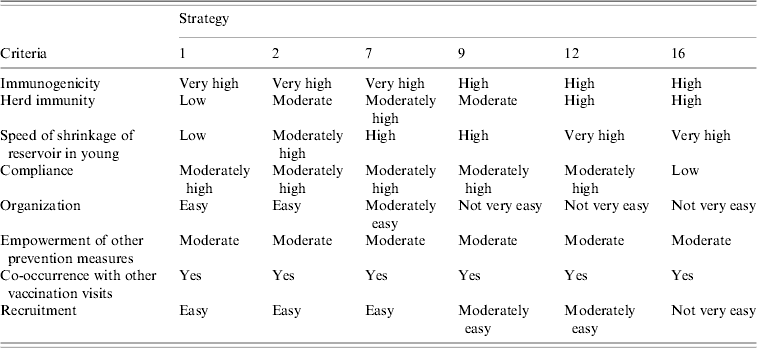
In the second stage of the study, the six best strategies to emerge from stage 1 with a cost of less than €2500 per avoidable infection were further evaluated. The criteria of the second analysis were (Table 4):
• immunogenicity,
• herd immunity,
• speed of decrease of the reservoir in the youngest subjects,
• compliance,
• organization,
• empowerment of other prevention measures (e.g. PAP test, educational programmes, etc.),
• co-occurrence with other vaccination visits,
• recruitment.
Some feasibility criteria (compliance, organization and recruitment) were chosen on the basis of a survey carried out among the workers of the Ligurian Vaccine Services and on the opinion of these subjects.
Table 4. Evaluation of the six best strategies on the basis of the criteria of the second analysis
Statistical analysis
In our model, we performed separate sensitivity analyses on four parameters: coverage rate, efficacy of the vaccine, cost of the vaccine and discount rate.
Sensitivity analyses were performed by replacing the values of the variation interval in the functions of the model. A potential regression was also performed on the sensitivity analyses of both coverage and efficacy. A linear trend was observed for other parameters.
Excel (Microsoft) software was used for statistical analyses.
RESULTS
The percentages of potentially avoidable infections are shown in Figure 2. Policies 12 and 16 would avoid almost 46% of infections in vaccinated subjects, while strategies 1 and 6 would avoid only about 27% of HPV infections. Strategies 2, 3, 10, 14 and 15 would avoid almost 35% of HPV infections.
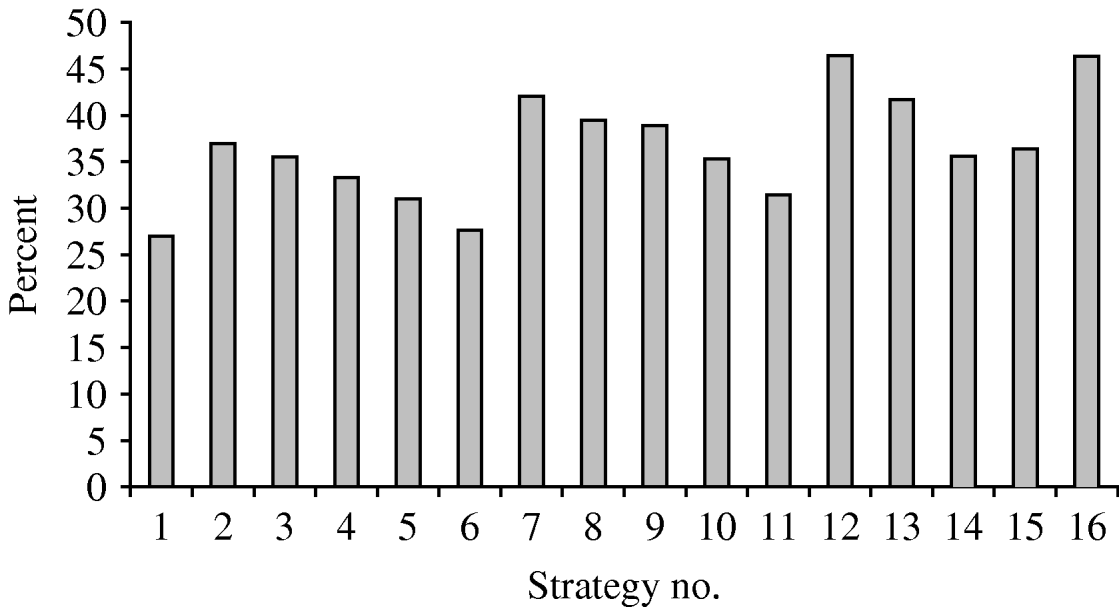
Fig. 2. Percentage of infections potentially avoidable by means of the different strategies.
Figure 3 illustrates the cost per avoidable infection of the different vaccination hypotheses. The cost per avoidable infection is very different for different strategies, varying from €2151 (strategy 16) to €4819 (strategy 15).
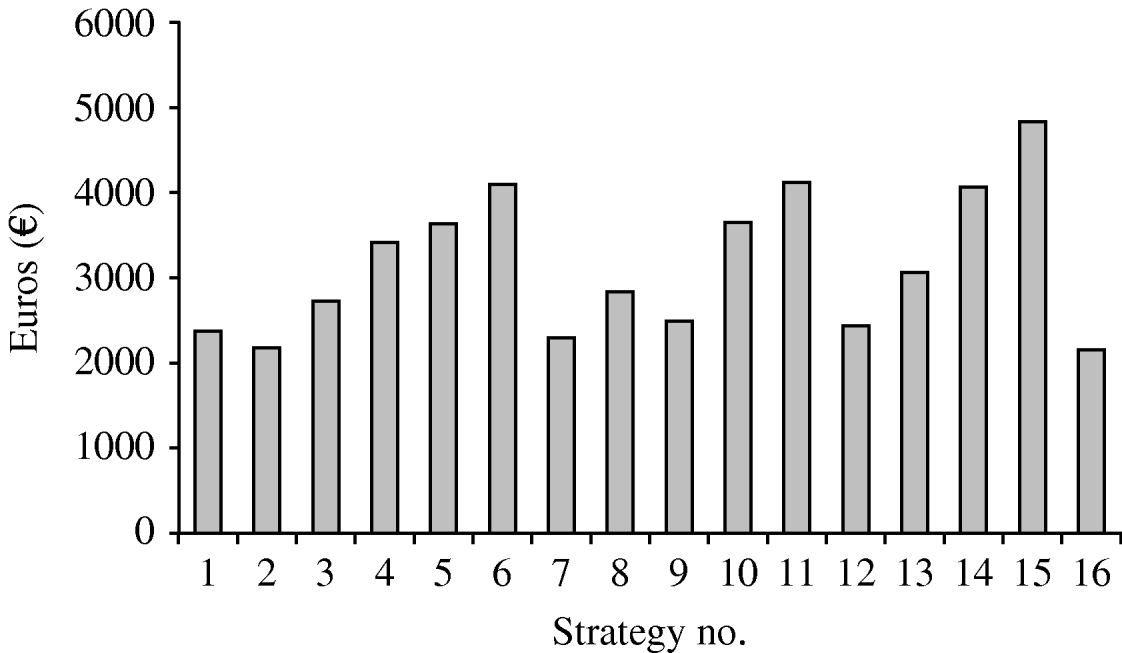
Fig. 3. Cost per infection avoided by the strategies studied.
Figure 4 a shows the variation in cost per avoidable HPV infection on the basis of the variation of the coverage rate. Confirming the result shown in Figure 3, strategy 15 is the most expensive, on considering every coverage rate; the highest cost per avoidable infection is €7711 at 50% coverage. At this coverage rate the costs of strategies 11 and 14 are also high, while those of strategies 2, 7, 9, 12 and 16 are lower. Power function was the best way to represent the sensitivity analysis of the coverage variation. For example, for strategy 1 the function was y=19 063x −1 (R 2=1). For strategy 15 the function was y=385 782x −1 (R 2=1). Finally, for strategy 16, the function was y=172 138x −1 (R 2=1).

Fig. 4. Sensitivity analysis: variation of cost per infection avoided by (a) varying vaccination coverage, (b) varying efficacy of the vaccination, (c) varying the cost per dose of the vaccine, (d) varying the discount rate.
Figure 4 b shows the sensitivity analysis on the basis of the efficacy of HPV vaccination. It can be seen that, for an efficacy of 60%, the increment in the cost per avoidable infection is very high (€5622) for strategy 15 and moderate for strategies 2, 7, 9, 12 and 16.
The smallest variations in cost per avoidable HPV infection on changing the cost of the vaccine dose were seen in strategies 2, 7, 9, 12 and 16 (Fig. 4 c). The results of the sensitivity analysis regarding variations in the discount rate from 2·0% to 3·5% are reported in Figure 4 d.
Subsequently, only strategies 1, 2, 7, 9, 12 and 16, which proved to be the most advantageous after the first evaluation, were considered in the second analysis. Table 4 shows the semi-quantitative assessment of the comparison of these six strategies on the basis of the criteria adopted in the second analysis.
DISCUSSION
A number of studies have been published on the evaluation of the epidemiological and economic impact of HPV vaccination. Elbasha et al. [Reference Elbasha, Dasbach and Insigna3] developed a dynamic model which led to the conclusion that the best strategy, in the US population, was to combine the vaccination of subjects of both sexes before age 12 years, and to implement a catch-up programme between the ages of 12 and 24 years. Barnabas et al. [Reference Barnabas24] estimated, by means of a mathematical modelling analysis, that vaccinating 90% of young women before their sexual debut has the potential to reduce the incidence of HPV type-specific cancer by 91%.
Our results add further information to that obtained by other authors; in a multi-cohort scenario of HPV infection prevention, the following considerations emerge:
• Comparison of the 16 strategies shows that strategies 6, 11, 14 and 15 have a high cost per avoided infection, and that the percentage of infections avoided is highest for strategies 7, 12 and 16.
• Our sensitivity analysis revealed that the increase in cost per avoidable infection depended: on the increase in cost per dose, on the decrease in efficacy of the vaccination and, especially on the reduction in coverage. Sensitivity analysis evidenced the advantage of reaching a high level of vaccination coverage in a short time.
• The sensitivity analysis of the discount rate showed scant importance of this variable, probably because of the shortness of the study period.
The second analysis revealed that:
• Strategy 1 is the starting-point for HPV infection prevention. Indeed, 12-year-old girls are almost never sexually active, and are very good responders to vaccination. Several committees and scientific associations have advised that this group of adolescents should be the first target of vaccination [Reference Markowitz25, Reference Saslow26]. The cost per avoidable infection is reasonable (€2382), but the percentage of potentially avoidable infections is relatively low (about 26%). Therefore, this choice could be appropriate in low-resource settings for the vaccination campaign. However, the infection reservoir in the young would shrink slowly.
• For strategy 2 the percentage of avoidable infections is about 37%; in this case, the cost per avoidable infection is €2180. This strategy appears to be good in terms of both the vaccination response and the ease of recruiting the eligible population.
• Strategy 7 would avoid over 42% of infections. The cost per avoidable infection is similar to that of strategy 2. Moreover, strategy 7 would ensure widespread and relatively more rapid immunization of young people.
• Strategy 9 shows 39% of avoidable infections and a cost per avoidable infection of €2472. This strategy would ensure rapid shrinkage of the infection reservoir in the young, but organization and recruitment would not be very easy.
• Strategy 12 would avoid 46% of infections at a cost per avoidable infection of €2430. This strategy would ensure rapid shrinkage of the infection reservoir in adolescents.
• Strategy 16 shows 46% of avoidable infections and a very low cost per avoidable infection (€2151); this choice would exert a very good action on the infection reservoir and also would confer considerable herd immunity.
All strategies could help to reinforce preventive measures and to favour the sexual education of the young. All strategies foresee at least one administration in co-occurrence with other vaccinations of the Italian calendar of vaccination.
CONCLUSION
The best choice appears to be to vaccinate all 12-year-old girls and those aged 14–16 years who state that they have not yet had their sexual debut (strategy 16). However, since some girls could be reticent about their intimate behaviour, the best choice might be to vaccinate all females aged 14–16 years (strategy 12) [Reference Garland27].
A strategy which includes the vaccination of older women does not appear to be very good; indeed, the results of ‘intention-to-treat’ studies demonstrate a progressive decrease in vaccination efficacy as age increases. This policy could, however, favour the diffusion of screening among Italian women.
While young females are the vaccination target, reasons of equity require improving the availability of screening for older women. It is also very important to communicate to women aged >18 years that the vaccination of young girls constitutes the best allocation of resources, and that this choice indirectly could protect all women. It will be necessary to raise awareness (through education, mass media, counselling, etc.) of the importance of vaccination, the value of undergoing screening within 3 years after sexual debut, and of the fact that HPV vaccination does not protect against other sexually transmitted diseases (STD).
In conclusion, the availability of two HPV vaccines is an epochal moment for at least two important reasons. First, it is the first time that we have had a vaccine to prevent the necessary cause of a cancer. Second, HPV vaccination offers a unique and precious opportunity to improve education regarding STD, especially in Italy, where sex education should be introduced systematically into primary and secondary schools.
DECLARATION OF INTEREST
None.


