Electroencephalograpic (EEG) recordings of electrical brain activity during rest and task conditions have been a prime target to serve as endophenotypes of brain function, cognition, and brain disorder. EEG consists of oscillations that reflect the summation of postsynaptic potentials at the dendritic tree of cortical neurons. These constituent oscillations include alpha oscillations of about 10 Hz that reflect the inactivity of the cortical area producing the rhythm (Niedermeyer, Reference Niedermeyer, Niedermeyer and Lopes1999a). Theta rhythms of 4 Hz to about 6 Hz, represent working memory processing in adults (Gevins et al., Reference Gevins, Smith, McEvoy and Yu1997), but may reflect the relative immaturity of the brain (Niedermeyer, Reference Niedermeyer, Niedermeyer and Lopes1999b; Smit et al., Reference Smit, de Geus, van de Nieuwenhuijzen, van Beijsterveldt, van Baal, Mansvelder, Boomsma and Linkenkaer-Hansen2011) or drowsiness (Niedermeyer, Reference Niedermeyer, Niedermeyer and Lopes da Silva1999c). Beta oscillations of about 15 to 25 Hz reflect active processing or movement-related oscillations (Niedermeyer, Reference Niedermeyer, Niedermeyer and Lopes da Silva1999c).
A large body of research has linked EEG parameters to cognitive ability (Anokhin & Vogel, Reference Anokhin and Vogel1996; Jaušovec & Jaušovec, Reference Jaušovec and Jaušovec2000; Onton et al., Reference Onton, Delorme and Makeig2005; Tesche & Karhu, Reference Tesche and Karhu2000; Thatcher et al., Reference Thatcher, North and Biver2008) and various psychopathologies including ADHD, depression, alcoholism, and autism (Barry et al., Reference Barry, Johnstone and Clarke2003; Cameron et al., Reference Cameron, Geffen, Kavanagh, Wright, McGrath and Geffen2003; Kemner et al., Reference Kemner, van der Gaag, Verbaten and van Engeland1999; Linkenkaer-Hansen et al., Reference Linkenkaer-Hansen, Monto, Rytsälä, Suominen, Isometsä and Kähkönen2005; Porjesz & Begleiter, 2003). Many EEG parameters are influenced by genetic factors. For example, the strength of EEG oscillation (EEG power), connectivity between brain areas (measured with EEG coherence or synchronization likelihood), and more complex measures (network efficiency, dynamical signal complexity, and the decay in autocorrelation) all show moderate to high heritability (Almasy et al., Reference Almasy, Porjesz, Blangero, Chorlian, O'Connor, Kuperman, Rohrbaugh, Bauer, Reich, Polich and Begleiter1999; Anokhin et al., Reference Anokhin, van Baal, Van Beijsterveldt, De Geus, Grant and Boomsma2001; Posthuma et al., Reference Posthuma, De Geus, Mulder, Smit, Boomsma and Stam2005; Smit et al., Reference Smit, Posthuma, Boomsma and Geus2005, Reference Smit, Stam, Posthuma, Boomsma and de Geus2008, Reference Sponheim, Clementz, Iacono and Beiser2010; van Baal et al., Reference Van Baal, De Geus and Boomsma1996; van Beijsterveldt et al., Reference Van Beijsterveldt, Molenaar, De Geus and Boomsma1996, Reference Van Beijsterveldt, Molenaar, De Geus and Boomsma1998a, Reference Van Beijsterveldt, Molenaar, De Geus and Boomsmab; Zietsch et al., Reference Zietsch, Hansen, Hansell, Geffen, Martin and Wright2007). As such, these EEG-derived parameters fulfill two important criteria of the endophenotype concept (de Geus, Reference de Geus2002): they are related to the (heritable) phenotype, and they are heritable traits.
Increased use of structural and functional magnetic resonance imaging (MRI) scans in cognitive and clinical neuroscience also has produced a large body of evidence linking MRI volumetric measures to brain function, cognition, and brain disorder. As with the EEG parameters, MRI volumetric brain measures tend to be highly heritable, both in childhood and later in life. This is seen for whole-brain measures of cerebral gray and white matter volumes (GMV and WMV), cortical thickness, and volumes of subcortical structures such as hippocampal volume (Hulshoff Pol et al., Reference Hulshoff Pol, Schnack, Posthuma, Mandl, Baaré, van Oel, van Haren, Collins, Evans, Amunts, Bürgel, Zilles, de Geus, Boomsma and Kahn2006; Peper et al., Reference Peper, Brouwer, Boomsma, Kahn and Hulshoff Pol2007; Posthuma et al., Reference Posthuma, De Geus, Baaré, Hulshoff Pol, Kahn and Boomsma2002, Reference Posthuma, De Geus, Mulder, Smit, Boomsma and Stam2003; van Leeuwen et al., Reference van Leeuwen, Peper, van den Berg, Brouwer, Hulshoff Pol, Kahn and Boomsma2009).
Variation in both EEG power and MRI volumes has often been related to the same phenotypes. For example, EEG power and MRI volumes show correlations with cognitive performance across normal and patient subject groups. Both WMV and GMV show correlations with intelligence ranging from .25 to .40 (Luders et al., Reference Luders, Narr, Thompson and Toga2009; Posthuma et al., Reference Posthuma, De Geus, Baaré, Hulshoff Pol, Kahn and Boomsma2002). EEG power of various frequencies has also been found to be significantly correlated with IQ in several studies, including 10 Hz alpha (Thatcher et al., Reference Thatcher, North and Biver2005) and 6 Hz theta in elderly subjects (Finnigan et al., Reference Finnigan, Robertson, Finnigan and Robertson2011), albeit with slightly smaller effect sizes (about r = 0.20). Schizophrenia may serve as another example. Here, a triad of effects has been reported between gray matter changes, IQ deterioration, and ~10 Hz alpha power reduction (Leeson et al., Reference Leeson, Sharma, Harrison, Ron, Barnes and Joyce2011; Sponheim et al., Reference Sponheim, Clementz, Iacono and Beiser1994; Sun et al., Reference Sun, Phillips, Velakoulis, Yung, McGorry, Wood, van Erp, Thompson, Toga, Cannon and Pantelis2009). In sum, for many phenotypes that have correlations with brain volume, correlations with EEG power have also been reported.
In sum, MRI volumes and EEG-derived parameters show substantial overlap in their relation with brain function, cognition, and brain disorder. This overlap in the individual differences in EEG and MRI may perhaps be explained by the same neurodevelopmental processes, notably including myelination and synaptic formation and pruning (Casey et al., Reference Casey, Tottenham, Liston and Durston2005; Huttenlocher, Reference Huttenlocher1979; Huttenlocher & Dabholkar, Reference Huttenlocher and Dabholkar1997; Lenroot & Giedd, Reference Lenroot and Giedd2006; Paus, Reference Paus2010). If so, they would be expected to share a common etiology, including genetic and environmental determinants. Here we will focus on the relation between EEG power and MRI volumes. Whitford et al. (Reference Whitford, Rennie, Grieve, Clark, Gordon and Williams2007) showed that EEG power and MRI volumes are indeed correlated (in the range r = .24 to r = .30 for alpha oscillations). We aim to replicate these findings in a sample of healthy adults and test for significance of phenotypic correlations between EEG power and MRI volumes. Next, we aim to make use of the extended twin design of monozygotic (MZ) and dizygotic (DZ) twins (and their siblings) to investigate through multivariate genetic modeling whether MRI volumes and EEG indeed share part of their genetic and environmental determinants.
Methods
Subjects
Subjects were recruited from The Netherlands Twin Registry as part of projects on the genetics of cognition and adult brain functions. Adult twins and their non-twin siblings were asked to participate in a testing protocol lasting 4.5 hours. In total, 405 twins and siblings (213 female; 192 male) from 160 twin families participated in the study. The sample consisted of a young adult age cohort (M = 26.2 years, SD = 4.1). The sample included 61 MZ and 77 DZ complete twin pairs, and 114 siblings. Of these, 121 subjects (average age 27.4 years) also took part in an MRI study (48 male, 73 female; 20 complete MZ pairs, 23 complete DZ twin pairs, and 25 siblings).
EEG Acquisition and Analysis
A detailed description of EEG acquisition can be found elsewhere (Smit et al., Reference Smit, Posthuma, Boomsma and Geus2005). In short, we obtained 3-minute eyes closed background EEG on 19 scalp positions (F7, F3, F1, Fz, F2, F4, F8, T7, C3, Cz, C4, T8, P7, P3, Pz, P4, P8, O1, and O2) using Ag/AgCl electrodes mounted in an electrocap. Vertical and horizontal eye movement was measured using bipolar derivations. The EEG was amplified, digitized at 250 Hz, and stored for offline processing.
All EEG signals were re-referenced to average earlobes. After visual inspection, Independent Components Analysis was performed and components reflecting eye movements removed. A minimum of 100 s of data was required. Power was calculated using Thomson's multitaper method as implemented in MATLAB. Finally, the resulting power values were 10 × log10 transformed averaged into the theta (3.0–5.4 Hz), alpha (6.0–13.0 Hz) and beta (15.0–25.0 Hz) frequency bins.
Structural MRI Assessment
For the 121 subjects, MRI scans were acquired using a Philips 1.5 T Intera scanner (Philips, Best, The Netherlands) at the University Medical Center Utrecht. For a detailed description of the acquistion and processing of the scans of this sample, see Baaré et al. (Reference Baaré, Hulshoff Pol, Boomsma, Posthuma, Geus, Schnack, van Haren, van Oel and Kahn2001). In short, the T1-weighted images (voxel size 1 × 1 × 1.2 mm3) were transformed into Talairach orientation (no scaling; Talairach & Tournoux, Reference Talairach and Tornoux1988) and corrected for magnetic field inhomogeneities (Sled et al., Reference Sled, Zijdenbos and Evans1998). Segments of gray and white matter of the cerebrum were obtained by an automated method validated earlier (Schnack et al., Reference Schnack, Hulshoff Pol, Baaré, Viergever and Kahn2001), from which tissue volumes were calculated.
Statistical Methods
Phenotypic correlations between MRI volumes and EEG power, and correlations between MZ and DZ/Sib pairs for all traits, as well as cross-twin-cross-trait correlations among MRI and EEG traits, were estimated in a so-called saturated model in trivariate models with EEG power, GMV, and WMV, which specifies correlations among relatives, but does not put any constraints on the correlational structure. In addition, variances are freely estimated for each variable. Previous results had suggested no sex differences in correlation structure for EEG power (Smit et al., Reference Smit, Posthuma, Boomsma and Geus2005; Zietsch et al., Reference Zietsch, Hansen, Hansell, Geffen, Martin and Wright2007) or for MRI volumes (Baaré, 2001), and we therefore did not model this effect. Note, however, that all models include sex and age as linear fixed effects (covariates). Figure 1 shows the saturated model.
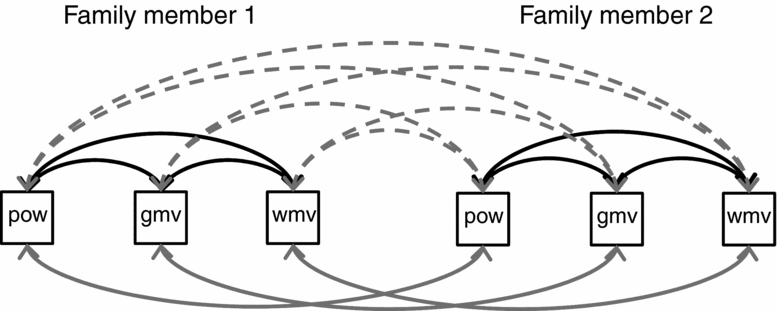
FIGURE 1 Trivariate saturated model used in the statistical analysis of EEG power (pow), gray matter volume (gmv), and white matter volume (wmv). The model estimates phenotypic correlations (black arrows), twin correlations (gray arrows), and cross-twin-cross-trait correlations (CTCT; dashed gray arrows). Family members can be mono zygous (MZ) twins, dizygous (DZ) twins, or twin-sibling pairs with separate CTCT and twin correlations. Correlations between DZ twin pairs and twin-sibling pairs were fixed to be equal. All models used age-fixed and sex-fixed effects on the means. Separate analyses were performed for EEG oscillation power in the three frequency bands and are listed as Model 1 in Table 4.
These trivariate saturated models formed the basis for the trivariate genetic models that were applied to the data. As previous studies found no empirical evidence that resemblance among family members for EEG or MRI characteristics is influenced by common environment shared by family members, the genetic models included two types of latent (unobserved) factors that explained trait variance and covariance among twins and siblings. Additive genetic (A) factors can explain resemblance among family members; they correlate 1 between MZ twins and, on average, .5 between DZ twins and siblings. Unique environmental factors (E) cause differences between family members, including between MZ twins. The effect of these latent factors on the observed, univariate, or multivariate phenotypes can be estimated by genetic structural equation modeling. Figure 2 shows the path model used. Data were analyzed in a series of trivariate models including GMV, WMV, and EEG power (separate models for the alpha, beta, and theta frequency bands). The model included three latent A and three latent E factors; the first A and E factors influence all 3 traits, the second A and E factors influence only 2 traits and the last A and E factor only influences one trait. Through this parameterization, the phenotypic covariance matrix is decomposed into a genetic and an environmental part (ΣP = ΣA + ΣE). Standardization of each of these matrices provides phenotypic, genetic, and environmental correlations among traits. Note that the correlations do not necessarily add up (rP ≠ rA + rE) due to each covariance being standardized to different variances.
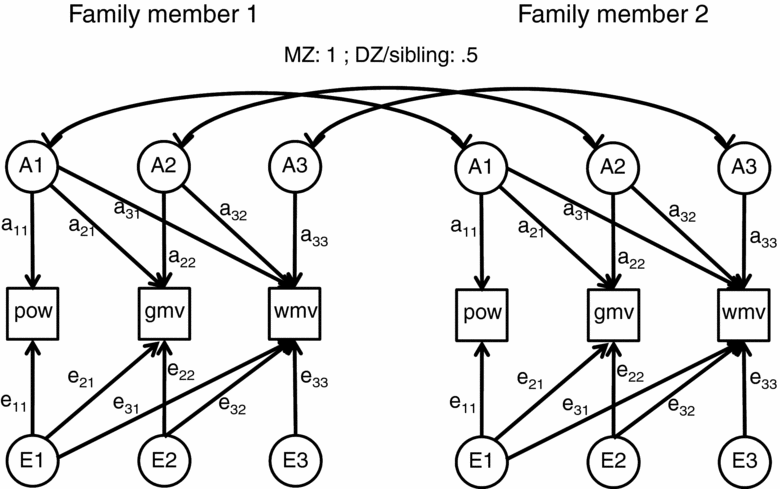
FIGURE 2 Trivariate path model used in the statistical analysis of EEG power (pow), gray matter volume (gmv), and white matter volume (wmv). Family members can be monozygous (MZ) twins, dizygous (DZ) twins, or twin sibling pairs. The path model describes the relation between pairs of family members, but can easily be expanded to include >2 family members. Additive genetic factors (A) are correlated 1 between MZ twins, 0.5 between DZ twins and siblings, and 0 between unrelated subjects. Unique environmental factors (E) are uncorrelated across family members, but may still mediate phenotypic correlation between the variables. Separate analyses were performed for EEG oscillation power in the three frequency bands and are listed as Model 5 in Table 4. Model 10 in Table 4 (theta and alpha oscillations) is the same model with path loadings e21 and e31 removed. Model 10 (beta oscillations) has path loadings e21, e31, a21, and a31 removed.
Statistical modeling was done in Mx version 1.54 (Neale et al., Reference Neale, Boker, Xie and Maes2003). Mx computes the likelihood of a model based on the observed and expected (modeled) covariance matrixes, then maximizes the likelihood by stepwise changing of the model parameters. After fitting parameters for the full saturated model, we applied constraints; for example, by constraining the values of parameters to each other or by dropping them to zero. This results in a nested sub-model with a different likelihood. Twice the difference in likelihood between the full model and a nested sub-model with restricted number of parameters is asymptotically chi-square distributed, with the number of constrained parameters as degrees of freedom. If the test is significant, this indicates that the parameter significantly contributes to the model and needs to be retained.
Specifically, after fitting the saturated model we tested for the significance of the phenotypic correlation by setting it to zero. If significant, we tested whether the AE model provided a nonsignificant deterioration of model fit. In this model we tested whether the correlation between GMV and EEG power was mediated by genetic or environmental factors by dropping path loadings e21 and a21 respectively (see Figure 2). Similarly, the etiology of the relation between WMV and EEG power was tested by dropping e31 and a31. Nonsignificant path loadings were removed. Finally, we tested the significance of the genetic effects on each of the variables EEG power, GMV, and WMV by dropping all path loadings from the variables to A.
Results
The twin correlations from the saturated models are shown in Table 1. These show very high MZ twin correlations for all measures. Moreover, the DZ twin/sibling correlations are around half the MZ correlation, suggesting that non-additive genetic effects or common environment do not play a significant role. Phenotypic correlations are shown in Table 2, and cross-twin-cross-trait correlations (CTCT) are shown in Table 3. These indicate that there are small to moderate correlations between EEG power and MRI volumes for alpha and theta oscillations. The MZ CTCT correlations are about the same size as the phenotypic correlation, indicating a genetic etiology for this relationship. Genetic correlations and the proportion of the phenotypic correlation attributable to genetic effects are also shown in Table 2. These reveal that, although the phenotypic correlations are 100% genetic, EEG power and MRI volumes show only moderate overlap (31% to 43%) in genetic variance.
TABLE 1 Heritabilities and Twin Correlations of EEG Power and MRI Volumes

GMV = gray matter volume, WMV = white matter volume; values in brackets are 95% Confidence Intervals; EEG power from oscillations in the theta (3.0–5.6 Hz), alpha (6.0–13.0 Hz) and beta (15.0–25.0 Hz); heritability from multivariate AE models; twin correlations from saturated models.
TABLE 2 Phenotypic Correlations Between EEG Power and MRI Volumes
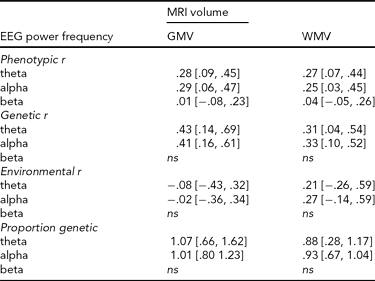
GMV = gray matter volume, WMV = white matter volume; values in brackets are 95% Confidence Intervals; EEG power in theta (3.0–5.6 Hz), alpha (6.0–13.0 Hz) and beta (15.0–25.0 Hz) frequency bands. Correlations were estimated in the saturated model. Genetic r represents the correlation between additive genetic factors and, thus, the proportion of heritable variance shared between the two phenotypes; Environmental r represents the correlation between the environmental factors and, thus, the proportion shared environmental variance between the two phenotypes; Proportion genetic represents the proportion of the phenotypic correlation that can be attributed to genes; values >1 indicate opposite sign in environmental and genetic correlations. ns = no significant phenotypic correlation.
TABLE 3 Cross-Twin-Cross-Trait Twin Correlations Between EEG Power and MRI Volumes

GMV = gray matter volume, WMV = white matter volume, CTCT = cross-twin-cross-trait twin correlations, MZ = monozygous, DZ = dizygous; values in brackets are 95% Confidence Intervals; EEG power from oscillations in the theta (3.0–5.6 Hz), alpha (6.0–13.0 Hz) and beta (15.0–25.0 Hz); estimated in the saturated model.
Table 4 shows the results from the formal testing of these correlations for each of the frequency bands. For both alpha and theta oscillations, the phenotypic correlations were significant for both WMV and GMV, χ2(1) > 4.97, p < .05. Next, we observed that the saturated model could be constrained to an AE model, χ2(6) < 11.6, p > .05. Note that this model is equivalent to constraining all DZ correlations (including DZ cross-twin cross-trait correlation) to half the MZ equivalent, and is therefore nested in the saturated model. This test provides further evidence that non-additive genetic effects and effects of common environment are absent for both EEG power and MRI volumes. Next, we tested the source of the phenotypic correlations in the AE model. Path loadings e21 and e31 could both be dropped, χ2(1) < 1.59, but not path loadings a21 and a31, χ2(1) > 4.97, p < .05. Thus, for alpha and theta band EEG power, the phenotypic correlations with GMV and WMV were entirely explained by additive genetic factors. The heritabilities for power and MRI volumes were highly significant and are shown in Table 1.
TABLE 4 Multivariate Model Fit Between EEG Power and MRI Volumes
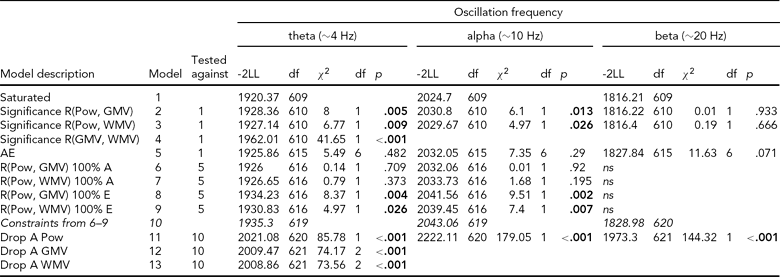
Pow = EEG power, GMV = cerebral grey matter volume, WMV = cerebral white matter volume; EEG power from oscillations in the theta (3.0–5.6 Hz), alpha (6.0–13.0 Hz) and beta (15.0–25.0 Hz); model fit from a trivariate SEM model with sex and age as covariates on all variables. Model 5 is the AE model (Figure 2) and is equivalent to a saturated model with all r DZ and CTCTDZ constrained to .5 times their MZ counterparts, and therefore nested in the saturated model.
Table 5 shows the effects of the covariates on the mean. The effect of sex on MRI volumes was quite large and highly significant, whereas the effect of age was much weaker — although a significant yearly decrease was found for GMV (see e.g., Walhovd et al., Reference Walhovd, Fjell, Reinvang, Lundervold, Dale, Eilertsen, Quinn, Salat, Makris and Fischl2005). EEG power showed well-known effects of higher power in females and a strong decrease in theta power (Smit et al., Reference Smit, de Geus, van de Nieuwenhuijzen, van Beijsterveldt, van Baal, Mansvelder, Boomsma and Linkenkaer-Hansen2011).
TABLE 5 Means and Effects of Covariates
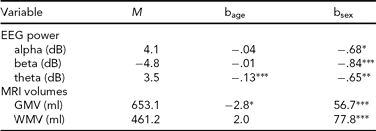
Age covariate as increase in dB per year (EEG power) or ml per year (MRI volumes); sex covariate coded as males relative to females; GMV = cerebral grey matter volume, WMV = cerebral white matter volume.
*p < .05, **p < .01, ***p < .001.
Discussion
We have shown that the power of EEG alpha and theta oscillations was significantly correlated with MRI-derived WM and GM volumes in a sample of young adult subjects. We therefore fully replicated the results reported by Whitford et al. (Reference Whitford, Rennie, Grieve, Clark, Gordon and Williams2007), who found similar correlations (.24 < r < .30 for alpha oscillations, .21 < r < .36 for combined delta-theta oscillations). In addition, we have shown for the first time that these correlations are entirely genetically mediated.
The results show that beta band power did not reflect variance in either GMV or WMV. This discrepancy between theta/alpha and beta EEG power may seem surprising because significant phenotypic and genetic overlap between alpha and beta EEG power has been observed. Genetic and phenotypic correlations between beta and the lower frequencies (alpha and theta) were all around .60 (Smit et al., Reference Smit, Posthuma, Boomsma and Geus2005). Clearly, this overlap between beta and alpha/theta oscillations does not include variance related to MRI volumes and may help elucidating what factors underlie the relationship between EEG power and MRI volumes.
EEG power reflected only a subset of the genes causing variation in MRI volumes. This is consistent with the view that MRI volumes reflect multiple processes — pruning and dendritic outgrowth, and increased axonal myelination causing increases in WMV and decreases in GMV (e.g., Casey et al., 2004; Lenroot & Giedd, Reference Lenroot and Giedd2006). EEG power, on the other hand, is likely to reflect more directly the postsynaptic potentials of the apical dendrites of cortical pyramidal cells, and to reflect the synaptic density and the tendency of the thalamo-cortical loops to oscillate. Nevertheless, EEG power and MRI volumes pick up shared genetic factors that influence individual differences in two — at first sight — rather diverse brain measures.
What is the nature of these genetic factors and how do they cause the association between EEG power and MRI volumes? Formally, three explanations exist, which may also co-occur. First, the shared genetic factor observed in this study may cause variation in the volumetric measures, in turn causing variance in the EEG power spectrum. For example, there may be GMW-related alterations in conductive properties of the neural tissue, and WMV could be related to EEG power as the result of increased effectiveness in cortico-cortical and thalamo-cortical connectivity, both important aspects in oscillation generation (Steriade, Reference Steriade1999). Second, the correlated activity reflected in EEG power could actually cause volumes to increase because increased activity may cause extended dendritic branching (Peng et al., Reference Peng, He, Marie, Zeng, Ma, Tan, Lee, Malenka and Yu2009; Sin et al., Reference Sin, Haas, Ruthazer and Cline2002; Yu & Malenka, Reference Yu and Malenka2003). Third, both EEG power and MRI volumes may show individual differences as a result of underlying differences in neurohistological variables such as dendritic arborization, expansion, synaptic density, and myelination. A possible design to tackle the core question of causality is the longitudinal assessment of both types of parameters in large twin samples (De Moor et al., Reference De Moor, Boomsma, Stubbe, Willemsen and de Geus2008).
Although EEG power reflected only part of the (genetic) variation in MRI volumes, other — and perhaps more complex — derivations of the EEG signal than EEG power may provide additional explanatory power. Such variables have often been shown to be heritable, including dynamic complexity (Anokhin et al., Reference Anokhin, Lutzenberger and Birbaumer1999), connectivity (van Baal et al., Reference Van Baal, Boomsma and De Geus2001; Posthuma et al., Reference Posthuma, De Geus, Mulder, Smit, Boomsma and Stam2005; Smit et al., Reference Smit, Boersma, van Beijsterveldt, Posthuma, Boomsma, Stam and de Geus2010), decay in temporal autocorrelations (Linkenkaer-Hansen et al., Reference Linkenkaer-Hansen, Smit, Barkil, van Beijsterveldt, Brussaard, Boomsma, van Ooyen and Geus2007), and graph theoretical analysis of the brain network (Smit et al., Reference Smit, Boersma, van Beijsterveldt, Posthuma, Boomsma, Stam and de Geus2010; Smit et al., in press). It was also observed that these measures are, to at least some degree, not correlated with EEG power. For example, the power-law decay in autocorrelations is largely unrelated to EEG power (Linkenkaer-Hansen, 2007). Also, connectivity was, to some degree, genetically uncorrelated with EEG power (Smit et al., Reference Smit, Boersma, van Beijsterveldt, Posthuma, Boomsma, Stam and de Geus2010).
MRI volumes, and especially GMV, have well-documented changes in psychopathological states such as ADHD (Casey et al., Reference Casey, Trainor, Orendi, Schubert, Nystrom, Giedd, Castellanos, Haxby, Noll, Cohen, Forman, Dahl and Rapoport1997; Castellanos et al., Reference Castellanos, Lee, Sharp, Jeffries, Greenstein, Clasen, Blumenthal, James, Ebens, Walter, Zijdenbos, Evans, Giedd and Rapoport2002; Durston et al., Reference Durston, Pol, Schnack, Buitelaar, Steenhuis, Minderaa and Kahn2004; Rubia et al., Reference Rubia, Overmeyer, Taylor, Brammer, Williams, Simmons and Bullmore1999) and schizophrenia (Chua et al., Reference Chua, Cheung, Cheung, Tsang, Chen, Wong, Cheung, Yip, Tai, Suckling and McAlonan2007; Gur, Cowell, et al., Reference Gur, Cowell, Latshaw, Turetsky, Grossman, Arnold, Bilker and Gur2000; Gur, Turetsky, et al., Reference Gur, Turetsky, Cowell, Finkelman, Maany, Grossman, Arnold, Bilker and Gur2000; Honea et al., Reference Honea, Crow, Passingham and Mackay2005; Hulshoff Pol et al., Reference Hulshoff Pol, Schnack, Mandl, van Haren, Koning, Collins, Evans and Kahn2001; Wright et al., Reference Wright, Rabe-Hesketh, Woodruff, David, Murray and Bullmore2000). The current results suggest that EEG could serve as an endophenotype for the structural brain changes characterizing these disease states. Its usefulness may benefit from source localization of EEG activity to the implied cortical structures (Wright et al., Reference Wright, Rabe-Hesketh, Woodruff, David, Murray and Bullmore2000), compared to the whole-brain approach used in the current study. Future investigations may reveal whether these brain-projected EEG power values predict — as one would expect — cortical volumes of the same brain areas.
In sum, these results show that simple, inexpensive, and widely available EEG recordings reflect genetic structural brain parameters. Studies that require large numbers of observations — such as genome-wide studies — may benefit from the more widespread availability of EEG apparatus when exploring the genetics of structural brain parameters. Replication of loci with significant genome-wide association could include cohorts with resting EEG power data. Rather than focusing on complex compound measures, focusing on the covariation between EEG power and MRI volumes may isolate specific processes such as synaptic density that underlie both traits.
Acknowledgments
This research was funded by VU University VU-USF 96/22 to D.B., the Human Frontiers of Science Program (HFSP) RG0154/1998-B to D.B. and E.d.G., and The Netherlands Science Foundation NWO/MagW VENI-451-08-026 to D.S.


