INTRODUCTION
Legionellosis is a collective term for the clinical syndromes caused by members of the genus, Legionella. Legionellae are intracellular protozoan parasites found ubiquitously in both water and moist soil environments and have been isolated globally from these habitats. A number of human-made environments, in particular air-conditioning systems and water-distribution systems, have been found to act as reservoirs and amplifiers of Legionella [Reference Butler, Breiman, Evans and Brachman1–Reference Fields, Benson and Besser3] producing and dispersing aerosols. They form a critical part of an effective pathway of transmission for Legionella and are a frequent source of human exposure. Other opportunities for human exposure to Legionella have been identified from soil, composts and potting mix [Reference Fields, Benson and Besser3]. Although this transmission route is not fully understood it is likely to involve aerosolized dust particles containing Legionella.
Legionella is associated with two distinct clinical illnesses: Pontiac fever, a non-pneumonic, self-limiting influenza-like illness of typically 2–5 days' duration following an incubation period of 5–72 h [Reference Tossa4]; and Legionnaires' disease (LD) which is characterized by atypical pneumonia with an incubation period of 2–10 days and carries a fatality rate of 10–15% in otherwise healthy individuals [Reference Joseph5]. Both Pontiac fever and LD fit a spectrum of illness that occurs as a result of environmental exposure to Legionella [Reference Girod6]. Since 1976, at least 50 species of Legionella have been identified, 20 of which have been associated with human infection [Reference Diederen7]. Globally Legionella pneumophila serogroup 1 (Lpsg1) is the most common type known to cause disease [Reference Joseph, Ricketts, Heuner and Swanson8]. Predisposing risk factors for legionellosis include smoking, advanced age (⩾65 years), male sex and the existence of pre-existing chronic pulmonary disease, diabetes, renal failure or any illness or treatment associated with immunosuppressive conditions. Cases have been reported in all age groups in otherwise healthy individuals including infants [Reference Neil and Berkelman9]. Contact with a contaminated environmental source is a necessary precursor for infection along with predisposing host factors that are not fully understood. To date, there have been no documented cases of person-to-person transmission of the bacteria [Reference Yu10] and it is deemed non-communicable.
Legionellosis occurs worldwide with a number of outbreaks described globally [Reference Joseph, Ricketts, Heuner and Swanson8]. Legionella infections may be sporadic or epidemic, occurring most frequently worldwide as sporadic cases, either nosocomial (hospital) or community acquired [Reference Joseph, Ricketts, Heuner and Swanson8], with significant variation between countries. For example, studies from Europe and North America showed the incidence of Legionella as a cause of all sporadic community-acquired pneumonias ranged from 2% to 15% [Reference Stout and Yu11]. A study carried out in New Zealand in the mid-1990s estimated the percentage of cases of community-acquired pneumonia caused by Legionella to be 2–11% [Reference Neill12].
The first known case of legionellosis in New Zealand was diagnosed in 1979 [Reference Holst13] and by the end of December 2009, 1461 cases had been notified. New Zealand appears to have a relatively high annual incidence rate of LD of 1·4/100 000 population (1980–2009) compared to other developed countries. This high incidence rate is possibly due to New Zealand's long history of laboratory-based surveillance through a centralized reference laboratory established in 1979, for diagnosing and reporting cases.
The patterns of Legionella spp. and serogroups associated with the disease in New Zealand are different to those seen in most other developed countries where L. pneumophila causes 90% of illness, with Lpsg1 alone accounting for about 85% of cases [Reference Doleans14]. In New Zealand L. longbeachae, a species associated with exposure to compost and gardening potting mix [Reference Yu15] is the causative agent for as many as 50% of community-acquired sporadic cases [Reference Cramp16]. This makes the New Zealand situation worthy of investigation and of global interest.
Disease surveillance in New Zealand shows legionellosis outbreaks are rare and that the majority of these infections are sporadic cases of community-acquired pneumonia where L. pneumophila accounts for about 50% of cases [Reference Yu15]. This is different to a country like the USA where Lpsg1 makes up 90% of Legionella case isolates [Reference Neil and Berkelman9].
Surveillance for legionellosis began in New Zealand in 1979 with the availability of annual laboratory-proven data and the addition of notification data from 1981 (legionellosis became notifiable in June 1980), yet there has been a paucity of published research focusing on the epidemiology of legionellosis in New Zealand. Publications to date have tended to be brief descriptive epidemiological summaries of data for 1 year only [Reference Chereshsky, Baker and Hopkirk17, Reference Maas, McElnay and Watson18]. This paper provides the first comprehensive epidemiological review of legionellosis in New Zealand since 1979 when the first case was diagnosed. Our objectives were to examine the diversity of Legionella spp. causing disease in New Zealand and to evaluate the spatial and temporal variation over the past three decades. By analysing the changing epidemiological trends of legionellosis in New Zealand, this evaluation will inform the epidemiological picture at the global level, and provide additional information for better public health control measures.
METHODS
Surveillance of legionellosis
In New Zealand legionellosis surveillance (including LD and Pontiac fever cases) consists of both laboratory and disease notification data collected for public health purposes. However, the epidemiology of Pontiac fever in New Zealand, as with other jurisdictions, is not as well characterized as LD due to Pontiac fever being relatively benign and frequently not requiring medical invention [Reference Tossa4]. Because of this it is suspected most cases of Pontiac fever in New Zealand are unreported. Legionellosis has been notifiable in New Zealand since June 1980. Notifications are made to the local Medical Officer of Health, a statutory position under the Health Act 1956. Health professionals and all medical laboratories (since December 2007) are required to inform their local Medical Officer of Health of any case of legionellosis. Historical notification data for the years 1980–1995 were obtained from the Institute of Environmental Science and Research Ltd (ESR), records obtained from the New Zealand National Archives and annual reports of the then Department of Health. Most of the analysis from 1996 was based on aggregated annual legionellosis surveillance and outbreak data collated by ESR. Since 1996 ESR has operated and managed a national notifiable disease surveillance database, EpiSurv7 [19], under contract to the Ministry of Health. Key data fields collected include case demographics, clinical features, laboratory identification of the causative agent and risk factors. Similar data for laboratory-identified environmental isolates have been collected since 1987.
The annual incidence rates for New Zealand were calculated by dividing the number of notified cases for each year by the mid-year population estimates and the results were expressed as cases per 100 000. The mid-year population estimates were sourced from Statistics New Zealand which conducts a census of population every 5 years. In circumstances where mid-year population estimates were unavailable for a particular variable (e.g. age and sex distribution), the census data were interpolated from the 5-yearly national population census for the years 1981, 1986, 1991 and 1996 to obtain mid-year estimates. Where fewer than five cases annually were notified a rate was not calculated. We also calculated the case-fatality rate where legionellosis is recorded as the primary cause on the death certificate, as a measure of disease severity.
All notification data were aggregated to the same 21 New Zealand District Health Boards' (DHBs) and were compared using consistent geographical units (2001 boundaries) over time. The DHBs are responsible for the provision of health and disability services in each region. The Boards have a mean population size of 201 000 and range from 32 000 (largely rural) to 513 000 (metropolitan).
Case definition and testing methods
Since LD has no clinical features that easily distinguish it from other severe respiratory diseases, it can only be diagnosed definitively by an appropriate laboratory test. The current case criteria (that was developed in 1998 and is now under review) for a ‘confirmed’ legionellosis case is compatible clinical disease and either culture isolation of any Legionella spp. from respiratory secretions, lung tissue, pleural fluid, or any normally sterile site, or the demonstration of the presence of Legionella spp. by the direct fluorescence antibody (DFA) test in respiratory secretions, lung tissue or pleural fluid, or the demonstration of either at least a four-fold rise in Legionella antibody titre to at least 256 in sera, or the demonstration of elevated titres of >256 in convalescent-phase sera [20]. A case is reported as ‘probable’ when a patient has clinically compatible symptoms and a single convalescent-phase serum antibody titre of >256 [20]. Until 1988 a cut-off of 128 was used in the Legionella indirect fluorescent antibody (IFA) test following seroprevalence studies carried out initially in 1980. The IFA cut-off was reassessed in 1988 and increased to 256 and further reassessed in 2005 with no change made. These studies used cohorts of healthy blood donors and acute admissions to a public hospital for any cause to determine the level of Legionella-specific antibodies in these cohort populations and to determine the appropriate cut-off antibody titres for the Legionella IFA test [Reference Balm, Harte and Blackmore21].
More recent testing methodologies such as the Legionella urinary antigen test (UAT) or the demonstration of Legionella-specific nucleic acid in clinical specimens using nucleic acid amplification techniques (NAAT), including PCR, are becoming more widely used but are yet to be officially adopted for New Zealand case definition for notification purposes [Reference Harte22]. The Ministry of Health is currently reviewing the laboratory criteria for diagnosis of legionellosis which will include other diagnostic tests such as the UAT and NAAT. The UAT is considered sufficiently robust and will be included in the revised confirmed case criteria, whereas a positive NAAT test is likely to remain as criteria for a probable case only.
Serum samples sent to the Legionella Reference Laboratory for confirmatory testing are tested by IFA against a panel of heat-killed whole-cell Legionella antigens that include L. pneumophila serogroups 1–15, L. anisa, L. bozemanae, L. dumoffi, L. feeleii, L. gormanii, L. jordanis, L. longbeachae, L. micdadei, L. oakridgensis and L. sainthelensi [Reference Maas, McElnay and Watson18]. All of these species and almost all of these serogroups have been isolated from clinical specimens over the last 30 years.
The Legionella Reference Laboratory can receive up to three specimen types for each case: sera, respiratory tract samples and Legionella culture isolates. Serum is the predominant specimen type with almost all laboratory-proven cases having supporting serology results. The remaining cases are either culture-positive, NAAT test positive or positive by UAT, with some cases testing positive for Legionella using more than one test.
Both ‘confirmed’ and ‘probable’ cases under the current case definition have been included in this paper, with the addition that all clinically compatible cases with a positive Legionella UAT test have been included as ‘confirmed’ cases while those with clinically compatible disease and only a positive Legionella PCR test have been included as ‘probable’ cases. All laboratory-proven legionellosis cases meeting the above case definition and notified between 1 June 1980 and 31 December 2009 have been included in the analysis.
Demographic characteristics
New Zealand is a country with an ethnically diverse, ageing and geographically mobile population of just over 4 million. In 2006 the European ethnic group accounted for 69%, Māori 15%, Asian 9% and Pacific Peoples 7% of the total population [23]. As in other developed countries New Zealand's proportion of older population (⩾65 years) is increasing. Cases of self-reported ethnicity are recorded in EpiSurv and entered onto the database by local public health unit staff of DHBs who are investigating notified cases. To account for the fact that more than one ethnicity can be recorded in the legionellosis case report form and in the census form, Statistics New Zealand's ‘prioritized ethnicity’ concept for both numerator and denominator was used [24]. In circumstances where a multiple response is given, the prioritization of ethnic group data assigns each person to just one group. Four prioritized ethnic groups were used in this analysis: Māori, Pacific people (Samoan, Cook Island, Tongan, Niuean, Fijian, Tokelauan, Tuvalu Islander), European (New Zealand and other European combined), ‘Other’ (Asian, Latin American, Middle Eastern, African). Age-standardized rates were directly age-standardized to the World Health Organization population.
Legionellosis outbreaks
Outbreaks are defined as two or more cases associated with a single site of exposure with dates of onset within 6 months of each other [20]. Data on legionellosis outbreaks reported since 1990 were obtained from ESR. Outbreaks were analysed by monthly distribution, DHB area, outbreak source, Legionella spp. and serogroup and number of confirmed cases and deaths.
Statistical analysis
Poisson regression was used to estimate the incidence rate ratios (IRR) for legionellosis in population age and ethnicity groups. Statistical analyses were performed using SPSS version 15 (SPSS Inc. USA) and thematic maps were created using ArcGIS version 9.3 (ESRI, USA).
RESULTS
A total of 2772 cases of legionellosis fitting the case definition were laboratory-proven between 1979 and 2009 giving a mean annual incidence rate of 2·5/100 000. Of these 1313 (47·4%) fitted the criteria as a ‘confirmed’ case and 1459 (52·6%) as ‘probable’ case (Fig. 1). A total of 1461 (53%) of the laboratory-proven cases were notified giving a mean annual notification incidence rate of 1·4/100 000. Figure 2 shows the laboratory-proven cases of legionellosis by year since 1979 and notified cases since 1980. Prior to direct laboratory notification to Medical Officers of Health of legionellosis in 2007, notification rates for laboratory-proven cases were poor with only about 50% of cases notified. The year 2000 marked the first occasion that the total number of notified cases exceeded that of laboratory-proven cases acknowledging a heightened awareness among clinicians and the fact that in some circumstances a lack of de-notification of cases, i.e. cases notified on suspicion, that were not confirmed through diagnostic testing. The cut-off in the serological test was adjusted in 1989 because of a high number of positive tests between 1985 and 1988. Since 1999 there has also been closer scrutiny and reciprocal matching of both laboratory-proven and notified cases resulting in total cases for each year being more closely aligned.
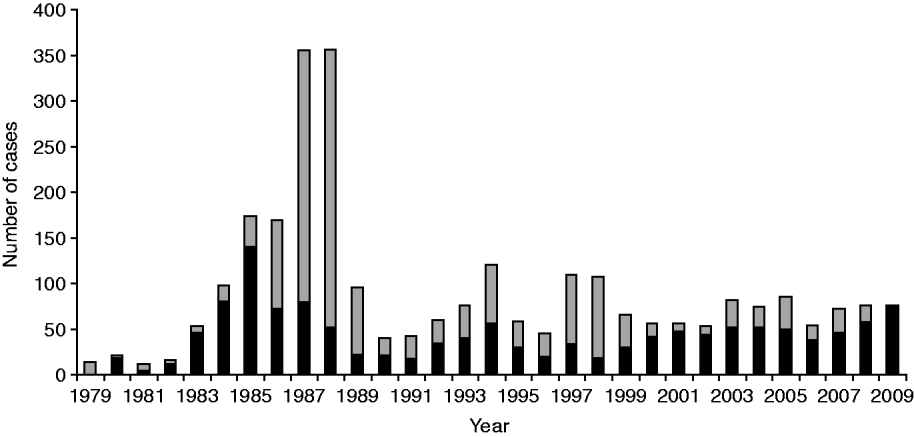
Fig. 1. Laboratory-proven cases fitting confirmed (▪) and probable (![]() ) case definition by year, 1979–2009.
) case definition by year, 1979–2009.
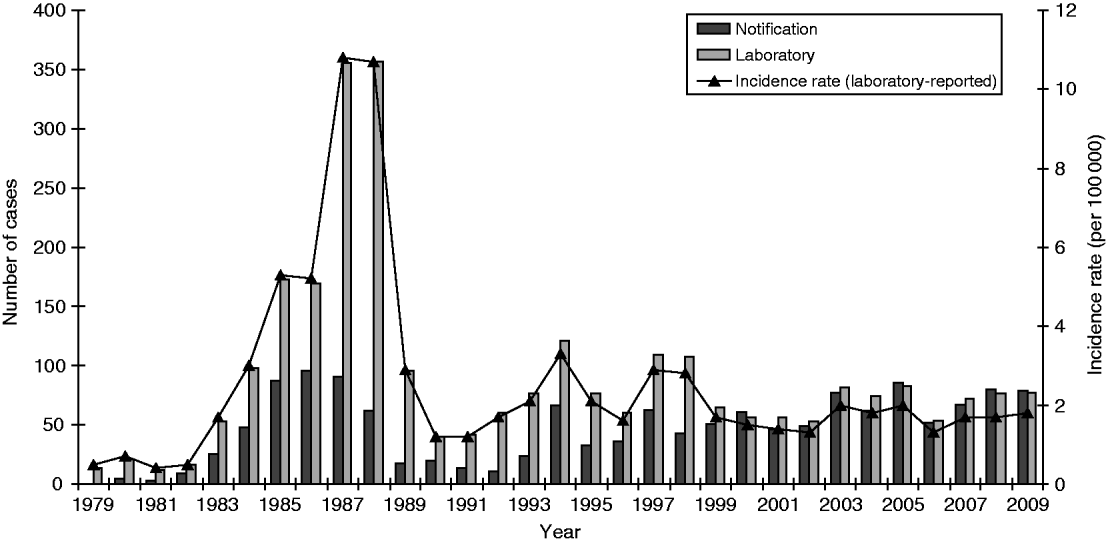
Fig. 2. Legionellosis notifications and laboratory-proven cases by year, 1979–2009.
Risk factors
The total number of laboratory-proven cases recorded in the EpiSurv database between 1997 (when data became available) and 2009 was 805. An environmental exposure risk was reported for 420 (52%) of these cases. For 243 (30%) cases contact with compost/potting mix or soil during their incubation period was identified (Table 1 a ). For a further 16% of cases exposure to either showers/hot-water systems, spa/indoor pools, air-conditioning units and using a water blaster was identified. More than one potential exposure risk was recorded for a small proportion of cases. Fifty-two (6·5%) of the total number of reported cases had a history of overseas travel during the incubation period. Table 1 b confirms that as with other jurisdictions smoking and the existence of a pre-existing immunosuppressive or debilitating condition are predisposing risk factors for legionellosis [Reference Neil and Berkelman9].
Table 1 a. Environmental risk exposures associated with legionellosis 1997–2009

* ‘Proportion’ refers to the percentage of cases that answered ‘yes’ out of the total number of cases with a known risk exposure.
† Refers to cases where risk was not determined or data was unavailable.
‡ Including exposure to potting mix, mulch, or soil within 10 days prior to onset of disease.
§ Including exposure to potable water systems, spa/indoor pools, cooling towers or water blasters within 10 days prior to onset of disease.
Table 1 b. Personal risk factors associated with legionellosis 1997–2009

* ‘Proportion’ refers to the percentage of cases that answered ‘yes’ out of the total number of cases for which this information was recorded.
† Refers to circumstances in which the data was unavailable.
‡ Includes diabetes, chronic lung disease, cancer, transplant recipient and corticosteroid treatment.
Figure 3 shows the number of Legionella strains identified for the clinical laboratory-proven legionellosis cases from 1979 to 2009. L. pneumophila and L. longbeachae accounted for over 50% of the laboratory-proven cases. Other than for 1987 and 1988 when a lower serological cut-off value was used, the results show a significant proportion of cases caused by L. longbeachae since 1999.
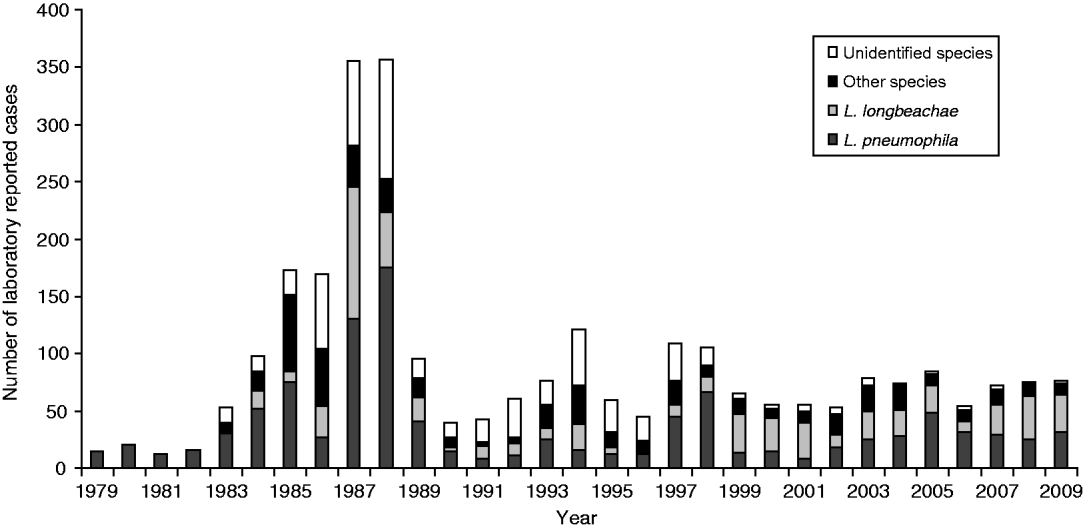
Fig. 3. Clinical laboratory-proven legionellae by species, 1979–2009.
Between 1987 and 2009, 1471 environmental isolates of Legionella have been laboratory identified with most identified to the species level. Figure 4 shows that there is a diversity of pathogenic and non-pathogenic species and serogroups that have been routinely isolated from the environment including water sources (i.e. air conditioners, cooling towers, whirlpool spas, showers) and compost/potting mix/soil contaminated with the bacteria. Most of these isolates are from environmental sites implicated as the source of infection for a case and as such show the diversity of strains to which the general population are exposed. While Lpsg1 is prominent among the L. pneumophila isolates, other serogroups include Lpsg 5 and Lpsg 6 that were seen in significant numbers in clinical cases in the 1980s [Reference McKeage25]. L. longbeachae is also another prominent species isolated from the environment and again reflects the predominance of this strain in clinical cases. Where the species or serogroup could not be clearly identified due to an antibody cross-reaction or a positive reaction to more than one species in the DFA test, it has been recorded as ‘Unidentified’ Legionella spp.
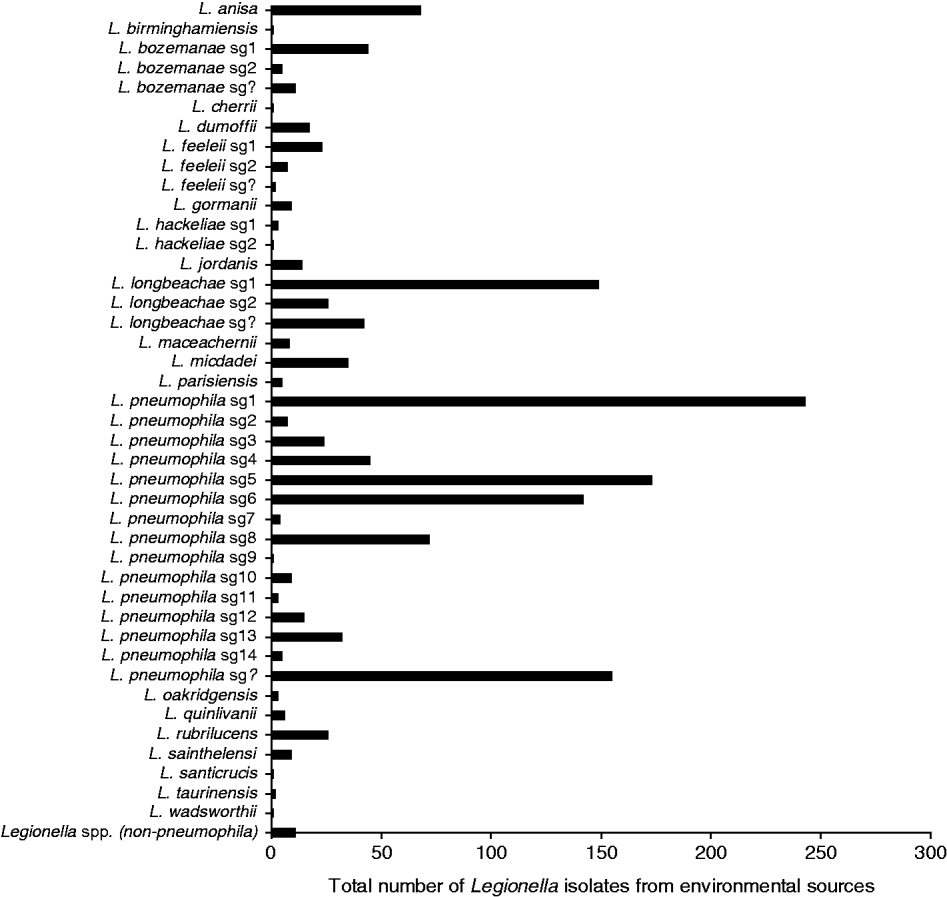
Fig. 4. Legionella isolates from environmental sources, 1987–2009.
Regional distribution
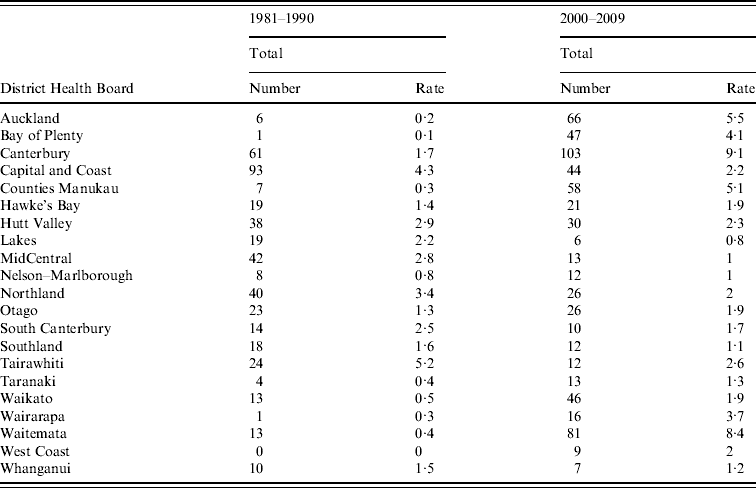
Figure 5 shows rates of notified legionellosis by DHB (divided into five quintiles based on mean rate/100 000 population) for 1981–1990 and 2000–2009. The two highest quintiles (with the darkest shading) were above the mean national notifiable incidence rate (1·4 cases/100 000 population). Consistently high rates were seen in the Hutt Valley (2·9/100 000 population, 1981–1990 and 2·3/100 000 population, 2000–2009) and Capital & Coast (4·3/100 000 population, 1981–1990 and 2·2/100 000 population, 2000–2009) DHBs which are situated in the lower North Island (data shown in Appendix Table A1).
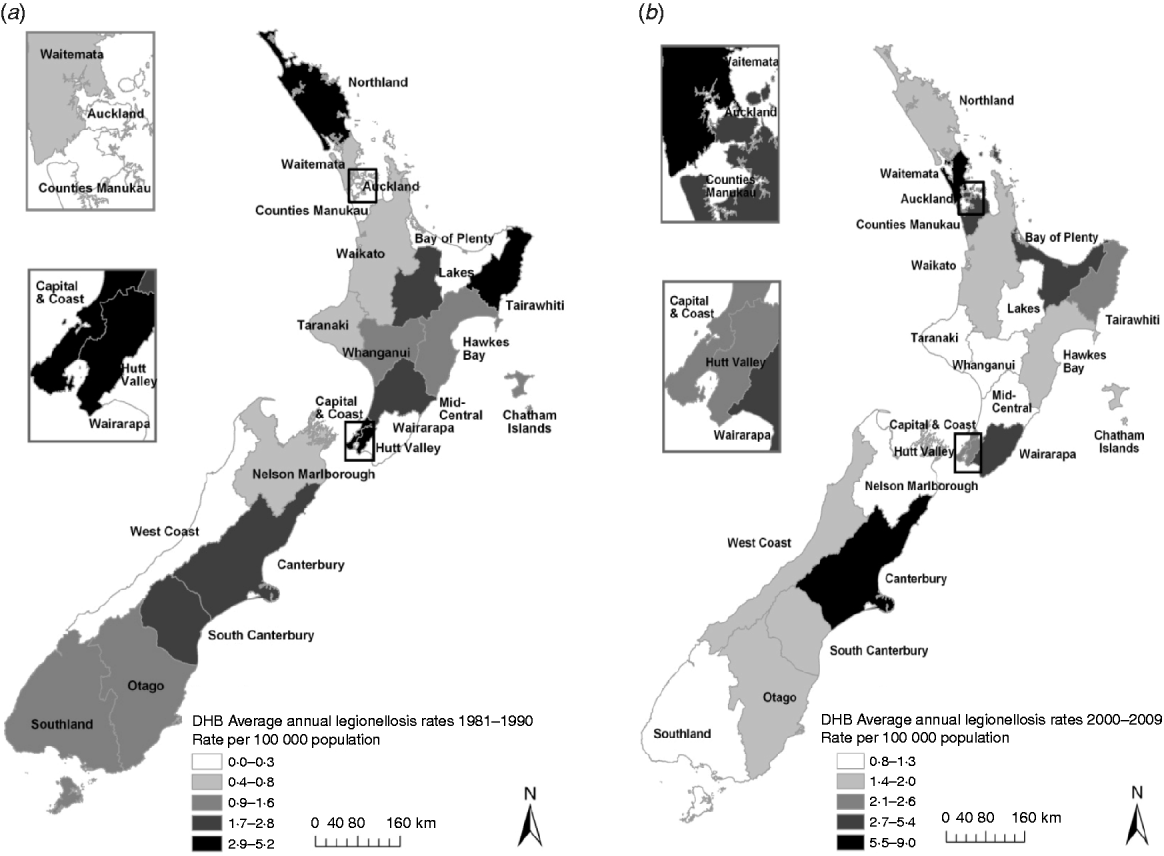
Fig 5. Legionellosis notification rates by New Zealand District Health Board, mean rate/100 000 population for (a) 1981–1990 and (b) 2000–2009.
Demographic characteristics
The age of laboratory-proven confirmed cases ranged from <12 months to 101 years with a median age of 57 years (Fig. 6). Age-standardized rates show that the rate of infection increased almost proportionally with age, with the highest rate occurring in the 50–59 years age group. Males generally showed higher rates than females with an overall ratio of 1·7:1 except in the 30–39 years age group where female rates were higher than males. Sixty-four deaths were reported between 1980 and 2009, giving an overall case-fatality rate of 5·1% (range 27% to 2%) (Fig. 7). High case-fatality rates were recorded in 1982 and 1996. The high case-fatality rate in 1982 may have resulted from under-reporting of cases with three deaths occurring in the 11 laboratory-proven cases.
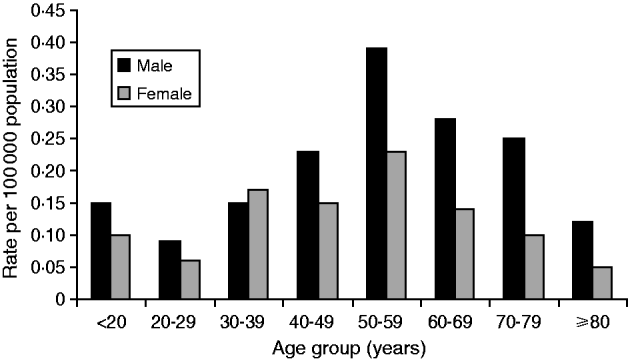
Fig. 6. Age and sex distribution of laboratory-proven confirmed cases of legionellosis/100 000 population, 1980–2009.
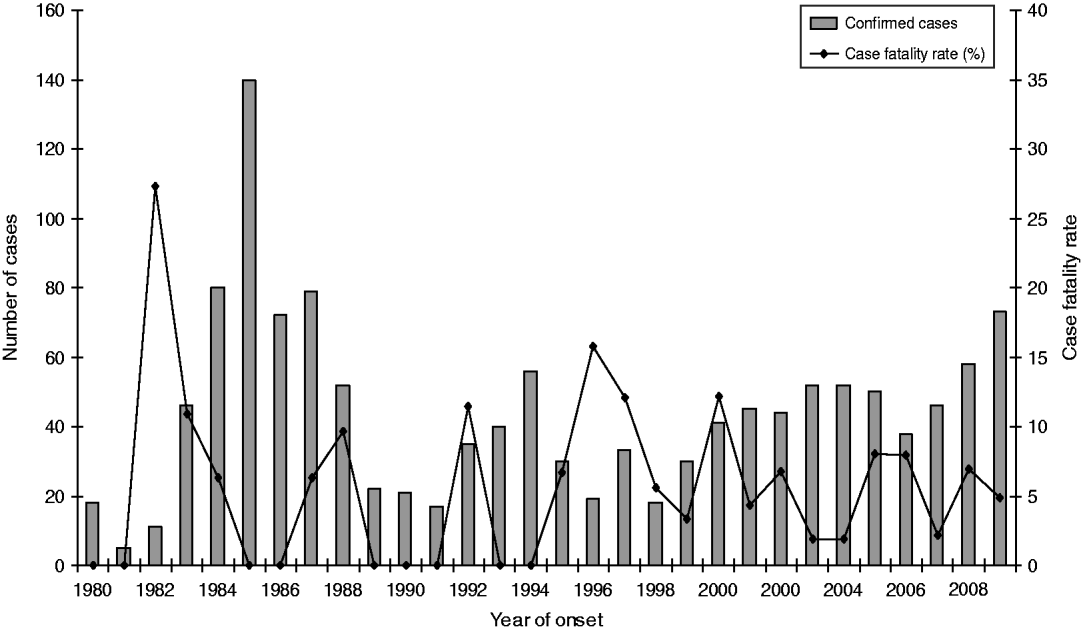
Fig. 7. Laboratory-proven confirmed case numbers and case-fatality rate of legionellosis, 1980–2009.
Age-standardized rate of legionellosis for European, Māori, Pacific and Other ethnicities are shown in Table 2. Ethnicity data was only available from 1996 and the actual number of confirmed cases and age-incidence rates of the four ethnic groups are shown in Appendix Table A2. The dataset was divided into two 7-year periods (1996–2002 and 2003–2009) to ascertain whether there was any difference in incidence rates. The age-standardized rates increased slightly for all ethnicities over the two 7-year periods. The IRR also showed very little fluctuation with a slight increase in Pacific people.
Table 2. Legionellosis case number and incidence rate by ethnicity, New Zealand, 1996–2002 and 2003–2009

IRR, Incidence rate ratio; CI, confidence interval.
* Age-standardized rate per 100 000 standardized to the New Zealand population-age structure of the 2001 and 2006 census and World Health Organization standard population.
Seasonal distribution
National surveillance data between 1980 and 2009 consistently showed an increase in incidence of legionellosis during the late spring (September–November) and autumn (March–May) months, possibly representing increased exposure related to outdoor activities such as gardening and the use of compost (Fig. 8). This is reflected in a seasonal spike in cases caused by L. longbeachae often seen in spring.
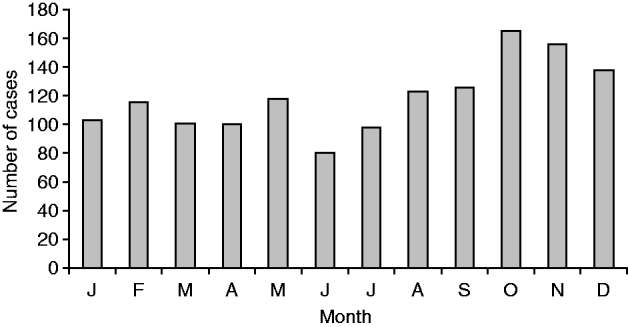
Fig. 8. Total of laboratory-proven confirmed cases (![]() ) for each month, 1980–2009.
) for each month, 1980–2009.
Outbreaks
Since 1990, 14 recorded outbreaks of legionellosis were identified (Table 3). There were no legionellosis outbreaks for laboratory-proven cases from 1991 to 1996 and in 2000, 2004, 2008 and 2009. L. pneumophila, L. longbeachae and L. dumoffii were identified as the most likely causes of these outbreaks. These outbreaks included a total of 70 cases since 1990. Either compost material or cooling towers were identified as the source for 66% of legionellosis outbreaks. The number of outbreaks is small and each involves low numbers of cases. Compost material has been identified as the environmental risk source in more outbreaks than cooling towers (five associated with compost compared to three associated with cooling towers). Although the case definition for an outbreak spans a 6-month time period for cases with exposure to the same environmental source, this has not impacted on the outbreak data due to none of the identified outbreaks involving cases separated in time by more than a month.
Table 3. Recorded outbreaks of legionellosis, New Zealand since 1990
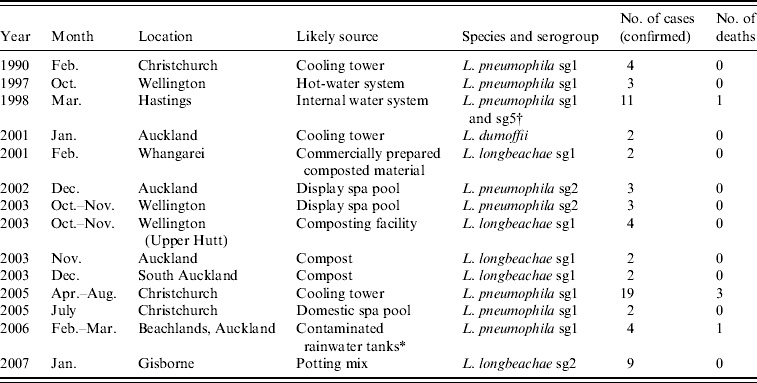
* Possibly from aerosols containing Legionella discharged into air from a marina water blaster [Reference Simmons42].
† Possibly Pontiac fever [Reference Maas, McElnay and Watson18].
DISCUSSION
This study used a combined dataset of legionellosis laboratory-proven and notified cases to give a comprehensive assessment of the epidemiology of this disease in New Zealand. To our knowledge this represents the longest time-series of legionellosis cases for a country in the medical literature. Previously published analyses of legionellosis epidemiology of a similar duration have been restricted to a particular country's province and evaluated laboratory-proven cases only [Reference Ng26].
This analysis of routinely collected data suggests that New Zealand has a higher rate of legionellosis than some other developed countries of similar temperate climate. Even when the probable cases are excluded from the total number of New Zealand laboratory-proven cases, the reported incidence of disease of 0·4/100 000 population for laboratory-confirmed cases was just slightly less than the USA of 0·5/100 000 population for the total number of cases reported for the same time period 1979–2009 [27].
Notified case numbers alone do not represent the true situation with legionellosis in New Zealand. This is demonstrated by the differences observed between health districts (although they range in population size and are either predominantly metropolitan or rural). The marked difference in the number of notifications for the Wellington region during the 1980s compared to other health districts should not be interpreted as being due to a greater incidence locally. Rather, it probably reflected the readiness of clinicians to consider and establish the diagnosis, the local availability of serology testing and laboratory staff examining any pertinent serum samples referred for serology [Reference Chereshsky and Collins28]. Conversely, the higher incidence rates in the eastern regions of the North Island namely Tairawhiti regions and South Island (Canterbury region) may well be reflective of the thriving horticultural industry and consequent widespread use of potting mix and compost as well as a warm and temperate climate (in New Zealand temperatures rarely fall below −10°C in inland alpine areas or rise above 30°C). For example, between 2000 and 2009 of the 167 laboratory-confirmed cases of L. longbeachae reported, 38·3% originated in these regions. The Tairawhiti region had the highest reported L. longbeachae annual incidence rate of 13·0/100 000 population followed by Canterbury (9·9/100 000 population).
The increasing number of cases proven in New Zealand each year since 1979 is probably attributable to two factors. First, an increasing awareness among physicians resulting in an increase in the number of specimens submitted to the national laboratory and second, the expansion of the battery of antigens used in the serology testing during the 1980s leading to an increasing number of positive cases. For example, up to August 1982 the antigens available were restricted to L. pneumophila serogroups 1–4. The battery of antigens were expanded to include L. pneumophila serogroups 5 and 6, L. bozemanae, L. dumoffii, L. gormanni, L. jordanis, L. longbeachae sg1 and L. micdadei by 1985 [Reference Chereshsky and Bettelheim29]. L. sainthelensi was added in 2008 following clinical isolation from two cases in 2007. There was not the full understanding of the IFA test specificity and sensitivity prior to 1988 with a lower cut-off value being used to determine positivity. In addition, some patients showing reactivity to multiple Legionella antigen pools in the IFA test were regarded as a positive case rather than a non-specific cross-reaction. This interpretation of the serology results has inflated case numbers in these years. For example in 1987 where a total of 276 patients were reported ‘presumptive positive’ on the basis of a single elevated antibody titre >128, using the current cut-off values about 50% of these would not fit the criteria to be regarded as a case.
The high case-fatality rate observed in 1982 has resulted from investigating the cause of death for these patients against a background of a low number of positive cases. The low number of positive cases that year is the result of low awareness of the availability of Legionella testing and the limited range of antigens available for testing either using DFA or IFA [Reference Chereshsky and Bettelheim29].
By 1985 New Zealand was testing against 11 different Legionella spp. out of the 14 known pathogenic species at that time [Reference Chereshsky and Bettelheim29]. This is reflected in the high number of confirmed cases for 1985 and 1986. During that same year there was considerable increase in interest in legionellosis possibly as a result of its high political profile when L. pneumophila was identified in the air-conditioning system in the New Zealand Parliamentary Executive building. This resulted in the publication in 1987 of The Code of Practice for the Control of Hygiene in Air and Water Systems in Buildings (New Zealand Standard 4302:1987) aimed at reducing the risk of Legionella in building water systems and updated in 2002 through building legislation. Such a change may have contributed to a reduction in legionellosis risk observed during the last two decades although there is empirical evidence that cooling towers are key contributors to sporadic cases [Reference Fields, Benson and Besser3, Reference Joseph, Ricketts, Heuner and Swanson8].
The marked increase in the number of laboratory-proven cases in 1987 was attributed to the increase in the number of hospital laboratories offering Legionella testing services. This followed the introduction at the National Health Institute (now ESR) in 1988 of Legionella serology training courses and to an intensive public health education programme [Reference Chereshsky and Collins28]. However, the large numbers of laboratory reported cases for 1987 and 1988 is likely due to an overestimation of the number of actual cases due to the interpretation of the antibody titre, i.e. different criteria being used to ascertain whether a case was positive or not. Prior to 1988 there were three categories – negative, probable or confirmed. Probable cases included those with elevated antibody titres in more than one antigen pool which may have resulted in the observed increase in incidence.
Since 1990 four categories have been used – negative, inconclusive, probable and confirmed. These are based primarily on serological findings for one or more serum samples from each case. A case is deemed ‘serologically negative’ when antibody titres in paired sera collected at least 3 weeks apart remain stable and ⩽256. A case is deemed ‘probable’ when an elevated antibody titre >256 is seen in one antigen pool and shows a clear serotyping pattern to one Legionella spp. for a single serum sample, or alternatively is PCR-positive with no further laboratory evidence. An ‘inconclusive’ result is based on elevated titres in more than two antigen pools (usually indicating a non-specific antibody cross-reaction in the IFA test), or where there is an unclear serotyping result when testing for the causative agent in the antigens of a reactive antigen pool. This tightening of the interpretation of serological titre results has led to a large reduction in ‘probable’ cases. This is also reflected in the large reduction of ‘unidentified’ species since 2000 (Fig. 3) due to surveillance data being significantly more aligned. This observation has been reported in other jurisdictions such as Denmark [Reference Rudbeck30].
The results derived primarily from serological investigations suggest that the distribution of Legionella spp. and serogroups do not necessarily follow patterns observed in other jurisdictions globally. Indirect evidence suggests that differences in diagnostic testing procedures are not primarily responsible for these observed patterns. For example, the uptake of diagnostic tests such as the urine antigen assay has not been predominant in New Zealand since it only detects Lpsg1. This is contrary to overseas where the urine antigen assay has become the method of choice for a diagnosis of Legionella infection and in some cases has been included in the case definition by some jurisdictions. As a result this has inadvertently caused a decrease in the use of other diagnostic tests such as culture to detect infection resulting in incomplete surveillance for legionellosis in many countries [Reference Fields, Benson and Besser3].
The burden of legionellosis in New Zealand falls most severely on older people although the importance of Legionella spp. should be considered in all age groups. Women in the <39 years age group rated high in this analysis reflecting a trend towards younger ages in recent times. This also highlights an important misconception that LD is a disease of older people that in turn may result in older people getting preferential treatment at the expense of children and younger people if it is not considered in the differential diagnosis [Reference Neil and Berkelman9]. The very small number of annual deaths made case-fatality rates difficult to interpret because they are subject to year-by-year variation. Other demographic characteristics such as ethnicity did not appear to affect the incidence rate of ethnicities other than European since it was observed to be much higher in Europeans that in other ethnicities possibly due to marked differences in life expectancy.
Legionellosis cases due to L. longbeachae infection form a significant number of those seen each year with the first case reported in 1984 when serological testing for the organism began. As seen in Figure 3, in some years cases caused by L. longbeachae are similar in number or more than those caused by L. pneumophila strains. This finding is similar to that seen in Australia, but is not seen in other jurisdictions in Europe and North America and suggests that the L. longbeachae strains found in New Zealand and Australia may be more virulent than strains elsewhere. Alternatively gardening practices or compost material may be intrinsically different, exposing more people to the pathogen.
Legionellosis appears more common during late spring and autumn months than at other times of the year and is consistent with other Southern Hemisphere jurisdictions, i.e. some Australian states with a temperate climate, such as New South Wales and Victoria, but not states with a tropical climate [Reference Li, O'Brien and Guest31]. This is also a similar characteristic of legionellosis epidemiology in the Northern Hemisphere to some degree; however, the seasonality appears to be summer–autumn, possibly a reflection in recent years of warmer and humid weather [Reference Karagiannis, Brandsema and van Der Sande32]. Such seasonal trends in New Zealand may suggest a greater seasonal influence on environmental reservoirs such as gardening potting mix and compost which may influence the degree of human risk [Reference Amodeo, Murdoch and Pithie33]. Legionella populations in cooling towers are also likely to be well established after the summer period [Reference Li, O'Brien and Guest31].
This analysis suggests that for New Zealand infection acquired abroad is not an important risk factor compared to Europe where 13·8% of detected legionellosis cases between 2000 and 2002 were linked to travel abroad [Reference Joseph34]. This is despite New Zealanders having among the highest per capita international travel rates in the world [35] with over 2 million resident New Zealanders departing New Zealand in 2008 [36]. The first confirmed case of travel-associated legionellosis from abroad of a New Zealand resident was reported in 1980 [Reference Wallace and Macdonald37]. Of note were two travel-associated cases confirmed in 2001 which were linked to the largest documented legionellosis outbreak in Australasia to date [Reference Greig38]. The reported source on this occasion was a cooling tower at the Melbourne aquarium, reflecting the popularity of Australia as a destination for New Zealand tourists more than the absolute risk of infection.
Most legionellosis infections in New Zealand occur as sporadic cases and not in outbreaks. The first outbreak in 1990 was associated with a Christchurch cooling tower [Reference Mitchell39] although it is possible that legionellosis could have been responsible for an outbreak of acute respiratory illnesses observed in June 1985 in Wellington (New Zealand's capital) [Reference Chrisp40]. In 1989 it was postulated that the majority of Lpsg1 present in New Zealand was not of the virulent Pontiac type providing a possible explanation for the apparent absence of outbreaks of LD [Reference Chereshsky and Collins28]. However, results of a survey of 11 cooling towers in buildings carried out in 1998 in Wellington contradicted this. Water samples from 8/11 cooling towers tested positive for Lpsg1 Pontiac strain. Despite the small number of samples, this survey indicated the significant presence of this particular strain in the New Zealand environment [Reference Chereshsky and Collins28].
Currently New Zealand's largest outbreak occurred in Christchurch in 2005 where the source once again was thought to have been a cooling tower that returned a positive result after spatial analysis identified geographical clusters. The infecting organism in all cases was Lpsg1 [Reference Pink41]. This outbreak also marked the first occasion that sequence-based typing (SBT) was used in New Zealand for the retrospective epidemiological typing of Lpsg1 isolates from both clinical and environmental sources associated with an outbreak [Reference Harte22]. The SBT profiles showed the same strain of Lpsg1 isolated from cases had persisted in a particular cooling tower for the length of the outbreak period. As a result SBT is rapidly becoming the method of choice for typing Lpsg1 isolates in outbreaks in New Zealand. In 2006 SBT was used again to identify a possible source in an Auckland outbreak where a marina water blaster may have seeded roof-collected rainwater systems in a suburb some 4 km away [Reference Simmons42].
The first suspected outbreak of Pontiac fever in New Zealand occurred during March 1998 in an office building in Hastings although no clear causative agent was identified [Reference Maas, McElnay and Watson18]. In January 2007 the first documented outbreak of Pontiac fever due to L. longbeachae sg2 in potting mix was reported. This outbreak would not have been apparent by legionellosis UAT as it does not detect L. longbeachae. For this reason it is suspected that the number of people with Pontiac fever in areas with a high use of potting mix may be underestimated [Reference Cramp16].
One of the limitations associated with research of this nature is that there is no universally accepted clinical case definition for LD and Pontiac fever. This means interpretation and comparison of surveillance data from New Zealand with other countries may be problematic because of the differences in case definitions and types of surveillance systems. The opportunity to carry out surveillance using an internationally consistent case definition has been recognized by the New Zealand Ministry of Health.
The use of routine notification data for monitoring and surveillance can have limitations due to incomplete data on some variables, for example ethnicity was not recorded in 104 (14·5%) of notified cases (n=717) between 1996 and 2009. Moreover, because we used the Statistics New Zealand prioritized ethnicity approach for both the numerator and denominator it is possible there were multiple responses. While EpiSurv has been developed to record patient-identified ethnicity this may not happen consistently, particularly in a hospital setting where the person is too ill to be interviewed by a health professional who may gain their knowledge of the patient through the front sheet of a hospital record.
CONCLUSION
Legionellosis remains an important cause of pneumonia in New Zealand and should continue to be part of the differential diagnosis for any patient admitted with severe pneumonia. While observed legionellosis epidemiology was similar to that described by other jurisdictions, the apparent high incidence rate and wide diversity of Legionella spp. identified from both clinical and environmental isolates is suggestive that the epidemiology of legionellosis in New Zealand is distinctive. Of particular note are L. longbeachae infections which contribute significantly to the number of sporadic cases annually and have also been associated with a number of outbreaks, including a large outbreak in 2007. While a SBT system has been developed for Lpsg1 and has been identified as a valuable epidemiological tool for determining the genetic relatedness of these strains in an outbreak setting, there are no similar tools currently available for L. longbeachae. With the recent publication of the complete genome sequence of a L. longbeachae isolate, this information will be useful in the development of these typing methods for this strain. The method would have utility in the source-tracing of this particular species of Legionella.
The advancement of test methodologies, our use and interpretation of the results generated by them and changing case definitions over the past 30 years has influenced the epidemiological trends seen. Comparisons with other jurisdictions must be interpreted with caution due to differences in case definitions and testing methodologies used.
ACKNOWLEDGEMENTS
The authors thank Peter Day, GeoHealth Laboratory, University of Canterbury who assisted in the construction of the maps using ArcGIS. Frances Graham is a Ph.D. scholar funded by the New Zealand Ministry of Health.
Aspects of this work were based on data and information provided by the Institute of Environmental Science & Research Limited solely for the benefit of the Ministry of Health and Statistics New Zealand. However, the analyses, conclusions, opinions, and statements expressed herein are those of the authors, and do not necessarily represent the views or policy of the Institute of Environmental Science & Research Limited, the Ministry of Health, or Statistics New Zealand. The Ministry of Health does not assume any liability or responsibility for use of or reliance on the contents of this article.
DECLARATION OF INTEREST
None.
APPENDIX
Appendix Table A1. Legionellosis number and incidence rate by District Health Board, New Zealand, 1981–1990 and 2000–2009
Appendix Table A2. Legionellosis number and incidence rate by ethnicity and age group, New Zealand, 1996–2002 and 2003–2009

* Mean annual incidence rate per 100 000.
Age-standardized rate per 100 000, standardized to the New Zealand population age structure of the 2001† and 2006‡ census and World Health Organization world standard population.


