Osteoporosis is a major public health problem and a costly disease worldwideReference Johnell1–3. The number of hip fractures is predicted to double in the EU nations over the next 50 years3. From a nutritional point of view, both of the main bone-forming minerals, Ca and P, are important for bone health, but an overly ample P intake has been suggested to be deleterious to bone through increased parathyroid hormone (PTH) secretionReference Kärkkäinen and Lamberg-Allardt4–Reference Calvo, Kumar and Heath6, especially when dietary Ca intake is lowReference Calvo and Park7. Nevertheless, no controlled studies are available on the dual effects of high P and varying Ca intakes in human subjects. The objective of our study was thus to examine in healthy females whether the effects of P intake higher than the recommended RDA8 on bone and Ca metabolism diminish with increasing Ca intake. This study is a sequel to our recent study in which we demonstrated that P intake has adverse dose–response effects on Ca and bone metabolism in healthy young femalesReference Kemi, Kärkkäinen and Lamberg-Allardt9. We performed the present study with Ca and P doses normal and achievable in Western diets.
In many countries the dietary intake of P is 2- to 3-fold higherReference Gregory, Foster, Tyler and Wiseman10–Reference Gronowska-Senger and Kotanska13than the recommended RDA for P intake8. Furthermore, the intake of P has risen during the last decades8, with an increasing intake from processed foods with phosphate-containing food additives; thus, the dietary intake in certain groups might be several grams per dayReference Suurseppä, Penttilä, Hentonen and Niemi14, even exceeding the upper reference limit of 4 g/d8. In addition, the total P intake is severely underestimated because the nutrition composition tables do not include P from phosphate-containing food additivesReference Oenning, Vogel and Calvo15, Reference Uribarri and Calvo16.
The importance of Ca in maintaining mineral homeostasis is well establishedReference Heaney17, Reference Welten, Kemper, Post and van Stavaren18, and epidemiological studies suggest that Ca supplements prevent osteoporosis and fracturesReference Shea, Wells, Cranney, Zytaruk, Robinson, Griffith, Ortiz, Peterson, Adachi, Tugwell and Guyatt19. While food fortification with CaReference Whiting and Wood20, Reference Heaney, Rafferty, Dowell and Bierman21 and Ca supplementationReference Kim, Han, Zhu and Keen22, Reference Radimer, Bindewald, Hughes, Ervin, Swanson and Picciano23 has increased, total dietary Ca intake still remains below nutritional recommendations in many countriesReference Henrix, Van Cauwenbergh, Robberrecht and Deelstra24–Reference Salamoun, Kizirian, Tannous, Nabulsi, Choucair, Deeb and El-Hajj Fuleihan28. However, to avoid elevated health risks, it should be remembered that the safe upper intake level for Ca is 2·5 g/d, and the lowest observed adverse effect level is 5·0 g/d8.
The hypothesis of adverse effects of high-P and low-Ca diets, i.e. diets with a low Ca:P ratio, originated from animal studies, where animals fed with a low Ca:P ratio diet manifested secondary hyperparathyroidism, loss of bone and osteopeniaReference Calvo and Park7. These were associated with increased PTH secretion and decreased serum Ca concentration. In addition, in a recent animal study by Koshihara et al. Reference Koshihara, Katsumata, Uehara and Suzuki29, a high Ca:P ratio was found to be favourable for bone mineralization in adult rats. Also, in a cross-sectional study in human subjects, Basabe et al. Reference Basabe, Mena, Faci, Aparicio, Lopez and Ortega30 concluded that high Ca consumption (>1000 mg/d) and a Ca:P ratio exceeding 0·74 are associated with better bone mineral densities in young females. These findings are in accord with earlier epidemiological studies in human subjectsReference Metz, Anderson and Gallagher31, Reference Teegarden, Lyle, McCabe, McCabe, Proulx, Michon, Knight, Johnston and Weaver32. In our recent controlled short-term study in healthy females, we demonstrated that dietary P has dose-dependent effects on Ca and bone metabolism by increasing S-PTH and bone resorption and decreasing bone formationReference Kemi, Kärkkäinen and Lamberg-Allardt9. In the present 24-h study, the dietary P intake was 2·5-fold higher than the current RDA8 but normal for a Western diet, and the same level as the highest dose in our previous studyReference Kemi, Kärkkäinen and Lamberg-Allardt9. We hypothesized that by increasing Ca intake the effects of higher P intake on Ca and bone metabolism would diminish.
Subjects and methods
Study subjects
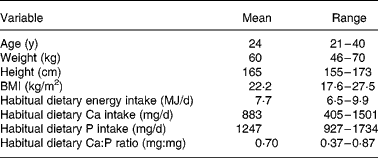
We recruited fifteen women aged 21–40 years from among the students and employees of the University of Helsinki. Exclusion criteria were illnesses and medications affecting bone and mineral metabolism. Six of the subjects used oral contraceptives. The Ethical Committee of Public Health and Epidemiology in the Hospital district of Helsinki and Uusimaa approved the study protocol. Each subject gave her informed consent to the procedures, which were in accord with the Helsinki Declaration. Twelve women completed the study and three interrupted the study for personal reasons. The basic characteristics of the subjects are presented in Table 1.
Table 1 Basic characteristics of the study subjects (n 12)
Nutritional assessment
To estimate habitual energy and Ca and P intakes, we instructed the subjects on how to keep a 4-d food record, which included three weekdays and one weekend day. The subjects were advised to maintain their usual food intakes during this period and to record all foods and beverages immediately after consumption. We calculated subjects' usual dietary intakes with a computer-based program (DIET 32, version 1.22, Aivo Oy, Turku, Finland) based on the food composition database (Fineli) of the Finnish National Public Health Institute. Basic characteristics of the subjects' typical dietary intakes are shown in Table 1.
Study protocol
Attendance and instructions. Subjects attended three 24-h study sessions over a 1-month period, with at least one week between sessions. Before the subjects came to the research unit at 08.00 hours, they fasted overnight (12 h). We instructed subjects to refrain from alcohol consumption the day before the study day because alcohol consumption has been found to affect PTH secretionReference Laitinen, Lamberg-Allardt, Tunninen, Karonen, Tähtelä, Ylikarhi and Välimäki33. In addition, we advised subjects to maintain their normal milk and milk-product consumption a few days before the study day to keep baseline levels of Ca and bone markers as similar as possible at the beginning of each study day.
Study day meals. All of the study days' meals were identical for each subject on each study day. No additional meals or snacks were allowed, but water was provided ad libitum. The meals provided total energy of 8·4 MJ (2000 kcal), with a P content of 1850 mg and a Ca content of 480 mg/d. Meals were normal foods purchased from Finnish grocery stores, cooked and apportioned by the same person in the research unit on each study day. The subjects ate all meals except supper in the research unit. The distribution of Ca and P contents of the study day meals is presented in Fig. 1.The main P sources were meat products (32 %), grain products (19 %), milk products (17 %) and eggs (7 %).
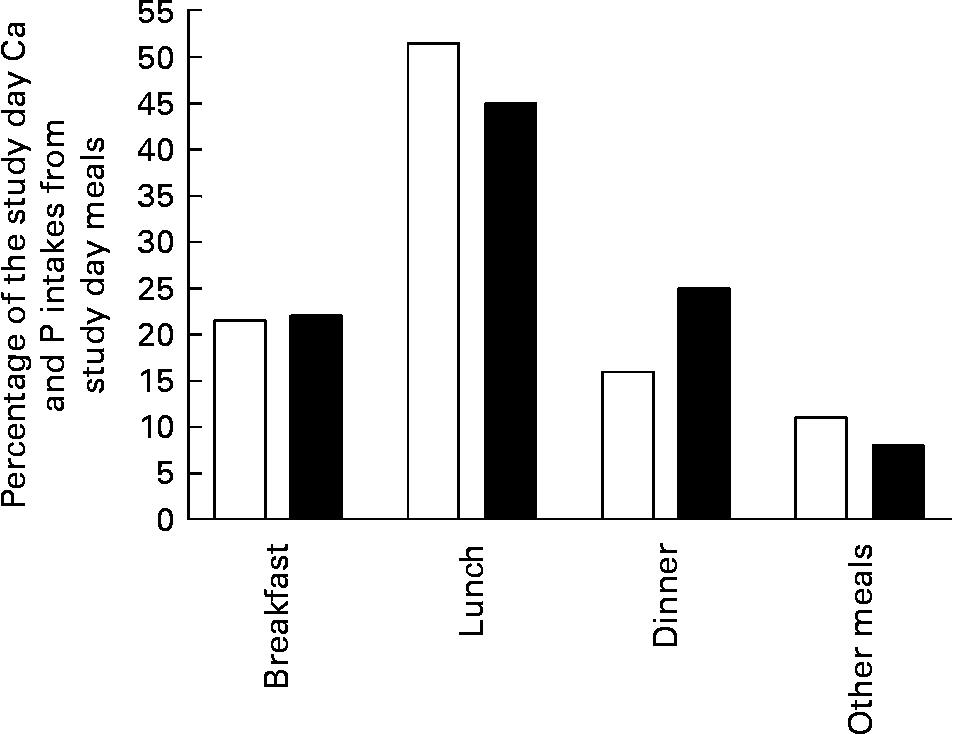
Fig. 1 Distribution of calcium (□) and phosphorus (■) content of study day meals.
Study design
We gave subjects 0 (control), 600 or 1200 mg Ca as a Ca supplement (CaCO3) widely available in Finland (Kalsium, Friggs, Oy Seege Ab, Helsinki, Finland) in 450 ml diluted sugar-free lemon juice (Fun Light Lemon, Felix Abba Oy Ab, Turku, Finland) during each of the three sessions. The order of the study sessions was randomized, and each subject served as her own control. The subjects received the Ca supplement in three separate equally sized doses, at 08.00 hours with breakfast after the first blood sample, at 12.00 hours with lunch after the second blood sample and at 17.00 hours with dinner. Snacks were served at 14.00 hours and supper at 20.00 hours. The study design is presented in Fig. 2. On each study day, the same person apportioned the sugar-free lemon juice with and without Ca supplement. Our study design included a control day, representing low Ca (480 mg) and 2·5-fold higher P (1850 mg) intake than the current RDA8, a 600 mg Ca day (AC), representing adequate Ca (1080 mg) and 2·5-fold higher P (1850 mg) intake than the current RDA8, and a 1200 mg Ca day (HC), representing high Ca (1680 mg) and P (1850 mg) intake 2·5-fold above the current RDA8. The total Ca intakes and the dietary Ca:P ratios of subjects throughout the three study days are presented in Table 2.
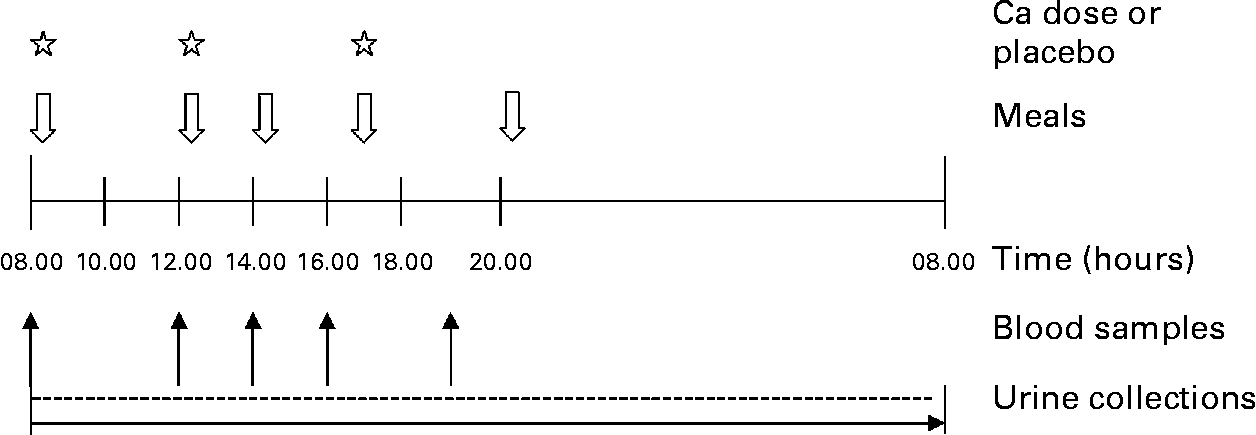
Fig. 2 Study design.
Table 2 Total calcium intake of study subjects (n 12) and calcium:phosphorus ratios on study days

* Intakes of P and Ca from study day meals were 1850 mg and 480 mg, respectively.
Sampling
At each study session, the first blood samples were taken anaerobically at 08.00 hours after a 12-h overnight fast. Subsequent blood samples were taken at 12.00, 14.00, 16.00 and 19.00 hours. On the study day, morning urine was voided and discarded at home. Subsequent urine was collected at the research unit, with a 24-h urine collection starting at 08.00 hours, when subjects arrived at the unit, and ending at 08.00 hours the following morning. Urine and separated serum samples were stored at − 20°C until analysed. The sampling procedure is presented in Fig. 2.
Laboratory methods
All samples from the same subject were analysed in the same assay in randomized order. The serum ionized Ca (S-iCa) concentration was analysed within 90 min of sample collection with an ion selective analyser (Microlyte 6, Thermo Electron Corporation, Vantaa, Finland). The S-iCa concentration has been shown to be stable within this time rangeReference Schenk, Chew and Brooks34. The intra-assay CV was 1·6 % for S-iCa. The serum phosphate (S-Pi), total serum Ca, serum creatinine, urinary Ca, urinary phosphate, and urinary creatinine were analysed spectrometrically with an autoanalyser (Konelab 20 automatic analyser, Thermo Electron Corporation). The intra- and interassay CV for these analyses were < 2·0 % and < 3·5 %, respectively. The serum intact PTH concentration was determined with an Allegro intact PTH kit (Nichols Institute, San Juan Capistrano, CA, USA); the intra- and interassay CV were 1 % and 4 %, respectively. Serum bone-specific alkaline phosphatase (S-BALP) concentration was analysed from control and HC blood samples with an enzyme immunoassay (MetraTM BAP EIA Kit, Quidel Corporation, San Diego, CA, USA); the intra- and interassay CV were 5·4 % and 7·4 %, respectively. The concentration of urinary N-terminal telopeptide of collagen type ? (U-NTx) was measured with an enzyme-linked immunosorbent assay using Osteomark® NTx Test kits (Ostex International, Inc., Seattle, WA, USA); the intra- and interassay CV were 4·0 % and 6·0 %, respectively.
Statistical analysis
We used an SPSS software program (version 10.0, SPSS Inc., Chicago, IL, USA) in a Windows environment for all statistical analyses. The data are expressed as means with their standard errors. We tested the normality of variables and used logarithmic transformations when necessary to normalize non-normal distributions. ANOVA with repeated measures was used to compare study periods. The effects of Ca doses were compared with the control session using contrast analysis. We regarded a P value ≤ 0·05 as significant.
Results
Baseline characteristics
The baseline characteristics of study subjects are presented in Table 1.
Nutrient intakes
The average dietary intake of Ca and P of study subjects (Table 1) corresponds to the average intake of Ca and P in Finnish femalesReference Männistö, Ovaskainen and Valsta12. Furthermore, the average dietary Ca:P ratio for study subjects was the same as the average ratio for Finnish femalesReference Männistö, Ovaskainen and Valsta12.
Markers of calcium and bone metabolism
A significant dose–response relationship was observed between S-iCa concentration and Ca intake (P < 0·001, ANOVA; Fig. 3). Compared with control, the HC increased S-iCa (P = 0·001, contrast analysis) more efficiently than did the AC (P = 0·02, contrast analysis). The S-iCa increased significantly when the total Ca intake increased from 1080 mg to 1680 mg (P = 0·03, contrast analysis). In addition, the S-iCa concentration dropped after 4 h from commencement of the study on the control day, while the concentration remained nearly constant on both the AC and HC days. However, the total serum Ca concentration did not differ significantly between study sessions (P = 0·35, ANOVA) (Table 3). No significant change was observed in S-Pi concentration due to increasing Ca doses (P = 0·6, ANOVA) (Table 3). However, the S-Pi increased above the normal reference limit (1·4 mmol/l) in eight of the twelve subjects on the control day, in six of the twelve subjects on the AC day and in four of the twelve subjects on the HC day.
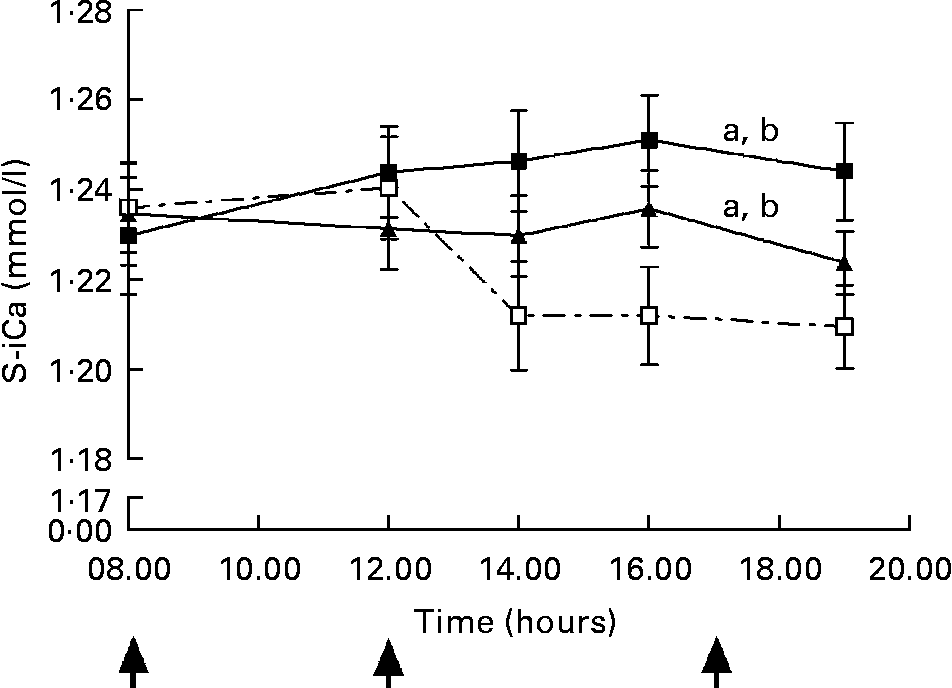
Fig. 3 Change in serum ionized calcium (S-iCa) concentrations during experiment days: control day (Ca intake 480 mg/d, ![]() ), 600 mg Ca dose (Ca intake 1080 mg/d, -▲-) and 1200 mg Ca dose (Ca intake 1680 mg/d, -■-). Values are means with their standard errors indicated by vertical bars. ↑ , Ca administration times. a P < 0·05 by ANOVA, repeated measure design. Mean values were significantly different from those of the control day (by contrast analysis): b P < 0·05.
), 600 mg Ca dose (Ca intake 1080 mg/d, -▲-) and 1200 mg Ca dose (Ca intake 1680 mg/d, -■-). Values are means with their standard errors indicated by vertical bars. ↑ , Ca administration times. a P < 0·05 by ANOVA, repeated measure design. Mean values were significantly different from those of the control day (by contrast analysis): b P < 0·05.
Table 3 Values of calcium and phosphorus metabolism markers in serum at five time points
(Values are means with their standard errors)

NS, not significant by ANOVA, repeated measures design.
The S-PTH concentration decreased in response to the Ca doses (P < 0·001, ANOVA) (Fig. 4). Contrast analysis revealed that the increase was equally significant on the AC and HC days (P = 0·001), though the mean percentage decrease of S-PTH was higher with the HC than the AC days at all time points. On the control day, when the Ca intake was low, six of the twelve subjects had S-PTH values above the upper reference limit (>65 ng/l). Furthermore, on the control day, changes in S-PTH differed from both the AC and the HC days between 14.00 hours and 19.00 hours. While the concentration almost returned to the baseline value at 19.00 hours in the AC and HC sessions, the S-PTH value continued to increase on the control day. The maximum difference in the mean S-PTH values were 2 h after the last Ca dose (at 19.00 hours) being 34 % (P < 0·001, AC, contrast analysis) and 40 % (P < 0·001, HC, contrast analysis) lower than the S-PTH at 19.00 hours in the control day.

Fig. 4 Change in serum parathyroid hormone (PTH) concentrations during experiment days: control day (Ca intake 480 mg/d, ![]() ), 600 mg Ca dose (Ca intake 1080 mg/d, -▲-) and 1200 mg Ca dose (Ca intake 1680 mg/d, -■-). Values are means with their standard errors indicated by vertical bars. ↑ , Ca administration times. a P < 0·05 by ANOVA, repeated measure design. Mean values were significantly different from those of the control day (by contrast analysis): b P < 0·05.
), 600 mg Ca dose (Ca intake 1080 mg/d, -▲-) and 1200 mg Ca dose (Ca intake 1680 mg/d, -■-). Values are means with their standard errors indicated by vertical bars. ↑ , Ca administration times. a P < 0·05 by ANOVA, repeated measure design. Mean values were significantly different from those of the control day (by contrast analysis): b P < 0·05.
The 24-h urinary phosphate decreased in relation to the Ca doses (P = 0·005, ANOVA) (Fig. 5). HC decreased phosphate excretion more efficiently (P = 0·002, contrast analysis) than AC (P = 0·089, contrast analysis). The 24-h urinary-Ca excretion significantly increased with the Ca doses (P = 0·004, ANOVA) (Fig. 5). Urinary Ca increased by 38 % with AC (P = 0·12, contrast analysis) and by 58 % with HC (P = 0·001, contrast analysis).
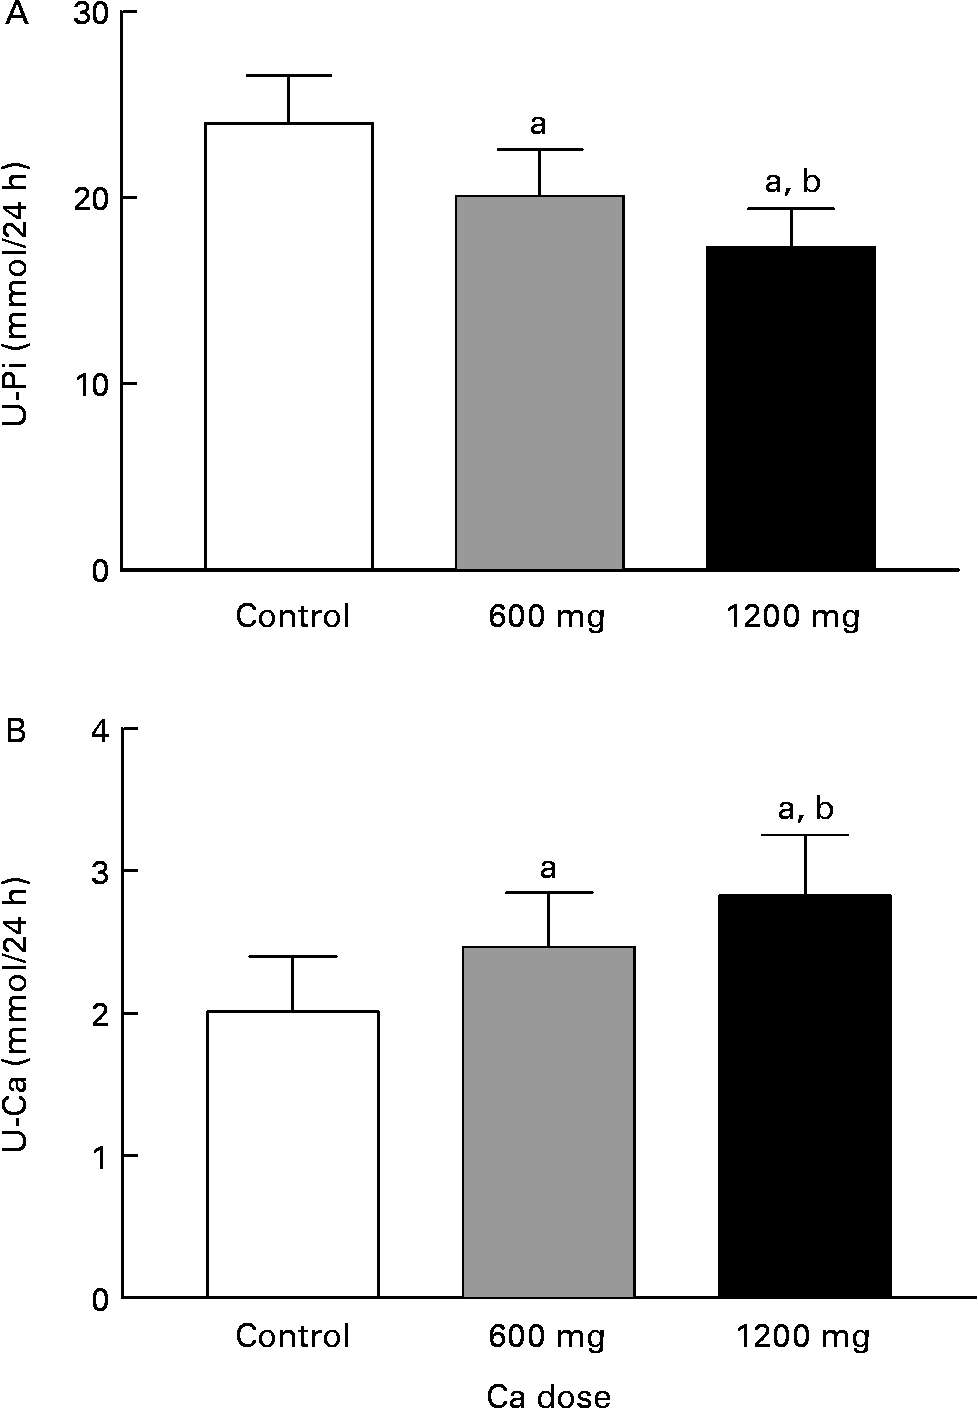
Fig. 5 The 24-h urinary phosphate (U-Pi; A) and urinary calcium (U-Ca; B) excretion during experiment days:. Values are means with their standard errors indicated by vertical bars. a P < 0·05 by ANOVA, repeated measure design. Mean values were significantly different from those of the control day (by contrast analysis): b P < 0·05. U-Pi 1 mmol/24 h = 30·93 mg/24 h, U-Ca 1 mmol/24 h = 40·08 mg/24 h.
The bone formation marker, S-BALP, did not differ significantly from the control day (P = 0·4, ANOVA), although there was a trend to decreased bone formation in the HC day compared with the control day (Fig. 6). By contrast, the bone resorption marker, the 24-h excretion of U-NTx corrected for creatinine excretion (U-NTx:urinary creatinine), was affected by the Ca doses (P = 0·008, ANOVA) (Fig. 6). The excretion of U-NTx diminished significantly with both Ca supplement doses (P = 0·009 and P = 0·02 for AC and HC, respectively, contrast analysis) being 14 % lower in the AC day, and 17 % lower in the HC day than in the control day.
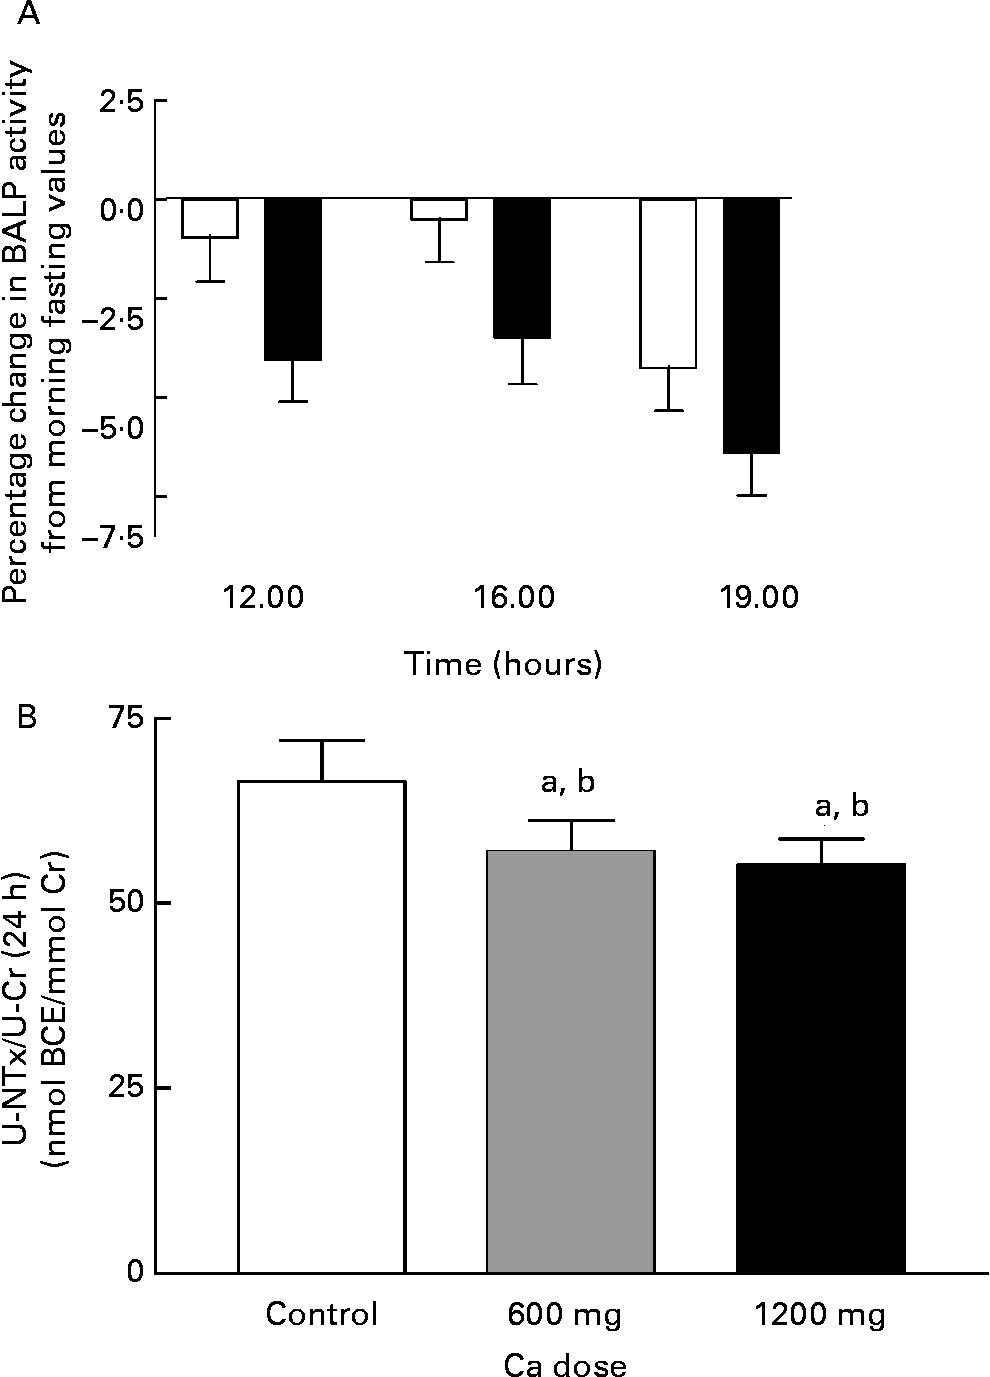
Fig. 6 Change in serum bone-specific alkaline phosphatase (BALP) activity from morning fasting values (A) and the 24-h urinary excretion of N-terminal telopeptide of collagen type I corrected for creatinine excretion (NTx:Cr) (B) during experiment days: control day (□), 600 mg Ca dose (![]() ) and 1200 mg Ca dose (■). Values are means with their standard errors indicated by vertical bars. a P < 0·05 by ANOVA, repeated measure design. Mean values were significantly different from those of the control day (by contrast analysis) b P < 0·05. BCE, bone collagen equivelents.
) and 1200 mg Ca dose (■). Values are means with their standard errors indicated by vertical bars. a P < 0·05 by ANOVA, repeated measure design. Mean values were significantly different from those of the control day (by contrast analysis) b P < 0·05. BCE, bone collagen equivelents.
All subject's blood samples consistently showed serum creatinine values within the normal reference range (60–115 μmol/l). Serum creatinine analysis was performed to ensure that none of the subjects had kidney disease, which could affect study results.
Discussion
The findings of the present study support our hypothesis that high Ca intake may not be sufficient to overcome adverse effects of high dietary P intake on Ca and bone metabolism within 24 h. Oral Ca supplement doses (600 and 1200 mg) suppressed both S-PTH and bone resorption (U-NTx) in a dose-dependent manner. To our knowledge, we demonstrated for the first time with this kind of study design the decrease in S-PTH concentration. However, even high Ca intake (in total 1680 mg/d) could not change the bone formation activity, which has been demonstrated to decrease due to high P intake in healthy femalesReference Kärkkäinen and Lamberg-Allardt4, Reference Kemi, Kärkkäinen and Lamberg-Allardt9. It is noteworthy that the P intake (1850 mg/d) corresponds to the average estimated dietary intake in Western countries and all ingested P origins in normal foods. The intake of Ca (1080 and 1680 mg/d), in turn, is beyond the reach of Western diets in many countriesReference Henrix, Van Cauwenbergh, Robberrecht and Deelstra24–Reference Salamoun, Kizirian, Tannous, Nabulsi, Choucair, Deeb and El-Hajj Fuleihan28.
PTH is a major regulator of Ca and bone metabolism, and continuous excessive PTH secretion increases bone turnoverReference Tam, Heersche, Murray and Parson35, Reference Schiller, Dippolito, Roos and Howard36. Dietary P has been found to increase S-PTH levels, by decreasing S-iCa concentrationReference Herfarth, Schmidt-Gayk, Graf and Maier37 and by directly affecting PTH secretionReference Slatopolsky, Finch, Denda, Ritter, Zhong, Dusso, MacDonald and Brown38, probably through the Na/Pi co-transporter in the parathyroid glandsReference Miyamoto, Tatsumi, Segawa, Morita, Nii, Fujioka, Kitano, Inoue and Takeda39. While P intake increases S-PTH concentration, Ca administration has been demonstrated to decrease S-PTH concentration in young adultsReference Kärkkäinen, Lamberg-Allardt, Ahonen and Välimäki40, Reference Sadideen and Swaminathan41and the elderlyReference Woo, Swaminathan, Lau, MacDonald, Pang and Nordin42 through an increase in S-iCaReference Herfarth, Schmidt-Gayk, Graf and Maier37. Our results showed S-PTH concentration to decrease with increasing Ca intake, indicating that Ca supplementation can reduce the rise in PTH levels, induced by higher dietary P intake. Furthermore, S-PTH concentration was above the upper reference limit (>65 ng/l) in 50 % of subjects on the control day (Ca 480 mg, P 1850 mg), suggesting adverse effects of the low dietary Ca:P ratio on S-PTH. In our recent controlled study in healthy females, we demonstrated that S-PTH increased in a dose-dependent manner with P intakeReference Kemi, Kärkkäinen and Lamberg-Allardt9. These results are in accord with several studies in animalsReference Calvo and Park7 and human subjectsReference Kärkkäinen and Lamberg-Allardt4–Reference Calvo, Kumar and Heath6, Reference Reiss, Canterbury, Bercovitz and Kaplan43–Reference Brixen, Nielsen, Charles and Mosekilde45. In the long run, high dietary P intake can lead to secondary hyperparathyroidism, especially when the dietary Ca intake is inadequateReference Calvo and Park7.
Ca supplementation decreased bone resorption, as indicated by the excretion of U-NTx:urinary creatinine. In earlier Ca administration studies, increased Ca intake was found to decrease bone resorption in young adultsReference Kärkkäinen, Lamberg-Allardt, Ahonen and Välimäki40, Reference Sadideen and Swaminathan41and male athletesReference Guillemant, Accarie, Peres and Guillemant46, while the effects of P on bone metabolism have been demonstrated to be just the opposite in P studiesReference Kärkkäinen and Lamberg-Allardt4, Reference Kemi, Kärkkäinen and Lamberg-Allardt9and a study with high P–low Ca dietsReference Calvo, Kumar and Heath5. In our recent P study, we noted that bone resorption (U-NTx:urinary creatinine) increased when P intake was high (1995 mg/d) and Ca intake was very low (250 mg/d)Reference Kemi, Kärkkäinen and Lamberg-Allardt9. In the present study, the decrease in bone resorption indicates that Ca supplementation diminished the effects of P intake higher than the recommended8. In the study of Grimm et al. Reference Grimm, Muller, Hein, Funfstuck and Jahreis47 with ten healthy young females, the intake of P (3008 mg) increased the excretion of urinary pyridinoline and deoxypyridinoline by over 80 %, despite Ca intake being very high (1995 mg). However, the increase was not statistically significant due to the large standard deviation and the low number of subjects.
Although bone resorption decreased, we found no significant changes in bone formation, as indicated by S-BALP activity. In earlier studies, the effects of P intake on bone formation markers have been contradictory, with bone formation markers showing a decrease (S-BALP, serum procollagen type I carboxyterminal peptide, osteocalcin)Reference Kärkkäinen and Lamberg-Allardt4, Reference Grimm, Muller, Hein, Funfstuck and Jahreis47, an increase (osteocalcin)Reference Brixen, Nielsen, Charles and Mosekilde45 or no change (osteocalcin)Reference Calvo, Kumar and Heath6. Previous studies examining the effects of Ca on bone formation have also yielded inconsistent findingsReference Kärkkäinen, Lamberg-Allardt, Ahonen and Välimäki40. In our recent short-term study, we found that S-BALP activity decreased with increasing P dosesReference Kemi, Kärkkäinen and Lamberg-Allardt9. In the present work the P intake was maintained at the same level (1850 mg/d) on each experiment day, and the effect of at this level of P intake on bone formation was presumably seen as a constant bone formation rate despite the varying dietary Ca intake. Thus, one possible explanation for our present findings is that high Ca intake cannot counteract the effects of P intakes higher than recommended8, even though Ca supplementation seems to decrease bone resorption. If this interpretation is correct the effects of the increasing intake of dietary P on bone may be as alarming as previously summarized by Uribarri and CalvoReference Uribarri and Calvo16 as well as SaxReference Sax48. One may question whether we were able to detect changes in bone formation by measuring BALP activity since the half-life of BALP is 1–2 dReference Posen and Grunstein49. However, one report indicates that BALP activity declines just 1 h after oral administration of 1-α-hydroxyvitamin D in peritoneal dialysis patientsReference Joffe, Ladefoged, Cintin, Jensen and Hyldstrup50. Furthermore, in physiological situations, PTH infusion can decrease BALP activity within 12 hReference Hodsman, Fraher, Ostbye, Adachi and Steer51.
S-iCa concentration increased in a dose-dependent manner with increasing Ca doses, but the increase was not reflected in total serum Ca concentration. In previous studies, a high intake of P decreased S-iCa concentration in femalesReference Kärkkäinen and Lamberg-Allardt4–Reference Calvo, Kumar and Heath6, Reference Kemi, Kärkkäinen and Lamberg-Allardt9and malesReference Portale, Halloran and Morris52. However, Grimm et al. Reference Grimm, Muller, Hein, Funfstuck and Jahreis47 reported that S-iCa concentration did not change even with 3000 mg P, probably due to the very high Ca content (1995 mg) of the diet. The mechanism underlying the impact of P on S-iCa remains unknown. In a Ca administration study, a Ca load as small as 250 mg was demonstrated to increase S-iCaReference Kärkkäinen, Lamberg-Allardt, Ahonen and Välimäki40. In the present study, the lower the Ca:P ratio, the lower the S-iCa concentration and the higher the S-PTH concentration. However, this is hardly explained by only changes in Ca intake. Until recently, PTH secretion was believed to be mainly regulated by changes in S-iCa and 1,25-dihydroxyvitamin D, but there is evidence, which indicates that P per se increases PTH secretionReference Slatopolsky, Finch, Denda, Ritter, Zhong, Dusso, MacDonald and Brown38.
We found no significant differences in S-Pi concentration, which was understandable as the P intake was constant on each study day. However S-Pi was higher than the normal reference limit (1·4 mmol/l) in several study subjects on the control day and on both AC and HC days. The lower the Ca intake, the more often S-Pi exceeded the upper reference limit. These findings suggest that P absorption diminished with increasing Ca intake but insufficiently to prevent excessive S-Pi concentrations. In studies where Ca intake has been adequate (1000 mg) or high (1995 mg), high P intake has not increased S-Pi concentration significantlyReference Grimm, Muller, Hein, Funfstuck and Jahreis47, Reference Whybro, Jagger, Barker and Eastell53. This is probably due to diminished P absorption because of the formation of calcium phosphate complex in the gut. However, contradictory reports exist of the effects of P on Ca absorptionReference Spencer, Kramer and Osis54–Reference Heaney and Recker56, and relatively few studies are available. Spencer et al. Reference Spencer, Kramer, Osis and Norris57 found that 800–2000 mg P doses did not affect Ca absorption in adults. Ca, on the other hand, has been shown to decrease P absorptionReference Heaney and Nordin58.
S-Pi is mainly controlled by changes in urinary phosphate excretionReference Murer, Forster, Hernando, Lambert, Traebert and Biber59, Reference Murer, Hernando, Forster and Biber60. Oral Ca intake (CaCO3) has been demonstrated to diminish phosphate excretionReference Mortensen and Charles61. This is due to increased S-iCa concentration, which in turns decreases S-PTH concentration and leads to lower phosphate excretion, even without any alterations in P intakeReference Mortensen and Charles61. In this study, we found that urinary phosphate excretion decreased with increasing Ca intake. The influence of Ca intake was also seen in the excretion of Ca, which increased in a dose-dependent manner. Because P intake was maintained at exactly the same level for all study day, the dose–response effect of Ca on phosphate and Ca excretion could be determined. Due to the short period of the study, we did not collect faecal samples, and thus, could not detect loss of Ca and P in faeces.
In summary, when P intake is above the dietary guidelines (700 mg/d)8, oral Ca intake decreases S-PTH concentration and bone resorption which both have been induced by increased P intakeReference Kemi, Kärkkäinen and Lamberg-Allardt9. Dietary P dose-dependently acutely decreases bone formationReference Kemi, Kärkkäinen and Lamberg-Allardt9, but we found that in the present acute study even high Ca intake (in total 1680 mg/d) did not counteract this effect of dietary P intake, as indicated by unchanged bone formation activity. Our results suggest that higher doses of Ca than those used in our study are needed to prevent the effect of higher P intake, although lower doses also offer several favourable effects. Our findings further indicate that concerns regarding P consumption, especially in the Western world, are warranted. Future challenging tasks are to update the food composition tables and to determine the actual P contents of foods, including phosphate-containing food additives. Moreover, this study suggests that it is not only the Ca intake but also the dietary Ca:P ratio that matters. Additional studies are needed to confirm whether these findings persist over longer periods of time. Attention should be focused on decreasing P intake, as in many countries the recommended Ca intake level seems to be very difficult to achieve.
Acknowledgements
This study was financially supported by grant 40 075/01 from Tekes, the National Technology Agency of Finland and the Juho Vainio Foundation. We thank all volunteers for their participation. Contributors C. J. E. L-A., M. U. M. K. and V. E. K. designed the study. V. E. K. recruited study subjects and conducted the experiment work. M. U. M. K. and H. J. K. did the laboratory analysis. V. E. K., M. U. M. K. and H. J. K. carried out the statistical analysis. V. E. K. wrote the manuscript and C. J. E. L-A., K. A. E. L., H.J.K and M. U. M. K. participated in the critical revision of the paper. C. J. E. L-A. was the principal investigator, who supervised aspects of the whole study, while K. A. E. L. was the principal manager of the study. None of the contributing authors had any financial or personal interests any of the bodies sponsoring this research.


