


Introduction
Snapmelon (Cucumis melo L. var. momordica [Roxb.], 2n = 2x = 24) belonging to the family cucurbitaceae is indigenous to India where it is generally known as ‘phut’ (means to split) as it gets cracked after ripening. Among cucurbits it is considered as minor crop, grown in different states of India, i.e. Punjab, Bihar, Uttar Pradesh, Haryana, Rajasthan and Delhi. Plants are monoecious, and fruit rind colour varies from creamish, yellowish, to orange. Snapmelon fruits are rich source of iron, calcium and vitamin C (Goyal and Sharma, Reference Goyal and Sharma2009).
The yield potential of snapmelon has been largely affected due to different abiotic and biotic stresses but generally exhibits good resistance against diseases (Dhillon et al., Reference Dhillon, Singh, Fergany, Monforte and Sureja2009, Reference Dhillon, Singh, Pitrat, Monforte and McCreight2014). However, the gene pool of snapmelon has not been explored much with respect to the drought stress tolerance. Previously, Dhillon et al. (Reference Dhillon, Monforte, Pitrat, Pandey, Singh, Reitsma, Garcia-Mas, Sharma and McCreight2013) reported highly drought-tolerant accession RSM-50 of snapmelon as compared to Reticulatus group lines. Snapmelon landraces of coastal and arid regions of India (Odisha, Kerala, Karnataka, Andhra Pradesh, Gujarat, Tamil Nadu, Uttar Pradesh and Rajasthan) are possible resources of novel drought, salt and heat tolerance germplasm.
Different crop genotypes having drought tolerance have been reported (Fleury et al., Reference Fleury, Jefferies, Kuchel and Langridge2010), but little information is available for snapmelon (Dhillon et al., Reference Dhillon, Monforte, Pitrat, Pandey, Singh, Reitsma, Garcia-Mas, Sharma and McCreight2013; Bhargava et al., Reference Bhargava, Gurjar, Haldhar, Singh and Sharma2016). Similar to other vegetables crops, snapmelon plants are susceptible to drought stress probably due to their broad leaf area which results in more water transpiration, as reported by Penella et al. (Reference Penella, Nebauer, San Bautista, López-Galarza and Calatayud2014) in pepper. In broad-spectrum, snapmelon production and productivity are largely affected due to the drought and other abiotic stresses (Dhillon et al., Reference Dhillon, Singh, Pitrat, Monforte and McCreight2014).
Reactive oxygen species (ROS) are indispensable for controlling the fundamental cellular activity although their increased generation results in oxidative stress. Enhanced ROS generation under different abiotic stresses results in alteration of cell homeostasis (Lima et al., Reference Lima, Andrade, Santos, Morais, Martins, Mutz, Nascimento, Marchiori, Lopes and Guilherme2023); however, it additionally functions as inducer of signal for abiotic and biotic stress tolerance responses. To cope with oxidative stress caused by ROS, plants express enzymatic and non-enzymatic antioxidative agents such as superoxide dismutase (SOD), ascorbate peroxidase (APX), guaiacol peroxidase (POD), catalase (CAT) and glutathione reductase (GR), and carotenoids, glutathione (GSH), ascorbate and tocopherol antioxidants (Rai et al., Reference Rai, Rai, Rathaur, Kumar and Singh2013). Increased expression of these enzymes positively regulates the drought stress by scavenging the ROS. The relatively high transcript level of APX, CAT, GR, POD and cyt-SOD, and the enzymes of glutathione-ascorbate cycle (Foyer–Halliwell–Asada pathway) revealed their importance in enzymatic ROS degradation (Mishra et al., Reference Mishra, Jiang, Chen, Paul, Chatterjee and Shen2023).
Previously, our research revealed the potential of indigenous Indian muskmelon's genetic materials for different traits (Ansari et al., Reference Ansari, Atri, Singh, Kumar and Pandey2018). The present study was undertaken to reveal the varied responses of different indigenous snapmelon genotypes through exploring their inherent capability at various physiological, biochemical and molecular changes, under different water stress condition to them.
Materials and methods
Plant materials, experimental design
Four different snapmelon genotypes: BAM-VR-311, BAM-VR-312, BAM-VR-314 and BAM-VR-316, were selected. The present study was carried out during the month of March to May, 2017 and 2018, in the experimental farm of ICAR-Indian Institute of Vegetable Research at latitude and longitude of 25.10°N and 82.52°E, respectively, and 128.98 m above sea level at Varanasi (an Eastern Indo-Gangetic Plain of India), Uttar Pradesh, province of India. Snapmelon genotypes were grown in a pot and treated for water deficit (WD) under glasshouse conditions for 7, 14 and 21 d, keeping one set as control with regular irrigation. On completing 0, 7, 14 and 21 d drought stress treatment, 6–7th fully expanded leaf sample was collected with the help of N2 and stored at −80°C to analyse biochemical and molecular parameters in triplicates.
Relative water content (RWC) and electrolyte leakage (EL)
RWC and EL were recorded as per Khare et al. (Reference Khare, Goyary, Singh, Shah, Rathore, Anandhan, Sharma, Arif and Ahmed2010). To analyse the RWC, fresh weight (FM) of 12 leaf discs was taken. Further the fresh tissues were kept in petri plate filled with water for rehydration for 6 h until it gets fully turgid, surface-dried and then weighed (turgid mass [TM]), consequently dried in oven at 80°C for 24 h, and reweighed (DM). The RWC was measured according to the formula: RWC [%] = [(FM – DM)/(TM – DM)] × 100. Using a conductivity meter (CM-180, Elico, India), EL was measured, 12 leaf discs were soaked in 20 ml of Milli Q water and their conductance was recorded after 4 h at room temperature (a) and then autoclaved at 121°C for 30 min and EL recorded (b). The EL was recorded according to the formula: EL [%] = a/b × (100).
Net photosynthetic rate, stomatal conductance and chlorophyll (Chl) fluorescence
The net photosynthetic rate (Pn) and stomatal conductance (Gs) were recorded with a portable photosynthetic system (LI 6400, LICOR, Lincoln, NE, USA) following our previous protocol (Ansari et al., Reference Ansari, Atri, Singh, Kumar and Pandey2018). Portable Handy Plant Efficiency Analyser (Hansatech Instruments, King's Lynn, Norfolk, UK) was utilized to record the photosynthetic efficiency (F v/F m) and calculation was performed as per the protocol we used in our previous study (Ansari et al., Reference Ansari, Atri, Singh, Kumar and Pandey2018).
Photosynthetic pigments
The chlorophyll and carotenoid concentrations were measured according to the method described by Lichtenthaler and Buschmann (Reference Lichtenthaler and Buschmann2001). Chlorophyll and carotenoid concentrations (mg/g [DM]) were measured as per the formula:

Estimation of H2O2, lipid peroxidation, proline and phenol
The hydrogen peroxide (H2O2) concentrations were measured as per Jana and Choudhury (Reference Jana and Choudhury1981). In the term of malondialdehyde estimates (MDA), lipid peroxidation measurement was done through thiobarbituric acid reaction as per the methodology described by Heath and Packer (Reference Heath and Packer1968). The proline concentrations were measured in fresh leaf samples (200 mg), and the absorbance was recorded at 520 nm (Bates et al., Reference Bates, Walden and Teare1973). Whereas phenol content in leaf tissues was measured as per the method described by Khokhar and Magnusdottir (Reference Khokhar and Magnusdottir2002), and the absorbance was recorded at 725 nm.
Determination of antioxidant enzyme activity and protein contents
Catalase (CAT; EC 1.11.1.6) activity was measured as described by Rai et al. (Reference Rai, Singh and Shah2012). Assay mixture of 750 μl contained 500 μl of 100 mM KH2PO4 buffer (pH 7.0), 200 μl of 200 mM H2O2 and 50 μl of enzyme extract. Absorbance was recorded by measuring the decomposition of H2O2 at 240 nm. Superoxide dismutase (SOD; EC 1.15.1.1) activity was analysed as per Shah et al. (Reference Shah, Kumar, Verma and Dubey2001). The reaction mixture for SOD consisted of sodium carbonate–bicarbonate buffer (50 mM, pH 9.8), having 0.1 mM EDTA, 0.6 mM epinephrine and crude enzyme (supernatant) in a 3 ml final volume. The formation of adrenochrome was measured at 470 nm. Ascorbate peroxidase (APX; EC 1.11.1.11) was analysed as described by Nakano and Asada (Reference Nakano and Asada1981). The assay mixture was prepared using potassium phosphate buffer (50 mM, pH 7.0), EDTA, 0.2 mM H2O2 (each 0.2 m), ascorbic acid (0.5 mM) and crude enzyme (supernatant) in a 3 ml final volume; the optical density was measured at 290 nm.
Glutathione reductase (GR; EC 1.6.4.2) was analysed as per Sanchez et al.'s (Reference Sanchez, Rubio-Wilhelmi, Cervilla, Blasco, Rios, Rosales, Romero and Ruiz2010) procedure. For assay, a reaction mixture in a 2 ml final volume, consisting of Tris-HCl buffer (100 mM, pH 7.8), NADPH (0.2 mM), oxidized glutathione (0.5 mM), MgCl2 (3 mM) and 200 μl enzymes (supernatant), was prepared. NADPH was added to initiate the reaction at room temperature and the reduction in optical density was measured at 340 nm. The guaiacol peroxidase (POD; EC 1.11.1.7) activity was analysed as described by Shah et al. (Reference Shah, Kumar, Verma and Dubey2001). Reaction mixture consisting of potassium phosphate buffer (100 mM, pH 6.5), guaiacol (15 mM), 0.05% (v/v) H2O2 and 60 μl enzyme (supernatant) was prepared. The H2O2 was added in the last to start the reaction and guaiacol oxidation was monitored by measuring the increasing absorbance at 470 nm.
Gene expression analysis
A total of five drought stress responsive genes previously reported (Ansari et al., Reference Ansari, Atri, Singh, Kumar and Pandey2018) were selected, viz. APX, GR, CAT, POD and SOD. Extraction of total RNA and cDNA synthesis were followed as per the manual instructions. IQ SYBR Green Supermix (Bio-Rad, USA) was used for the analysis of gene expression as per the manufacturer's instructions on iQ5 thermal cycler (Bio-Rad). For each gene, specific primers were used, while actin was used as an internal control (online Supplementary Table S1). Reaction volume comprised of 5 μl of cDNA, 1 μl of each specific primer (200 nM/reverse, forward) and 10 μl of SYBR Green qPCR Mix (Bio-Rad). Using the following temperature program, real-time quantitative PCR was carried: initial temperature at 95°C for 1.2 min, followed by 36 cycles at 95°C for 45 s, at 55–60°C (varied as per primer's Tm) for 45 s, at 72°C for 40 s and lastly one cycle at 72°C for 5 min. The expressions of genes were calculated by using the 2−ΔΔCT method (Livak and Schmittgen, Reference Livak and Schmittgen2001).
Statistical analyses
Two years data have been pooled and their means and standard errors were calculated. The data were analysed by a one-way analysis of variance (ANOVA) at P ⩽ 0.05 using SPSS v. 16.0 (SPSS, Chicago, USA). Duncan's multiple range test was performed according to randomized block design to compare the mean values when ANOVA results were significant.
Results
Changes in morphological parameters under water deficit condition
Root length increased in all the genotypes as WD advanced. Maximum root length recorded in BAM-VR-311 under control condition. Under 7, 14 and 21 d of water deficit (DWD), the maximum root length was recorded in BAM-VR-312. After 7, 14 and 21 DWD, shoot length was maximum for BAM-VR-311 (Table 1). With respect to the DWD, the changes in leaf length, leaf width, root weight, shoot dry weight, shoot fresh weight and root branches are mentioned in Table 1. There was no fix pattern for days of first male flowering (Table 2). Under 7, 14 and 21 DWD, fruit length was maximum for BAM-VR-312. Number of fruits per plants after 7 DWD was maximum (5) in BAM-VR-312 and BAM-VR-314. After 14 DWD, it was maximum (4) in BAM-VR-311, BAM-VR-312 and BAM-VR-316. After 21 DWD, order of number of fruit/plant was as follows: BAM-VR-312 > BAM-VR-316 > BAM-VR-311 > BAM-VR-314. Average fruit weight under 7 DWD increased in BAM-VR-311 and BAM-VR-314, while it decreased in BAM-VR-312 and BAM-VR-316. After 14 and 21 DWD, maximum fruit weight was recorded in BAM-VR-316 (Table 2). Under 7 DWD, maximum yield/plant was recorded in BAM-VR-316. Similarly, after 14 and 21 DWD, maximum yield/plant was recorded in BAM-VR-316 (Table 2). Average leaf fresh weight was maximum in BAM-VR-311 under control and 7, 14 and 21 DWD conditions. Similarly, leaf dry weight was maximum in BAM-VR-311 under control and 7, 14 and 21 DWD conditions (Table 2).
Table 1. Effect of drought stress on different growth parameters
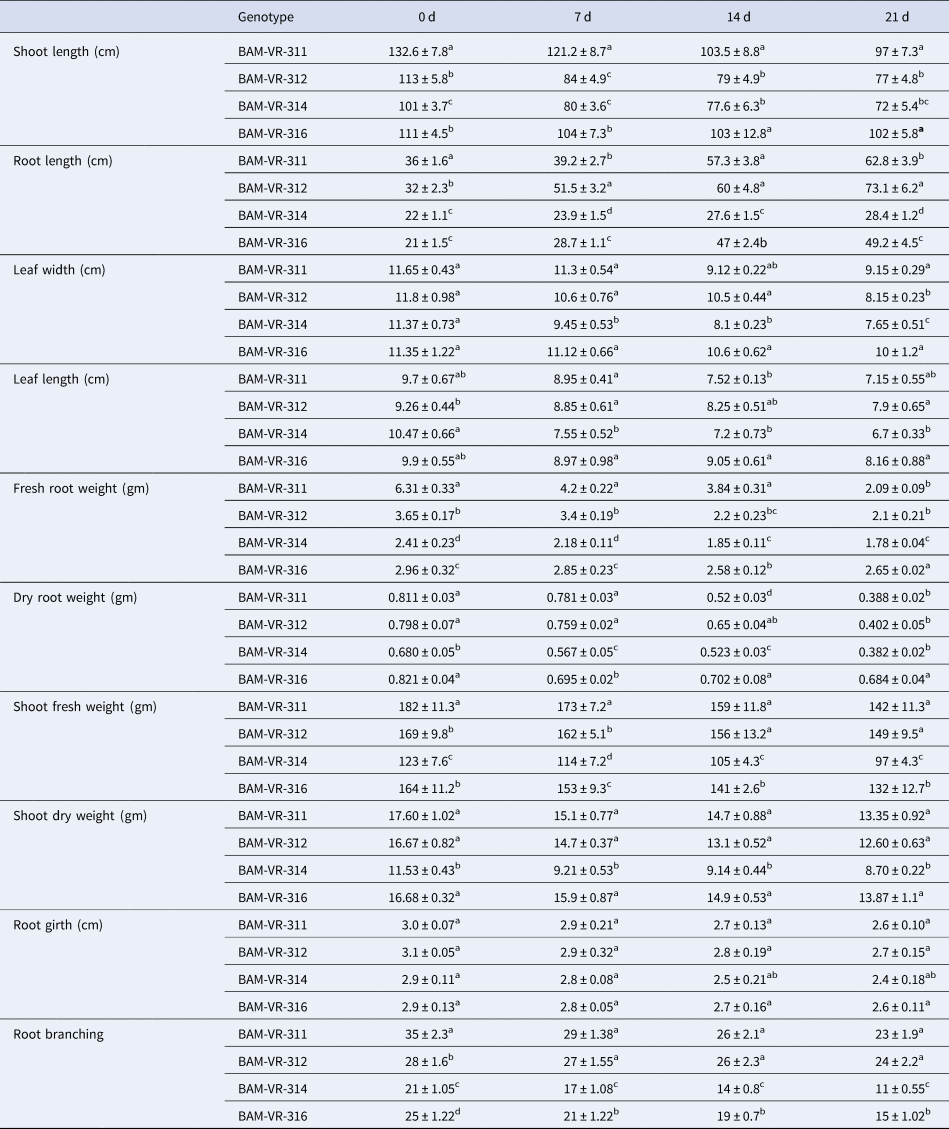
Data are means ± SE of three replication. Means followed by the same letter within a column for individual parameters are not significantly different (P > 0.05) according to Duncan's multiple range tests.
Table 2. Effect of drought stress on different growth parameters
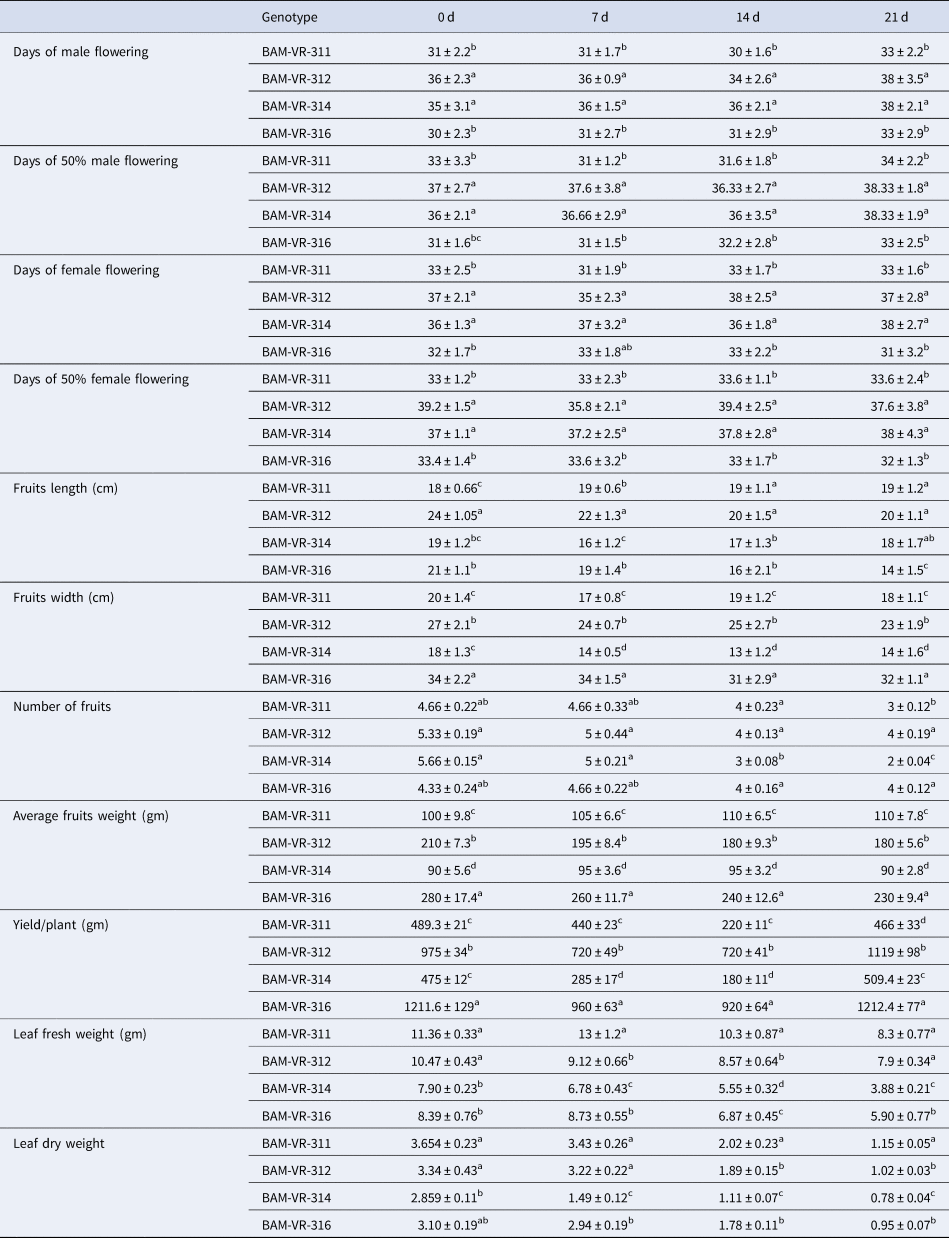
Data are means ± SE of three replication. Means followed by the same letter within a column for individual parameters are not significantly different (P > 0.05) according to Duncan's multiple range tests.
Changes in physiological parameters under water deficit condition
Genotypes BAM-VR-312 and BAM-VR-316 exhibited higher RWC at each WD level. At 7 DWD, BAM-VR-312 and BAM-VR-316 showed insignificant differences in their RWC. However, at 14 DWD, the highest RWC was found in BAM-VR-312. At 21 DWD, genotype BAM-VR-312 showed maximum RWC (Fig. 1A).
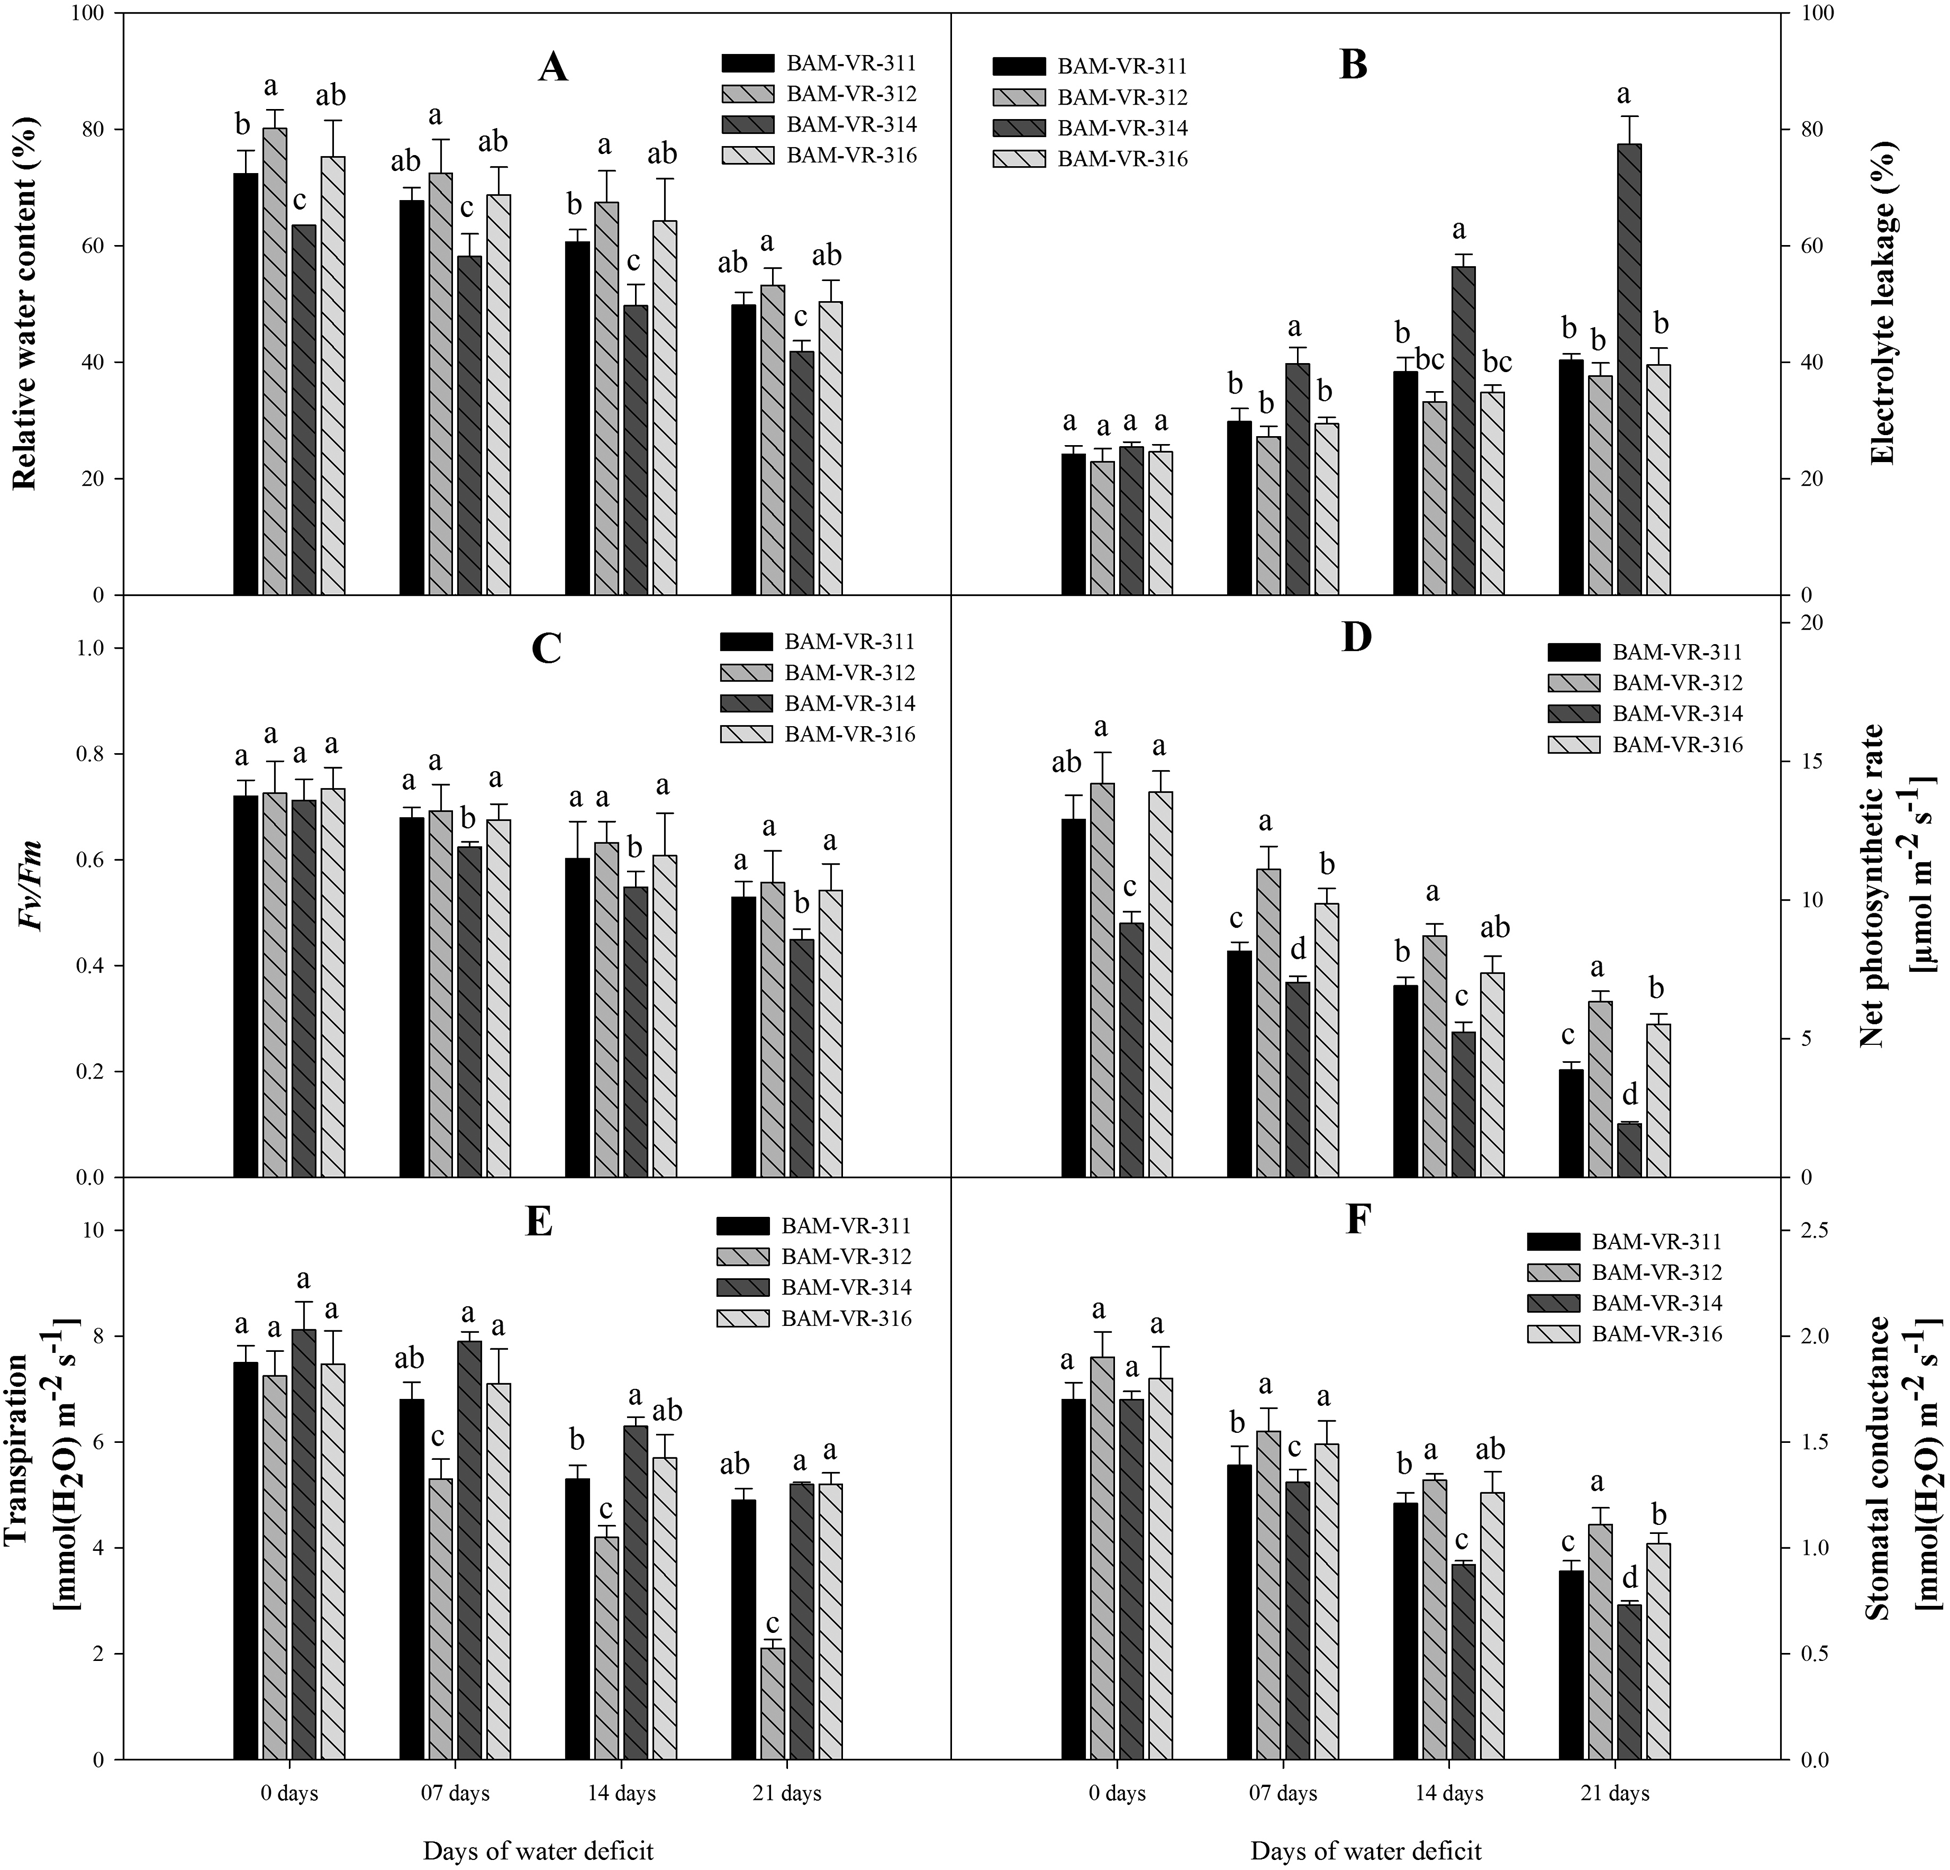
Figure 1. Effect of increasing drought stress on (A) relative water content; (B) electrolyte leakage; (C) F v/F m; (D) net photosynthetic rate; (E) transpiration; (F) stomatal conductance. The data are mean of three replicates ±SE. Those followed by different letters within similar drought stress treatment are significantly different according to Duncan's multiple-range test at P > 0.05.
After 7 DWD, maximum EL was noted in BAM-VR-314. A continuous increase was noted after 14 and 21 DWD, and the EL was maximum in BAM-VR-314 (Fig. 1B). Under 7 DWD, F v/F m was maximum in BAM-VR-312. After 14 and 21 DWD, maximum F v/F m was recorded for the genotype BAM-VR-312 (Fig. 1C). Under control, 7, 14 and 21 DWD, maximum photosynthesis was recorded for BAM-VR-312 with respective values 14.2, 11.1, 8.7 and 6.34 (Fig. 1D). The transpiration was reduced with respect to the increasing WD (from 7 to 21 DWD) in each genotype, but genotype BAM-VR-312 maintained higher transpiration at each WD level compared to other genotypes, and especially BAM-VR-314, which consistently showed the lowest transpiration at each WD level (Fig. 1E). Stomatal conductance was measured under control and 7, 14 and 21 DWD. A continuous reduction in stomatal conductance was recorded under 7, 14 and 21 DWD. However, maximum stomatal conductance was recorded for BAM-VR-312, under 7, 14 and 21 DWD (Fig. 1F).
Changes in biochemical parameters under water deficit condition
Proline content increased at all stages of WD in all four genotypes. However, at 7, 14 and 21 DWD, a higher increase in proline was recorded for BAM-VR-312 (Fig. 2A). In general, an increasing trend in H2O2 concentration in all genotypes was observed with respect to DWD. The highest H2O2 concentration was measured in genotype BAM-VR-314, under control, 7, 14 and 21 DWD (Fig. 2B). Lipid peroxidation showed a regular trend of increase with increase in DWD, under 7, 14 and 21 DWD; maximum LPO was recorded in BAM-VR-314 (Fig. 2C). Phenol content was maximum in BAM-VR-312 followed by BAM-VR-316, under control condition. Under 7 DWD, it increased in all genotypes with maximum increase recorded in BAM-VR-311, followed by BAM-VR-314 (Fig. 2D). However, under 14 DWD, it decreased in all genotypes and maximum reduction was recorded in BAM-VR-312 and minimum reduction was noted in BAM-VR-316. However, under 21 DWD, it increased again and the maximum phenol content was recorded in BAM-VR-311 and minimum in BAM-VR-312. Under 7, 14 and 21 DWD, maximum total chlorophyll was estimated in case of BAM-VR-312 (Fig. 2E). Similar to total chlorophyll content, carotenoid content also decreased with increase in DWD in all genotypes. It was maximum in BAM-VR-312 under control condition. Under 7 DWD, it was maximum for BAM-VR-311. Under 14 and 21 DWD, it was maximum in BAM-VR-312 (Fig. 2F).
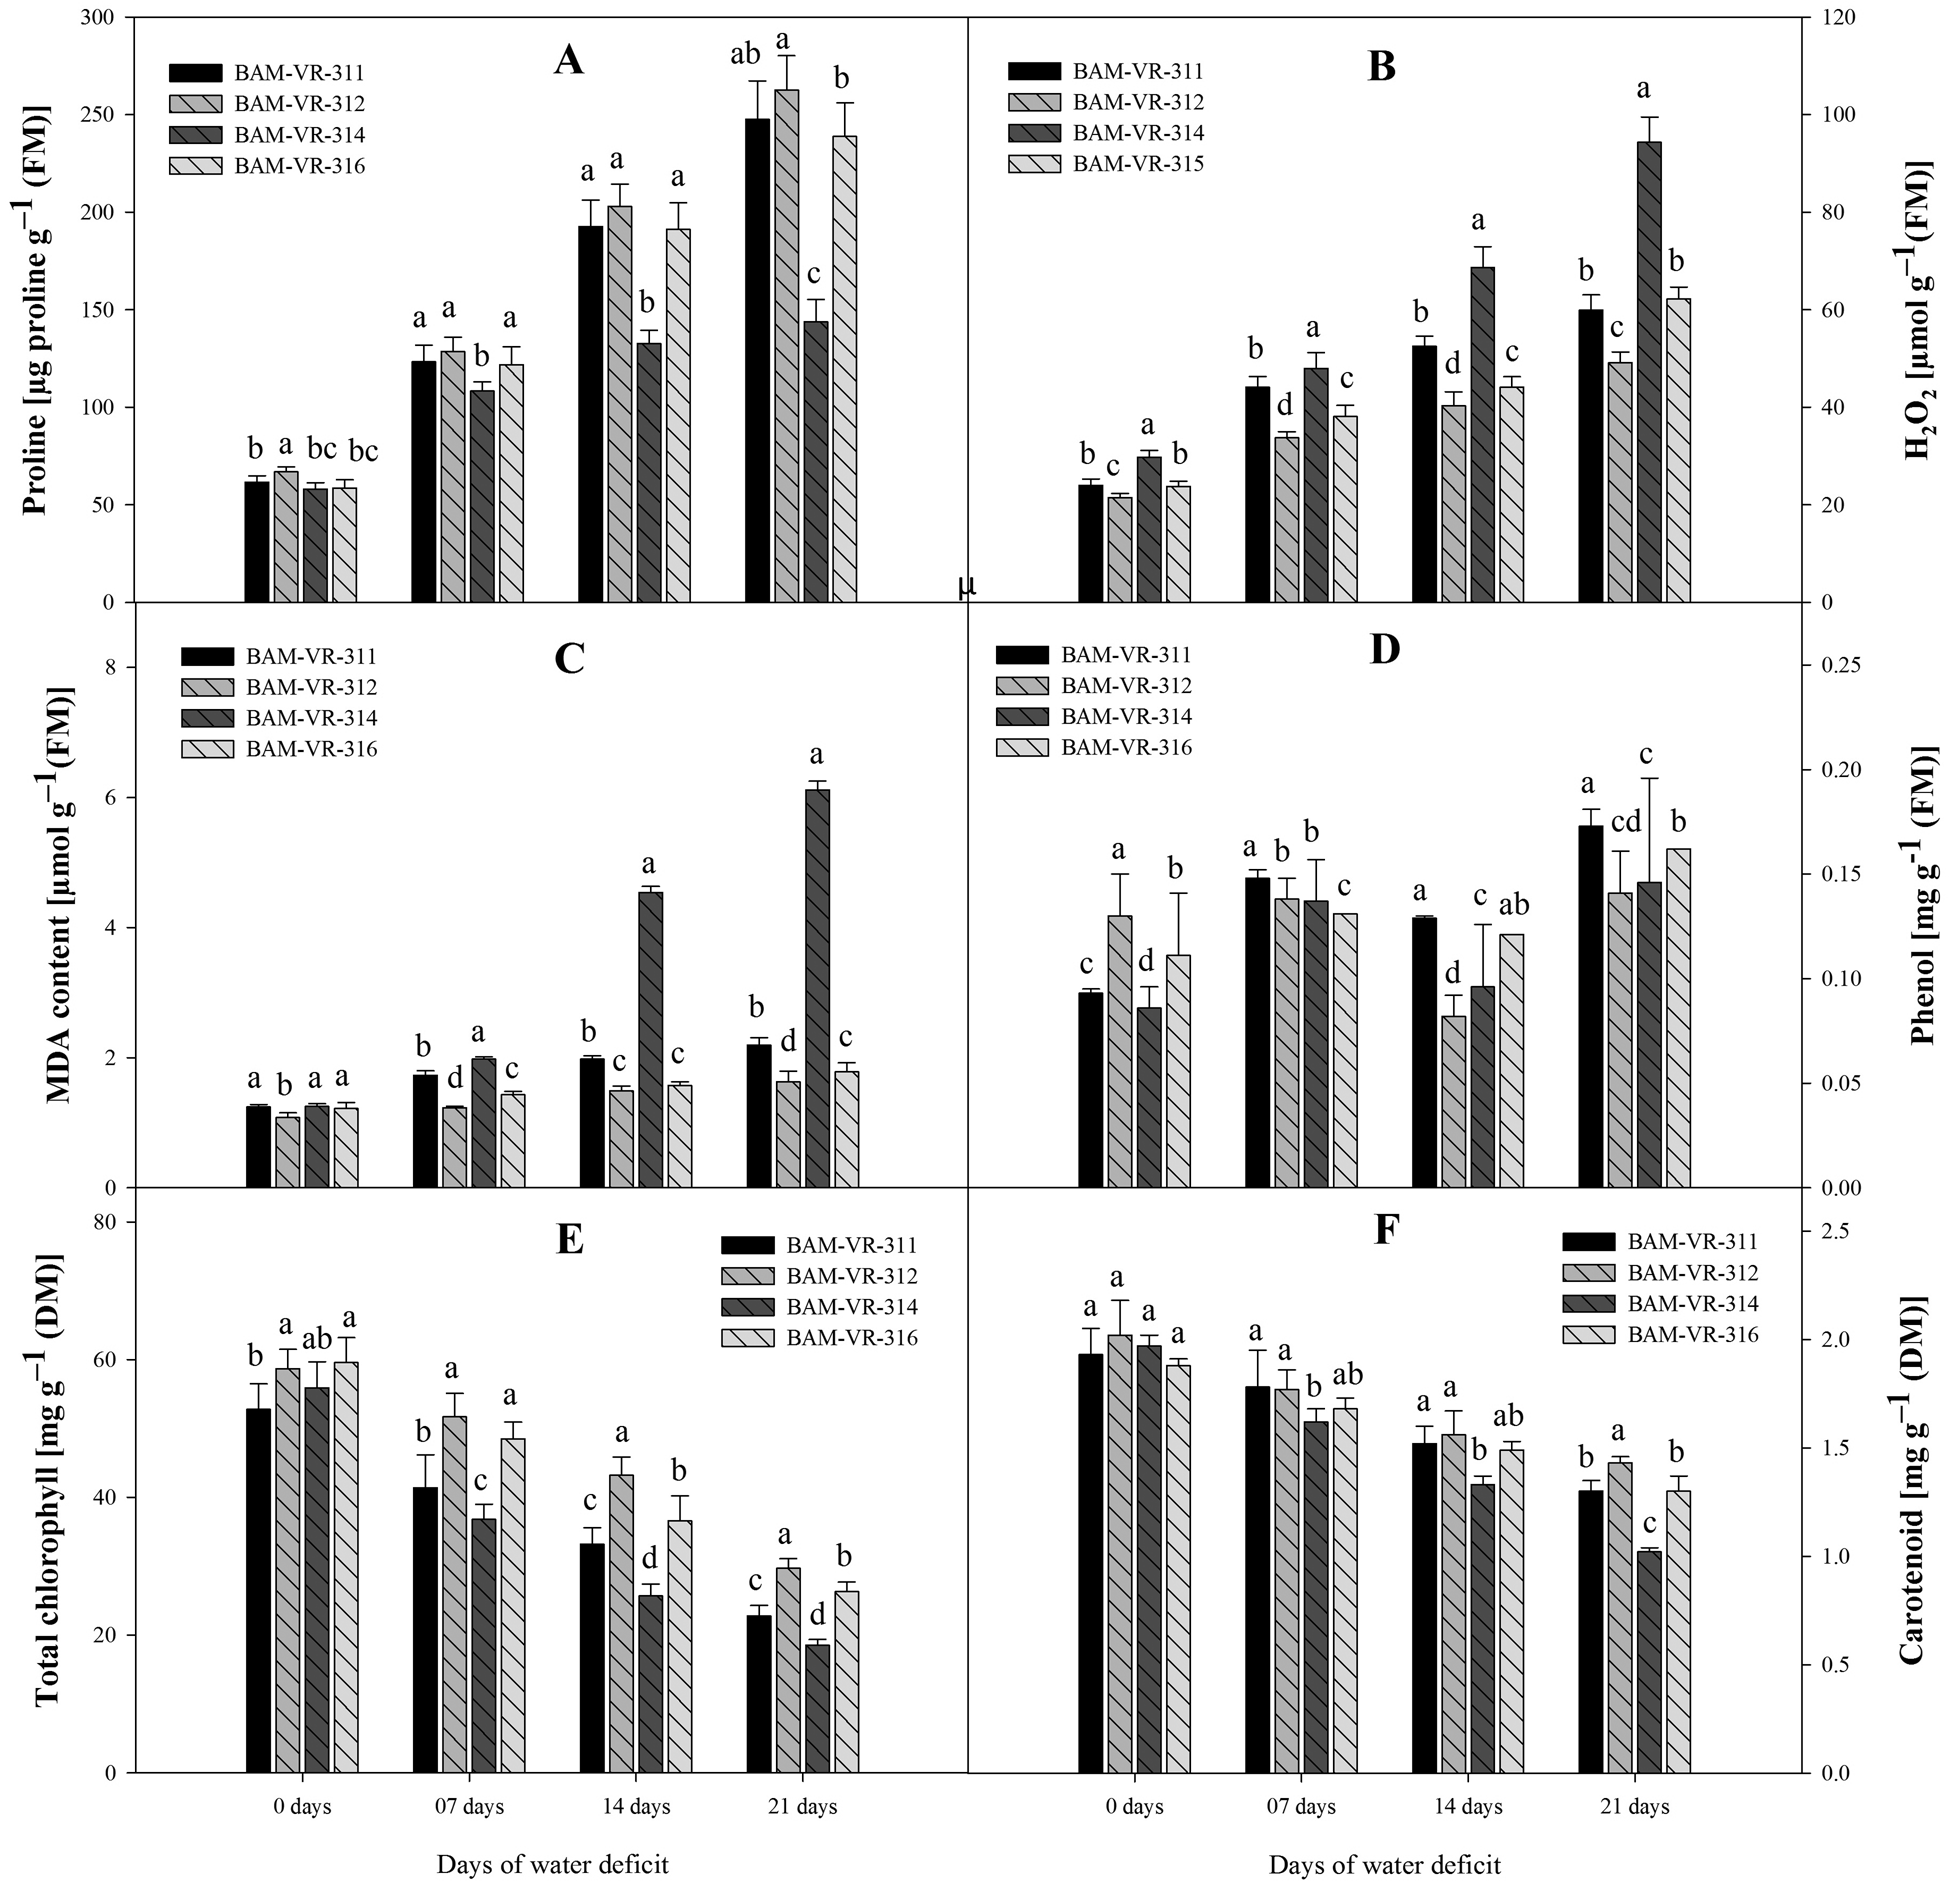
Figure 2. Effect of increasing drought stress on (A) proline; (B) hydrogen peroxide; (C) MDA content; (D) phenol; (E) total chlorophyll; (F) carotenoid. The data are mean of three replicates ±SE. Those followed by different letters within similar drought stress treatment are significantly different according to Duncan's multiple-range test at P > 0.05.
At 7 DWD, the superoxide dismutase activity was maximum in BAM-VR-312, similarly at 14 and 21 DWD, the superoxide dismutase activity was maximum in BAM-VR-312 (Fig. 3A). Under drought stress treatments, and especially at 7 and 14 DWD, the maximum catalase activity was recorded in BAM-VR-316 followed by BAM-VR-312 (Fig. 3B). However, after 21 DWD, maximum catalase activity was recorded in BAM-VR-312. Under control condition, maximum APX was noted in BAM-VR-312, while it was 1.88 in BAM-VR-311 and BAM-VR-314, and 1.90 in case of BAM-VR-316 (Fig. 3C). After 7, 14 and 21 DWD, 2.15, 6.85 and 8.15 times increase was noted in BAM-VR-311, 2.52, 8.43 and 11.42 times in BAM-VR-312, 1.83, 2.77 and 3.26 times in BAM-VR-314, while 2.08, 7.19 and 10.94 in case of BAM-VR-316. At 7, 14 and 21 DWD, the maximum guaiacol peroxidase activity was recorded for BAM-VR-312, whereas minimum was recorded in BAM-VR-314 (Fig. 3D). At 7 DWD, glutathione reductase activity was maximum in BAM-VR-312 and BAM-VR-316. However, with the increase in severity of WD (from 14 to 21 DWD), the maximum glutathione reductase activity was observed in BAM-VR-312. The lowest glutathione reductase activity was found in BAM-VR-314 at 14 and 21 DWD (Fig. 3E).
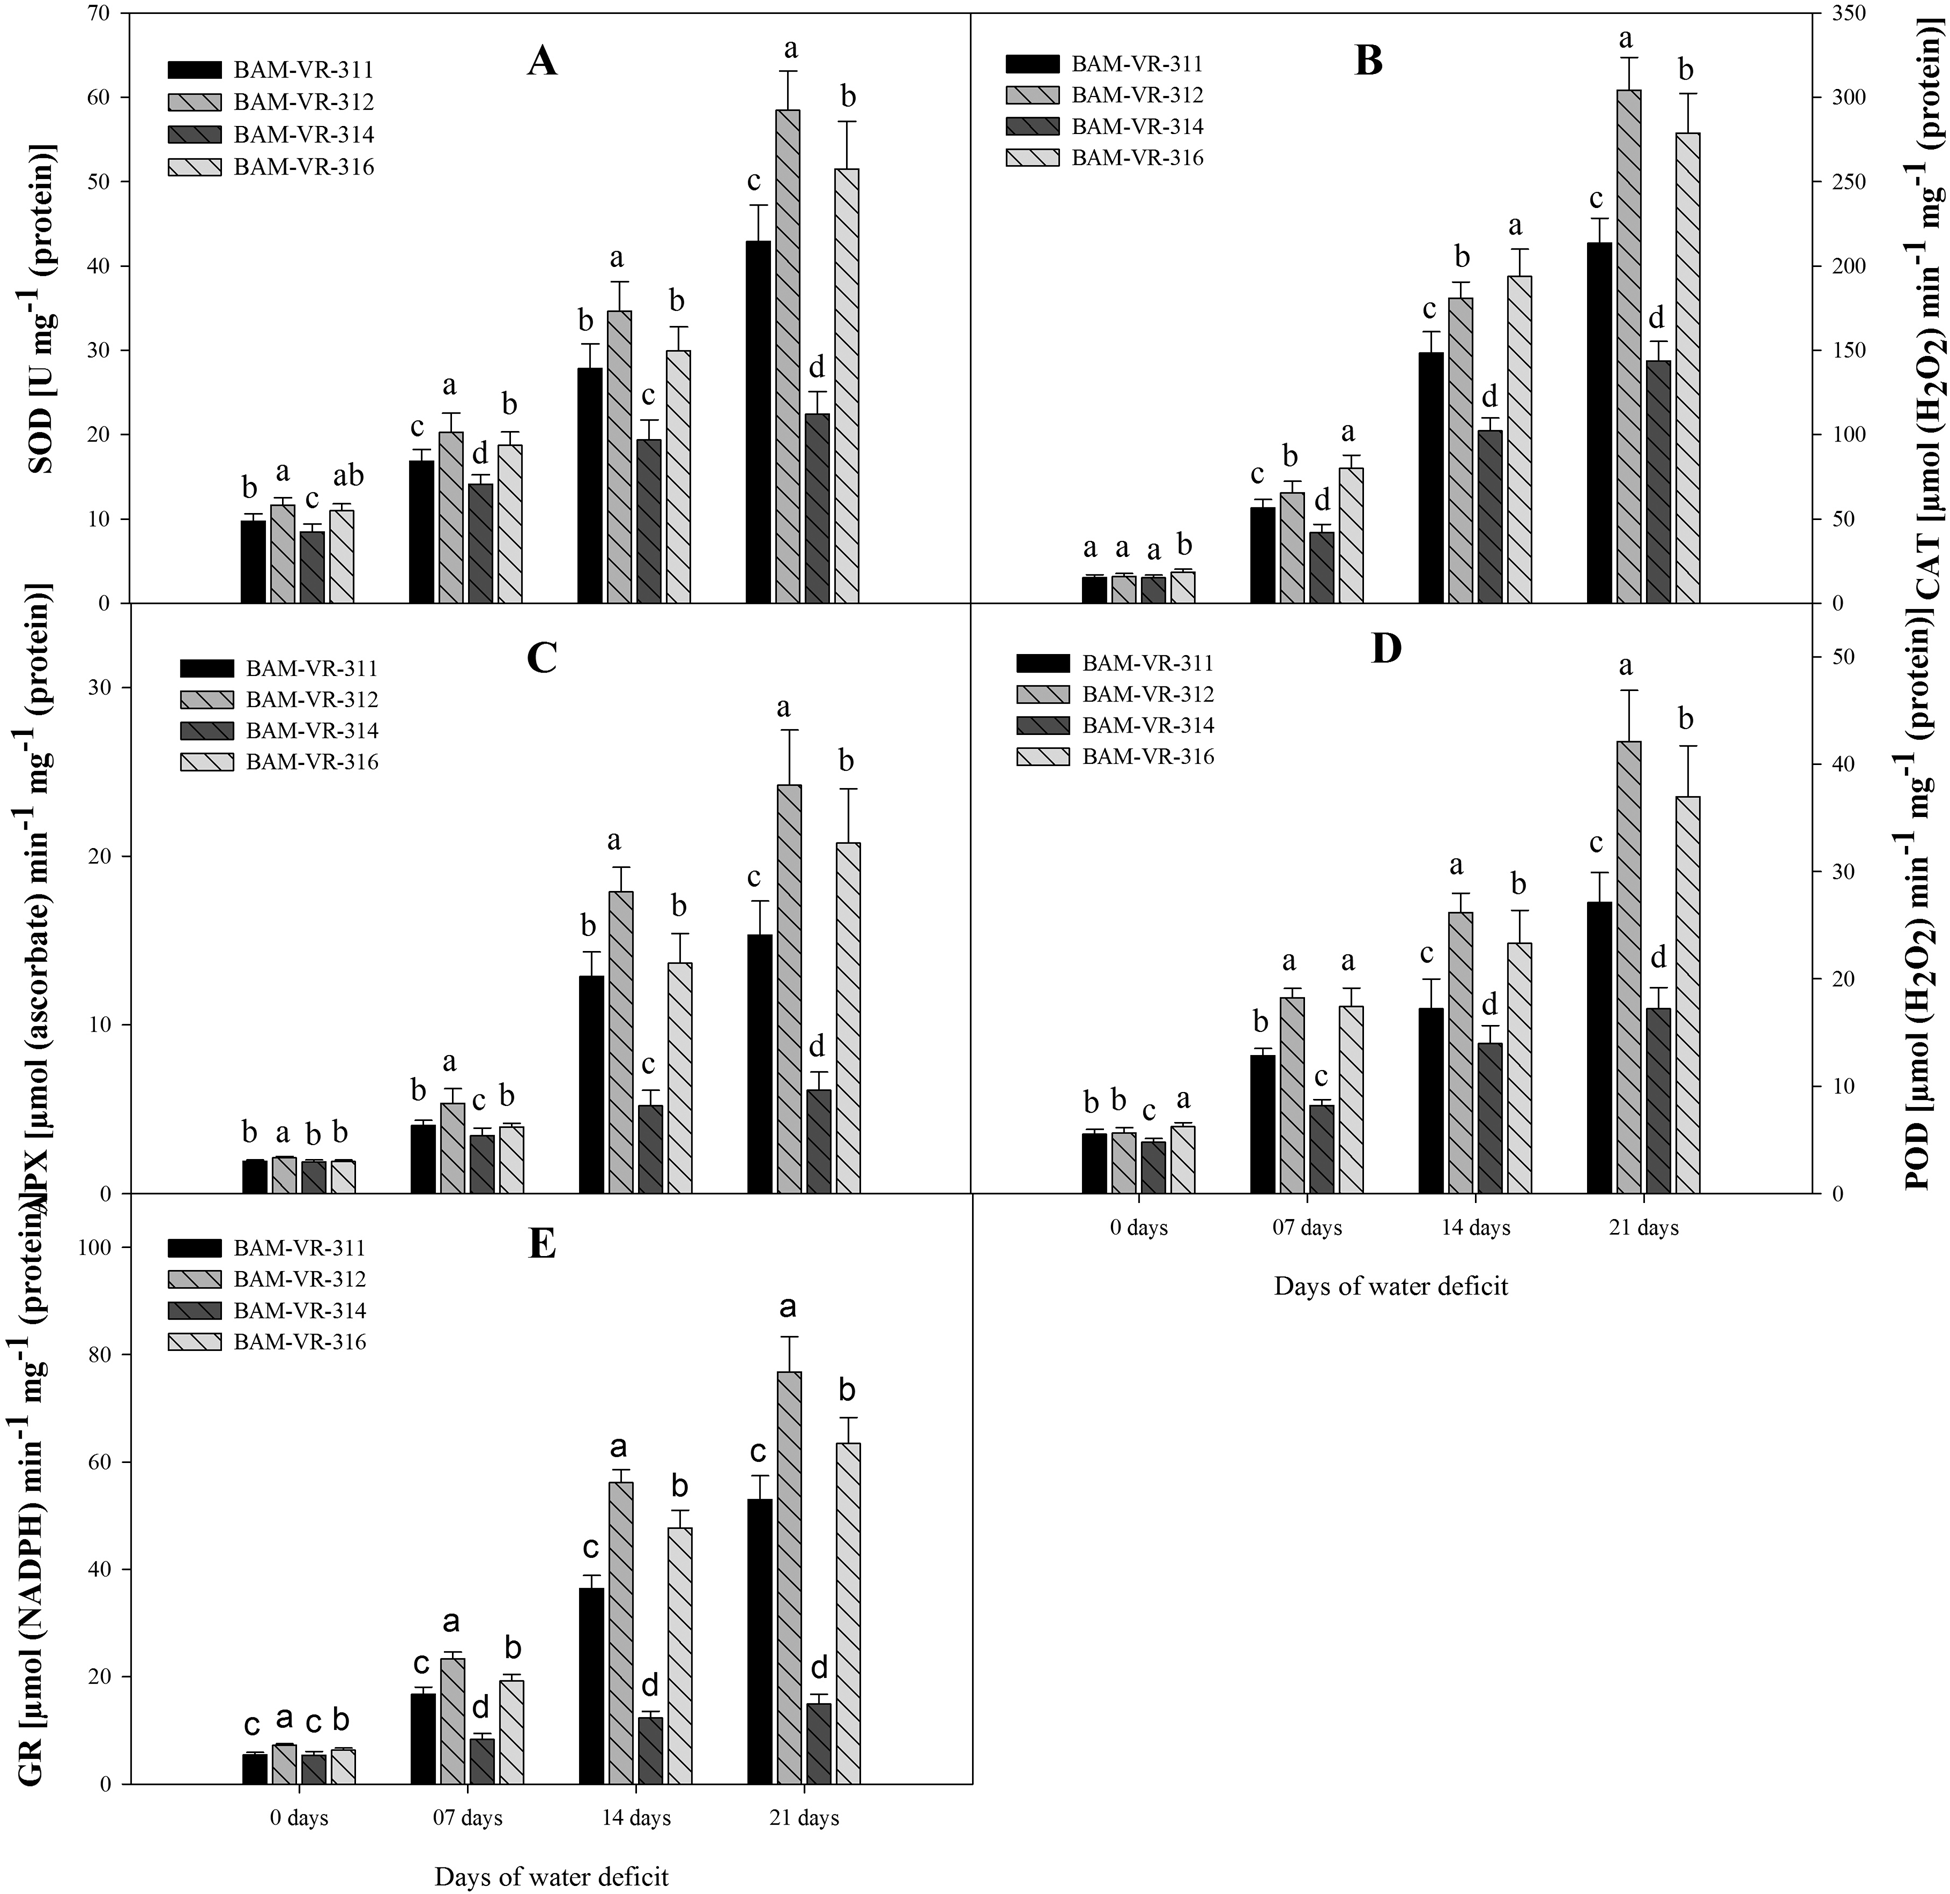
Figure 3. Effect of increasing drought stress on activities of key antioxidants in snapmelon leaves. (A) Superoxide dismutase (SOD); (B) catalase (CAT); (C) ascorbate peroxidase (APX); (D) guaiacol peroxidase (POD); (E) glutathione reductase (GR).The data are mean of three replicates ±SE. Those followed by different letters within similar drought stress treatment are significantly different according to Duncan's multiple-range test at P > 0.05.
Changes in gene expression pattern under water deficit condition
Expression level of SOD also rises with increase in DWD, under 7, 14 and 21 DWD maximum fold rise compared to control recorded in BAM-VR-312 (Fig. 4A). Similarly, under 21 DWD, maximum fold rise in CAT expression was recorded in BAM-VR-312 (Fig. 4B). WD caused overexpression of APX under 7, 14 and 21 DWD (Fig. 4C). Similarly, WD of 7, 14 and 21 d resulted in enhanced overexpression of guaiacol peroxidase. Under 21 DWD, maximum expression of guaiacol peroxidase was recorded in case of BAM-VR-312 (Fig. 4D). Compared to control, glutathione reductase activity under 21 DWD was maximum and 9.8-fold higher in case of BAM-VR-312 (Fig. 4E).
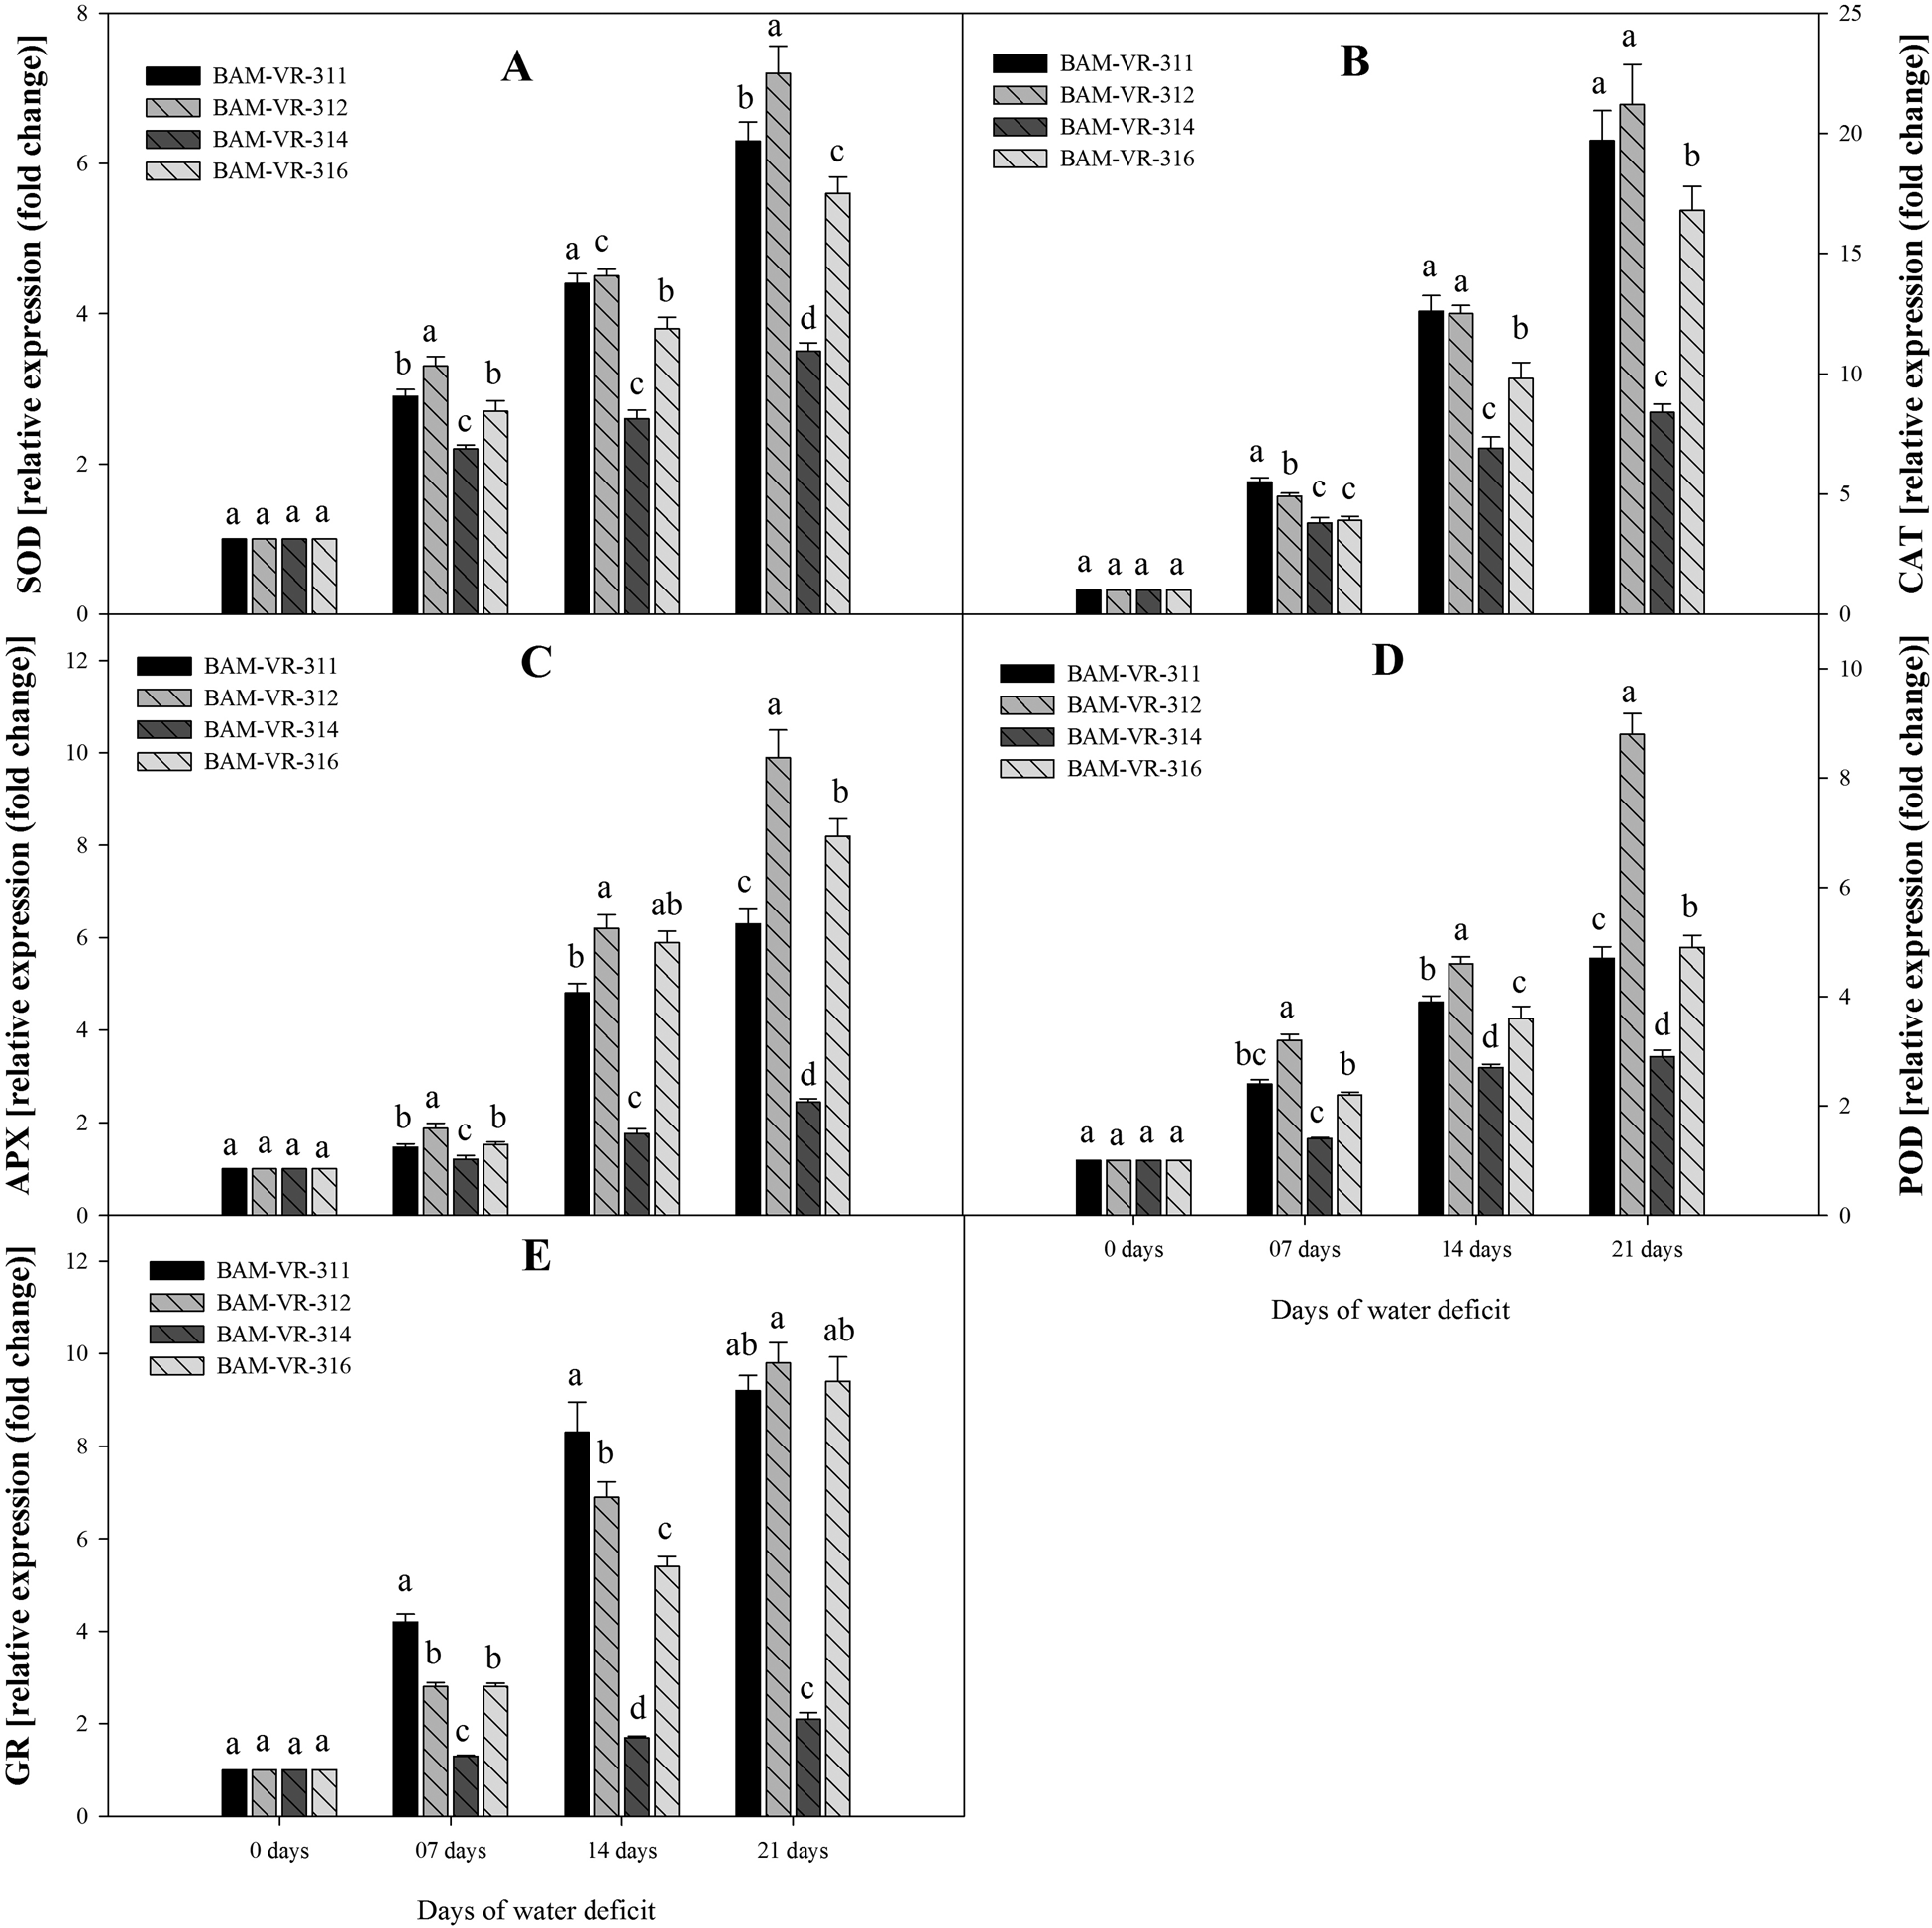
Figure 4. Effect of increasing drought stress on relative expression of antioxidants enzyme genes snapmelon leaves. (A) superoxide dismutase (SOD); (B) catalase (CAT); (C) ascorbate peroxidase (APX); (D) guaiacol peroxidase (POD); (E) glutathione reductase (GR).The data are mean of three replicates ±SE. Those followed by different letters within similar drought stress treatment are significantly different according to Duncan's multiple-range test at P > 0.05.
Discussion
The present study is the first to present a report of an underutilized crop snapmelon for which little information related to the drought stress study in this crop is available. Based on the morphological, physiological, biochemical and molecular analysis, we found that BAM-VR-312 is the most drought stress tolerant among four tested genotypes. We demonstrate that drought stress correlates with enhanced root growth in snapmelon genotypes, being greater in tolerant and lower in susceptible genotypes. The prolific and deeper root is a vital component for soil water intake, which results in better production, even under drought stress condition (Kang et al., Reference Kang, Peng and Xu2022).
Enhanced root length is an adaptive strategy in which plants receive water from the deeper layer of the soil, and hence helps in plant survival even under drought stress condition (Khodabakhshi et al., Reference Khodabakhshi, Seyedi, Mazaheri-Tirani and Motlagh2023). In the current study, we recorded higher dry weight of leaf, shoot and root for susceptible compared to tolerant genotypes.
In the snapmelon genotype BAM-VR-312, RWC was maximum, after 7, 14, and 21 DWD and can be identified as highly drought-tolerant and can be further validated for cultivation in drought-prone areas. Drought stress causes membrane damage which results in leakage of electrolytes; however, the level of leakage and tolerance capability varies from genotype to genotype, as in the present study leakage was higher in susceptible genotype, while it was lowest in tolerant genotype BAM-VR-312. This result is similar to that in chickpea where drought tolerance was based on the lesser damage of tissues and lower EL was reported (Tiwari et al., Reference Tiwari, Tiwari, Sapre, Tripathi, Payasi, Singh, Thakur, Sharma, Tiwari and Tripathi2023).
In this study, PSII damage under drought stress measured by photo-inhibition was greatly evident in BAM-VR-314, particularly, under severe drought stress where it was able to maintain higher photosynthetic efficiency. This is consistent with the report of Rehman et al. (Reference Rehman, Weng, Li, Yu, Rahman, Khalid, Shah, Gulzar, Chang and Niu2023), where drought stress causes higher PSII damage specifically in susceptible genotypes of Cucumis melo compared to the tolerant genotypes.
In the present study, H2O2 generation in BAM-VR-312 plant leaves was minimum, which indicates balanced ROS generation in drought-tolerant genotype compared to susceptible one (Mahlooji and Jenab, Reference Mahlooji and Jenab2021). Among the biochemical factors, the level of MDA is one of the preliminary factors of indication against the drought stress, and lower accumulation of MDA in BAM-VR-312 indicates better tolerance under WD condition. In muskmelon, Rehman et al. (Reference Rehman, Weng, Li, Yu, Rahman, Khalid, Shah, Gulzar, Chang and Niu2023) also reported similar observations. Screening and validation of genotypes against drought stress might be confirmed by selecting some keystone parameters such as MDA, although we have accessed more biochemical parameters that might have made us to exclude a solid and concrete finding of a tolerant genotype. Proline acts as an osmoprotectant and plays a significant role in osmotic balance maintenance (Arteaga et al., Reference Arteaga, Yabor, Díez, Prohens, Boscaiu and Vicente2020).
SOD, CAT, APX, GR and POD play significant roles in protecting plants from oxidative damages generated due to ROS. In our previous study in muskmelon, we have reported enhanced activity of these enzymes in tolerant genotypes compared to the susceptible one under drought stress condition (Ansari et al., Reference Ansari, Atri, Singh, Kumar and Pandey2018). In general, change or adaptation in biochemical changes corroborates with the change or alteration in their respective genes, as it is evident in our study with respect to the change in SOD, CAT, APX, GR and POD level; a correlated alteration is also noted in their respective genes.
Transgenic plants overexpressing Cu/Zn-SOD, Mn-SOD and APX exhibit enhanced resistance against drought stress (Mishra et al., Reference Mishra, Jiang, Chen, Paul, Chatterjee and Shen2023). In the current study, BAM-VR-312 showed higher expressions, which signify the respective involvement of these genes in the drought stress tolerance of snapmelon plants.
In the current study, we assessed the drought stress tolerance of four genotypes of Indian snapmelon genotype (BAM-VR-311, BAM-VR-312, BAM-VR-314 and BAM-VR-316). The BAM-VR-312 genotype identified from this study will work as novel genetic material for future breeding programme. As snapmelon is an underutilized vegetable crop, their productivity is largely impacted due to environmental stresses including drought stress, and very less study has been carried by researchers to explore this crop. Further finding will help in screening and utilization of large number of snapmelon genotypes under field condition within short time.
Supplementary material
The supplementary material for this article can be found at https://doi.org/10.1017/S1479262124000066.
Data
All the data recorded during the experiments are presented in the manuscript and the drought tolerance snapmelon genotypes are being maintained with ICAR-Indian Institute of Vegetable Research and can be made available on request.
Acknowledgements
The authors are thankful to the Director ICAR-Indian Institute of Vegetable Research, Varanasi for providing the necessary facilities to conduct this research work. The authors also generously acknowledge the financial support of the National Agricultural Innovation Project (NAIP), New Delhi.
Author contributions
S. P. conceptualized and drafted the idea of present research work; W. A. A. conducted the experiment and data analysis; R. K. and P. S. Y. helped in experiment and data recording; W. A. A. and R. K. prepared the rough draft of manuscript; S. P., T. C., C. K. and T. K. B. edited the manuscript.
Competing interests
All the authors declared that there is no competing interest including financial and personal which can influence the present research work.


