Introduction
Rhynchophorus ferrugineus Olivier, also known as the red palm weevil (RPW), belongs to the family Coleoptera, Curculionidae (Ahmed and Freed, Reference Ahmed and Freed2021). The RPW is an invasive pest that has become fully entrenched in more than 60 countries around the world, and was first discovered in the Arabian Gulf region in the mid-1980s (Kurdi et al., Reference Kurdi, Al-Aldawsari, Al-Turaiki and Aldawood2021; Yasin et al., Reference Yasin, Wakil and Qayyum2021). This pest originated in southern and southeastern Asia, such as India, Indonesia and Pakistan, and later spread to the Near East and North Africa. Subsequently, the RPW invaded several Middle Eastern countries, such as Iran, Iraq, Saudi Arabia, the UAE and Egypt (El-Zoghby et al., Reference El-Zoghby, Awad, Alkhaibari and Abdel-Hameid2022). In 1990, RPW was also reported in China. Since the 1980s, its geographic distribution in China has expanded rapidly. RPW monitoring was conducted in Taiwan in 1997 and severely damaged ornamental palm saplings were found in central Taiwan (Kurdi et al., Reference Kurdi, Al-Aldawsari, Al-Turaiki and Aldawood2021). RPW poses a significant threat to Trachycarpus H. Wendl. plants. It is worth noting that RPW primarily targets palm trees within this plant category. Furthermore, the pest exhibits a preference for the economic crops of these plants.
Trachycarpus is mostly used in landscaping because of its adaptable and aesthetically pleasing plant form, as well as its resistance to a variety of toxic gases (Nengjie, Reference Nengjie2022). In addition to this, Trachycarpus has some economic value. Its skin fibres, young leaves and the dark brown leaf sheaths covering the stems can be made into a variety of fibre products with excellent properties (Zhu et al., Reference Zhu, Li and Wang2019). At the same time, the plants of the genus have some medicinal value (Zhijun, Reference Zhijun1998), and the RPW is one of the most dangerous and destructive of the pests that afflict Trachycarpus (Alshammari et al., Reference Alshammari, Alazmi, Alanazi, Sulieman, Veettil and Ponce-Alonso2022; Montiel et al., Reference Montiel, Mora, Rico-Porras, Palomeque and Lorite2022). It is most damaging to young Trachycarpus plants less than 10 years old, and generally less damaging to older trees over 30 years old. These include Phoenix sylvestris (L.) Roxb. (silver date palm), P. canariensis Chabaud (Canary Island date palm) and Bismarckia nobilis Hildebr. & H. Wendl. (Bismarck palms) (Kurdi et al., Reference Kurdi, Al-Aldawsari, Al-Turaiki and Aldawood2021). RPW is highly adapted to host plants; at least 24 species of Trachycarpus plants have been reported (Yang et al., Reference Yang, Wu, Liao, Li, Young Shin and Nai2023), mainly including coconut, sugar, oil, sago, palmyra, royal, Washingtonian and date palms (Kurdi et al., Reference Kurdi, Al-Aldawsari, Al-Turaiki and Aldawood2021). The number of hosts for the RPW has increased significantly over the past few decades (Abdel Raheem et al., Reference Abdel Raheem, ALghamdi and Reyad2020). This increase in host range is a result of its rapid geographic expansion, which is likely to continue in the future due to climate change (Montiel et al., Reference Montiel, Mora, Rico-Porras, Palomeque and Lorite2022). This insect has now spread to palm tree plantations in southern China, causing serious damage to the palm tree industry and landscape. Special emphasis is placed on the fact that RPW is characterised by high reproductive capacity, wide range of parasitic plants, difficulty in control, high lethality, easy to concentrate outbreaks, etc., and the damage to plants is often irreversible (Abdelsalam et al., Reference Abdelsalam, Alzahrani, Elmenshawy and Abdel-Moneim2020). The RPW usually invades in the following three ways. The first, which is the most common, is the infestation of plants by adults laying eggs that hatch in wounds, fissures and cracks at the base of the trunk or petiole, and by larvae that bore into the young tissue at the base of the plant's petiole and within the trunk. The affected plants initially show slight cracking of the bark or petioles, followed by gradual yellowing and withering of the leaf margins, which then extends towards the middle of the leaves. As the damage progresses to later stages, the cores and leaves of the plants will dry up and become brittle, while their fibrous tissues undergo transformation into humus, resulting in fragmentation. Some palm plants may expel fibre crumbs or release a brown viscous liquid (commonly known as tree gum) from wormholes. When found, the affected plants are often unsalvageable, often causing the entire plant to break or die outright. The second type infiltrates the tree through surface-level roots. Affected plants exhibit reduced foliage, with certain branches and leaves wilting or drooping, while other areas appear indistinguishable from healthy plants. However, all internal tissues of the trunk are thoroughly compromised. The third type of invasion is from the crown of the tree, where the heart and leaves will all die, and this is the most damaging because the growing points quickly become necrotic. Regardless of the method of invasion, once RPW has penetrated the tree, it can usually kill the plant within 5–6 months (Abdel-Raheem et al., Reference Abdel-Raheem, ALghamdi and Reyad2019).
Due to the robust reproductive capacity of RPW, failure to control it can lead to substantial ecological, environmental and economic consequences. Annually, hundreds of thousands of infected palm trees perish, directly impacting farmers' income sources. Furthermore, the demise of palm trees can result in adverse effects on the local ecological environment, such as soil erosion and diminished biodiversity, consequently impeding the development of ecotourism and associated industries (Alshammari et al., Reference Alshammari, Alazmi, Alanazi, Sulieman, Veettil and Ponce-Alonso2022). In China, it is one of the 233 dangerous pests of forestry announced by the State Forestry Administration of China in 2003, and is included in China's list of imported phytosanitary pests and the list of quarantine pests of agriculture and forestry (Lijiao and Yihang, Reference Lijiao and Yihang2022). The larvae of RPW are long-lived, have a strong drilling ability and are adaptable to different environments. The larval stage is the most critical stage for control, as the destruction of vascular tissues by RPW larvae and the massive consumption of canopy tissues can lead to the death of palm trees (Zhang et al., Reference Zhang, Bai and Huang2020). Biological control, such as the use of natural enemies like larval parasitic wasps (Scolia erratica) and adult flies (Sarcophaga fuscicauda), can be considered an effective means of control. Nevertheless, although natural enemies of RPW have been reported in several countries, none of them have been used as biological control due to the protected internal environment in which RPW larvae live (Yang et al., Reference Yang, Wu, Liao, Li, Young Shin and Nai2023). As it stands, the distribution of RPW is primarily concentrated along the southeastern coastal regions of China. This area also happens to be the most severely affected by the pest. When contemplating alterations in species distribution, climate stands out as the pivotal factor. Existing research has underscored the significant influence of climate on the distribution of this pest. Specifically, rising temperatures may lead to an expansion of its ecological niche (Fiaboe et al., Reference Fiaboe and Peterson2012; Ge et al., Reference Ge, He, Wang, Yan and Zong2015). So predicting the future trend of RPW's geographic distribution provides a key intervention point for preventing its expansion.
Since the 1980s, a variety of species distribution models (SDMs), also known as ecological niche models (ENMs), have been developed, which are an important tool for studying the fitness of species (Booth et al., Reference Booth, Nix, Busby and Hutchinson2014). The main models used for developmental prediction work include Domain Model, Ecological Niche Factor Analysis (ENFA), the Bioclimatic Prediction System (Bioclim), genetic algorithm for rule set production (GARP) and maximum entropy models (MaxEnt) (Harte et al., Reference Harte, Umemura and Brush2021; Wang et al., Reference Wang, Hou, Song, Deng, Li and Wang2021; Losada et al., Reference Losada, Penas, Holik and Lamberti2022; Ahmadi et al., Reference Ahmadi, Hemami, Kaboli and Shabani2023). The principle of SDM is to relate known locations of species to the environmental characteristics of those locations in order to estimate the response function and contribution of environmental variables, and to estimate the ecological niche of the species according to a specific algorithm (Zhou et al., Reference Zhou, Zhang and Zhu2021). Insights into ecological or evolutionary drivers in this way can help predict habitat suitability at large scales (Fourcade et al., Reference Fourcade, Engler, Rodder and Secondi2014). It is worth mentioning that MaxEnt in SDMs has been increasingly adopted (Korbel, Reference Korbel2021). When MaxEnt is used to estimate the ecological niche and potential geographic distribution of a species, only species occurrence records and background samples of the environmental conditions in the area of interest are required. This type of data is referred to as ‘presence background’ (PB) data. MaxEnt applies the principle of ‘maximum entropy’ to fit the model to estimate the minimum extent to which the distribution of species deviates from a uniform distribution in order to explain the observations (Guillera-Arroita et al., Reference Guillera-Arroita, Lahoz-Monfort and Elith2014). MaxEnt is the most widely used SDM algorithm due to its ease of use and is believed to produce robust results with sparse data, irregular sampling and small localisation errors (Harte et al., Reference Harte, Umemura and Brush2021). The advantage of MaxEnt is that it requires the use of only a small amount of existing data, so there is no reliance on or need for specific regions to identify data that do not exist (West et al., Reference West, Kumar, Brown, Stohlgren and Bromberg2016). Overall, these features have led MaxEnt to be considered one of the best models for predicting species distributions, especially for species that are difficult to systematically enumerate or have limited ranges (Kramer-Schadt et al., Reference Kramer-Schadt, Niedballa and Pilgrim2013).
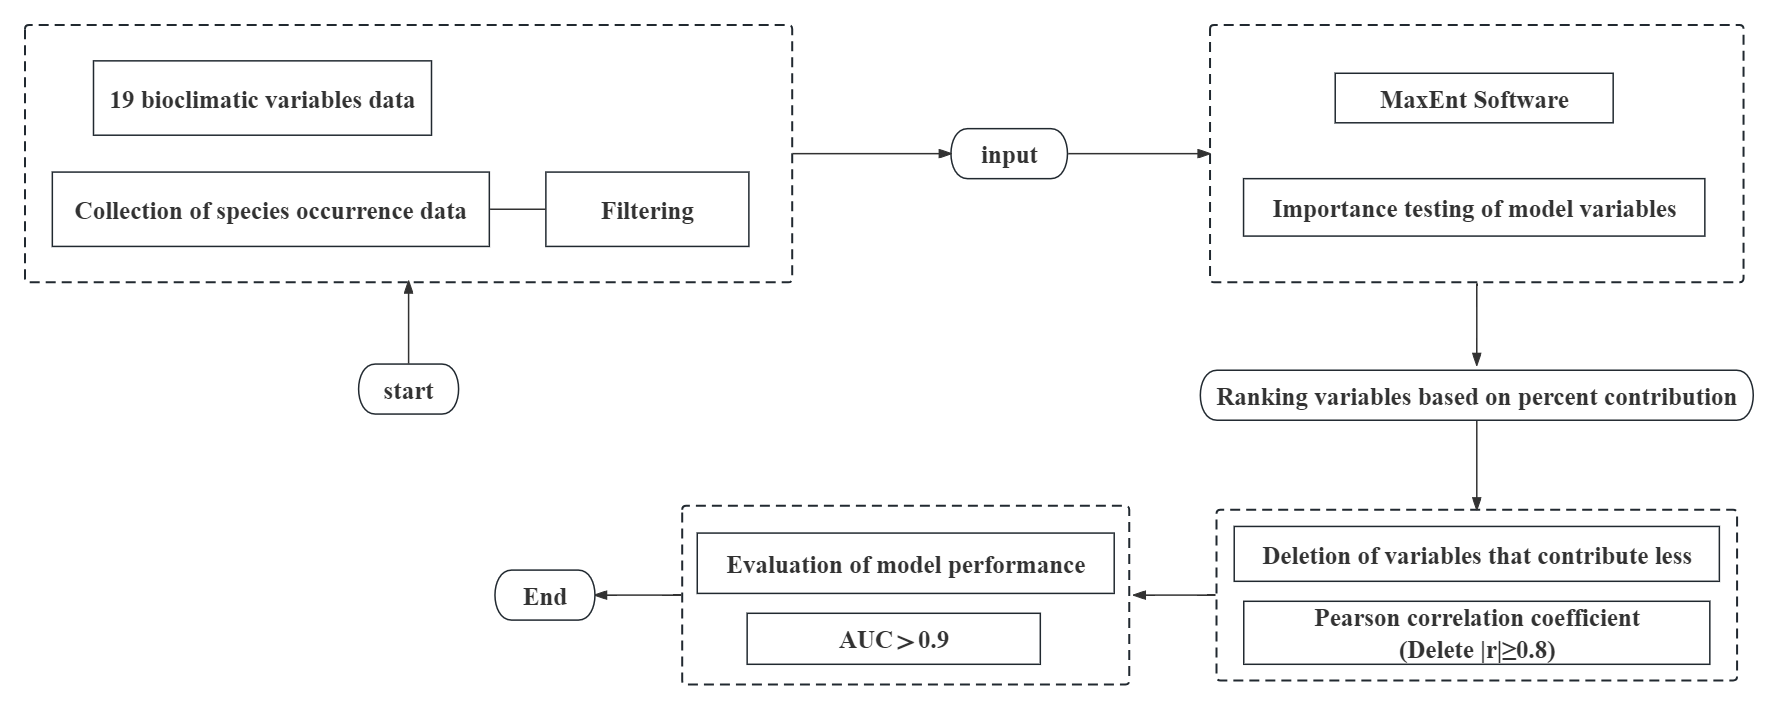
In this paper, the geographic distribution of the species was collected based on the MaxEnt model and linked to 19 bioclimatic variables, analysing the importance of each variable. Several key variables that are decisive for predicting the future distribution of the species were identified. The aim was to assess the current and potential future distribution of the pest in its Chinese range and to explore the key environmental factors influencing the distribution of the pest. This will provide some references for future control of this pest.
Material and methods
Collection of occurrence data
RPW distribution point data were obtained by querying the databases of the European and Mediterranean Plant Protection Organization (EPPO, https://gd.eppo.int, accessed on 21 March 2023) and the Global Biodiversity Information Facility (GBIF, http://www.gbif.org, accessed on 22 March 2023). In addition to the online databases, distribution point data for the actual survey were obtained from relevant literature in CNKI and Web of Science. The latitude and longitude information was obtained from the geographic coordinate information provided in the literature. For records missing latitude and longitude information, Google Earth (http://ditu.google.cn) was used to obtain latitude and longitude using county location descriptions. Occurrence records without accurate location information were excluded from the database. All records are scrutinised to remove duplicate points and points without correct information. For the MaxEnt model, the distribution point data were saved in ‘CSV’ format. To prevent overfitting, this study employed ENMTools version 1.0.4 on the R platform to spatially filter the data based on longitude, ensuring the presence of only one distribution point per grid cell. The spatial resolution was set at 2.5 arc minutes (approximately 4.5 km). In the end, a total of 222 RPW distribution points were acquired, and their distribution is depicted in fig. S1.
Environmental variables and data processing
The environmental variables are current and future data obtained from the WorldClim Global Climate Database (http://www.worldclim.org/) and include 19 bioclimatic variables as well as 48 monthly climate variables. Current climate conditions are expressed using monthly average data from 1950 to 2000. Three representative gas emission scenarios of 2.6 W m−2 (SSP1-2.6), 4.5 W m−2 (SSP2-4.5) and 8.5 W m−2 (SSP5-8.5) from the Shared Economy Pathway of the Sixth International Coupled Models Intercomparison Program (CMIP6) model were selected for the future climate scenario data. These scenarios were proposed by the IPCC, and respectively they represent a stabilisation of radiative forcing by 2100 in these scenarios. Future climate data were downloaded from the International Center for Tropical Agriculture (CIAT) and generated from the second generation of the National Climate Center Moderate Resolution Climate System Model (BCC-CSM2-MR). This model is more reliable in simulating precipitation and temperature in China, and it is the latest medium-resolution climate system model developed by the National Climate Center of China (Fredriksen et al., Reference Fredriksen, Smith, Modak and Rugenstein2023). The above data, with a spatial resolution of 2.5 arc-minutes (approximately 4.5 km2), were used to predict the distribution of potential suitability of the RPW for two periods: the 2050s (2041–2060) and the 2090s (2081–2100).
This study utilises the Jackknife test in MaxEnt to determine the extent to which each environmental variable contributes to the model construction, thereby eliminating variables that contribute less. Pearson's correlation coefficient is commonly used to determine the correlation between each pair of variables (|r|≥0.8). There are some effects on ENM predictions due to correlation and multicollinearity between climate factors. Highly correlated variables (|r|≥0.8) were removed in order to increase the accuracy of the model and minimise the effects of overfitting. Multicollinearity was detected using ENMTools (version 1.0.40). Finally, five key environment variables (BIO 1, BIO 2, BIO 6, BIO 16, BIO 17) were kept.
MaxEnt model optimisation and accuracy evaluation
In the MaxEnt model, improper selection of optimal parameters can negatively affect the prediction results, and the complexity of MaxEnt has a significant impact on the transferability of species predictions in the model (Alsamadisi et al., Reference Alsamadisi, Tran and Papeş2020). There are two key parameters present in MaxEnt model to optimise the final model viz: feature combination (FC) and regulation multiplier (RM). These two key parameters are crucial for effectively avoiding overfitting and significantly improving the model's prediction accuracy (Barber et al., Reference Barber, Ball, Morris and Gilbert2022). Consequently, in this paper, the complexity of the model is controlled by adding parameters to the ENMTools function to regularise the model. We imported the distribution data of RPW and 19 environmental variables into MaxEnt and set the parameters to the optimal combination. Meanwhile, the receiver operating characteristic curve (ROC) is plotted to evaluate the model fit. Refer to fig. S2 for the above process.
The area under curve (AUC) of the ROC curve is used to evaluate the quality of the model results. The AUC values are independent of the critical values in the model and can be used to assess the accuracy of the model. AUC ranges from 0 to 1, with 0–0.6 indicating very poor predictive performance, 0.7–0.8 indicating fair predictive performance, 0.8–0.9 indicating good predictive performance and 0.9–1.0 indicating excellent predictive performance (Wang et al., Reference Wang, Xu, Liao, Xu and Zhuo2023). Overall, the closer the value is to 1, the better the model fit.
Delineation of potentially suitable areas
In this study, the ASC file output from MaxEnt is imported into GIS, converted into grid data and superimposed on a map of Chinese administrative divisions for visualisation. Seventy-five per cent of the distribution records were used as a randomised training dataset to build the predictive model, and 25% of the remaining distribution records were used as a test dataset, repeating this operation ten times. On this basis, the reclassification function of GIS was utilised to classify the RPW fitness zones into different areas, and the corresponding area calculations were carried out using the grid calculation tool. In this work, the distribution values were classified according to the method of assessing probability in the IPCC report, and based on the suitability index P, the suitability areas were categorised into four classes: high suitability areas (P ≥ 0.66), medium suitability areas (0.33 ≤ P < 0.66), low suitability areas (0.05 ≤ P < 0.33) and unsuitable areas (P < 0.05) (Wang et al., Reference Wang, Xu, Liao, Xu and Zhuo2023).
Results
MaxEnt performance and the importance of environment variables
Figure 1 shows AUC with ten replications of the model. The mean test AUC value for its repeated runs was as high as 0.965 with a standard deviation of 0.012. The training AUC and test AUC were 0.967 and 0.964, respectively (table S1). Based on the previously mentioned evaluation criteria, it indicates that the model exhibits excellent predictive performance. AUC values exceeding 0.9 suggest that the model possesses high predictive accuracy.

Figure 1. AUC result of MaxEnt modelling.
The potential distribution of RPW under current climatic conditions was analysed using MaxEnt to model the variables selected for the study. This study was conducted by taking 19 climatic variables into account and then filtering out a few variables that are determinative of the impact of RPW. Jackknife test is shown in fig. 2. Minimum temperature of coldest month (BIO 6) provides the highest gain when used independently. The next largest contribution to the model is the annual mean temperature (BIO 1). The values shown in the graph are the average of repeated runs. Under current climatic conditions, these two environmental factors had the greatest effect on RPW growth suitability, suggesting that these factors themselves contain more useful information than the other variables. As can be seen from table 1, among the five environmental variables screened by MaxEnt, BIO 1 and BIO 17 have the highest contributions of 51.3% and 31.5%, respectively. The cumulative contribution of these two environmental factors to the RPW was 82.8%. The top three contributing bioclimatic variables were BIO 1, BIO 17 and BIO 6, with the cumulative value of the three reaching 93.80%. Therefore, BIO 1, BIO 17 and BIO 6 are the primary environmental variables that influence habitat suitability for RPW and respond well to potential habitat for RPW.

Figure 2. Jackknife plot of the training gain for R. ferrugineus.
Table 1. Environmental variables used in this study and their percentage contribution (%) to variation in the data

Species response and potential habitat suitability distribution
Figure 3 shows the response curves for the relationship between the probability of RPW presence and the five bioclimatic variables. The figure reflects the dependence of predictive appropriateness on the selected variables, as well as the dependence caused by correlations between the selected variables and other variables. The values shown in the graph are the average of ten repetitive runs. Based on the BIO 1 curve, it can be concluded that the interval of the yearly average temperature (BIO 1) is most suitable for the survival of RPW when it ranges from 24.6 to 29.4℃. In terms of the mean diurnal temperature difference (BIO 2), there was a consistently high response between 2.80 and 5.50℃, with a sharp downward trend starting at temperatures above 5.5℃, and the insect was no longer likely to survive once above 12℃. The minimum temperature of the coldest month (BIO 6) shows an increasing trend from −3.0℃, and stabilises to reach the optimal value after reaching 15.8℃, with its optimal interval ranging from 15.8 to 23.2℃. From fig. 3d, it can be seen that the suitability of RPW firstly shows an increasing trend with the increase of the amount of precipitation (BIO 16) in the wettest season, and then starts to decrease after the peak at 755 mm, and then the suitability tends to stabilise when it reaches 2200 mm. Precipitation in the driest quarter (BIO 17) peaks at 80 mm. It shows that RPW is positively correlated with suitability for precipitation in the driest quarter (BIO 17) below 80 mm, but negatively correlated with suitability above 80 mm. It is worth noting that it stops falling at 550 mm and shows a flat trend. The results showed that the suitability of RPW was greatest when the average annual temperature (BIO 1) ranged from 24.6 to 29.4℃, the average diurnal temperature difference (BIO 2) ranged from 2.80 to 5.50℃, the minimum temperature of the coldest month (BIO 6) ranged from 15.8 to 23.2℃, and the precipitation of the wettest season (BIO 16) was 755 mm, and the precipitation of the driest season (BIO 17) was 80 mm.

Figure 3. Response curves of the environmental variables that contributed the most to the MaxEnt models. (A) Annual mean temperature (BIO 1). (B) Mean diurnal range (mean of monthly (max temp–min temp) (°C)) (BIO 2). (C) Minimum temperature of coldest month (BIO 6). (D) Precipitation of wettest quarter (mm) (BIO 16). (E) Precipitation of driest quarter (mm) (BIO 17). The red line is the average response of the MaxEnt run. The blue part is the average±one standard deviation.
Figure 4 shows the distribution of the suitability zones of the contemporary RPW. The insect is distributed throughout the southeastern region, but the high suitability zone is mainly concentrated in the southeastern coastal region. The conditions for the formation of a monsoon climate are provided by the combined effect of warm and humid air currents from the oceans and dry and cold air currents from the continents; and because the southeastern part of China is in the tropics and subtropics, the climate type is mainly tropical monsoon climate or subtropical monsoon climate. Tropical monsoon climates have high temperatures throughout the year with distinct dry and rainy seasons for precipitation, while subtropical monsoon climates are at lower latitudes, and winters are milder rather than colder. Such climatic conditions are also exactly what the RPW needs.

Figure 4. Current suitable climatic distribution of R. ferrugineus in China. The probability of R. ferrugineus is shown by the colour scale in the area. Red indicates a highly suitable area with a probability of higher than 0.66, orange indicates a moderately suitable area with a probability of 0.33–0.66, yellow indicates a poorly suitable area with a probability ranging from 0.05 to 0.33, and white represents unsuitable areas.
Highly suitable areas are mainly located in Hainan, Guangdong, Fujian, Zhejiang, Guangxi, Taiwan and Yunnan provinces. Tables 2 and 3 show that the total area of highly suitable areas for RPW is currently 9.12 × 10⁴ km2, accounting for 1.0% of the area of China. Guangdong has the largest area of highly suitable areas, 3.06 × 10⁴ km2, accounting for 33.6% of the total area of highly suitable areas in the country. Overall, the proportionate area of high suitability zones is relatively small, with more areas in medium and low suitability zones.
Table 2. Analysis of the main suitable distributions of R. ferrugineus in China

a Indicates the total area of the corresponding province.
Table 3. Prediction of the suitable areas for R. ferrugineus under current and future climatic conditions

Current and future distribution projections and changes
This paper focuses on the distributional trends of RPW from two future periods, the 2050s and the 2090s, and three scenarios, SSP1-2.6, SSP2-4.5 and SSP5-8.5. The potential distribution hierarchy of RPW under the corresponding scenarios is also plotted (fig. 5), which clearly presents the future potential distribution changes of the beetle. For the high suitability area, the overall trend shows the same direction in both the 2050s and 2090s periods. The area decreases to varying degrees in both the SSP1-2.6 and SSP2-4.5 scenarios, while the increase is relatively large in both the SSP5-8.5 scenario. Under the 2050s SSP1-2.6, SSP2-4.5 and SSP5-8.5 scenarios, the RPW high suitability zones were 8.90 × 10⁴, 8.66 × 10⁴ and 13.51 × 10⁴ km2 respectively; under the 2090s SSP1-2.6, SSP2-4.5 and SSP5-8.5 scenarios, the RPW high suitability zones were 7.51 × 10⁴, 8.75 × 10⁴ and 11.05 × 10⁴ km2 respectively. The results show that the area of the high suitability zone shows an overall increasing trend. However, there is a general decrease in the area of medium suitability zones. The most significant decrease is −24.3% for the SSP5-8.5 scenario in the 2050s. In the future, the area of low suitability zones will continue to increase. Only in the 2090s did the SSP1-2.6 scenario show a small reduction in the area of low suitability zones. It is worth noting that while the high suitability district had the largest increase, the district originally had a relatively small overall area. So the high suitability zone is still much smaller than the low suitability zone, which is itself the largest. Overall, in the future, there will be an increase in the area of high and low suitability zones and a decrease in the area of medium suitability zones. The low suitability zone will continue to occupy the largest area.

Figure 5. Potential distribution of suitable areas for R. ferrugineus based on different climate change scenarios in China. The probability of R. ferrugineus is shown by the colour scale in the area. Red indicates a highly suitable area with a probability higher than 0.66, orange indicates a moderately suitable area with a probability of 0.33–0.66, yellow indicates a poorly suitable area with a probability ranging from 0.05 to 0.33, and white represents unsuitable areas.
Discussion
Predicting suitable habitats through SDMs has become an effective tool for invasive pest habitat suitability evaluation and pest control (Costa et al., Reference Costa, Ponte, Azevedo and Gil2015). Hence, using climate change under different scenarios as an entry point to explore the possibility of future distribution of RPW is crucial for the control of this pest. In this study, MaxEnt was used to simulate a suitable habitat for RPW under current and future climate scenarios. Environmental variables have an impact on the accuracy of the model during the modelling process (Bowler, Reference Bowler2014). So, in this paper, the environmental variables are filtered. In parallel, the sample size of the species occurrence data also has an impact on the predictive performance of the model during the analysis process (Halvorsen et al., Reference Halvorsen, Mazzoni, Dirksen, Næsset, Gobakken and Ohlson2016). It is shown that the analysis of different training samples regarding the reliability of the results leads to the conclusion that when the number of training samples reaches 20, the accuracy of the model basically meets the requirements. When the number of samples is greater than 30, MaxEnt will provide stable prediction results (Gao et al., Reference Gao, Liu, Zhao and Cui2023). In this study, a total of 222 training samples of RPW occurrence were used after screening, which provided a base guarantee for the accuracy of the prediction results (AUC = 0.965). Due to the greater significance of climate change in influencing species distribution, this article primarily focuses on discussing the current and future distribution of the pest from a climatic perspective. However, the distribution of a species is not solely dictated by climate; rather, it is shaped by the interplay of abiotic and biotic factors. Incorporating more factors into modelling considerations can enhance the accuracy of predictive outcomes. This direction is worth emphasising in future forecasting efforts.
Most of the highly suitable habitats for RPW are located in the hilly areas along the southeast coast of China. Among them, Taiwan Island and Hainan Island are the first and second largest islands in China, respectively, and the four sides of the sea as well as the distribution of hills are the main reasons why the whole island of these two islands belongs to the medium- and high-suitable habitats. It is worth noting that Hainan Island, with 76% of the island's highly suitable habitat area, should be a priority control area. The plains of the middle and lower reaches of the Yangtze River are the northernmost boundary between the unsuitable area and the low, medium and high suitable habitat areas. To the north of this boundary are the North China Plain, the second largest plain in China, and the Northeast China Plain, the first largest plain in China, both of which are in unsuitable areas. The insect prefers to survive in hilly areas. This coincides with the actual distribution of RPW, indicating that the MaxEnt prediction has some reference value.
As global warming continues, the area of distribution of RPW in low and high suitable habitat is likely to increase further, although the extent of variation in low and high suitable habitat for the insect varies under different climate scenarios. Fortunately, the overall distribution of RPW will continue to be concentrated in the southern regions without significant expansion towards the north. However, there is a more noticeable trend towards an increase in the proportion of high suitable areas in each province. There are many factors that influence the geographical distribution of species, and climate is among the most important. The key environmental variables affecting the distribution, namely BIO 1, BIO 2, BIO 6, BIO 16 and BIO 17, were screened based on the insect's contribution to the probability of occurrence, with BIO 1 having the greatest impact on the distribution; and the dividing line between the unsuitable areas and the low, medium and high suitable habitat areas mentioned above, as a whole, roughly coincides with the Qinling-Huaihe River line. This line is the 0℃ isotherm in January in China, and also the demarcation line between the warm temperate zone and the subtropical zone (Xu et al., Reference Xu, Qu, Han, Zeng and Li2021). This suggests that temperature may be a more important factor limiting the distribution of RPW in climatic conditions. BIO 1 represents the annual mean temperature. RPW demonstrates a higher suitability within the range of 24.6–29.4℃. However, the annual mean temperature in China typically ranges between 10 and 15℃ (Chaoli et al., Reference Chaoli, Yidong, Heli and Yuanyuan2023), indicating that the preferred temperature range of the insect exceeds the country's average. This is also one of the reasons why the RPW is not distributed in most parts of China. However, Hainan Province has the largest distribution of RPW. This province falls under a tropical monsoon climate, with an annual average temperature ranging from approximately 25 to 28℃ (Xinyue et al., Reference Xinyue, Mingjin and Buda2023), which creates favourable conditions for the survival of RPW. It is worth emphasising that in northern China, during the coldest months, the lowest temperature can drop to as low as −20℃ or even lower (Yu et al., Reference Yu, Xianjie, Jiahui and Chunhan2023). Due to the generally colder climate characteristics in the north, RPW tends to be concentrated in the southern regions. In China, the diurnal temperature variation decreases from northeast to southwest (Kebiao et al., Reference Kebiao, Yibo, Bing, Zijin and Mengmeng2023). Based on the preference of this pest for diurnal temperature variation, a range of 2.80–5.50℃ is considered suitable. Overall, RPW tends to favour environments with small diurnal temperature variations. The southern coastal regions of China happen to fall into this category. This coincides with the current concentrated distribution area, thus confirming the predictions of this study.
Based on the previous description of the harmful potential of RPW pests, the prevention and control of this insect are particularly important. In the final analysis, the future distribution prediction of RPW in this paper also aims to provide a reliable reference for better control of the insect as well as future control efforts in terms of geographic distribution. For farmers, more convenient chemical control is preferred when dealing with pest and disease problems. However, chemical control brings both the environmental pollution of pesticides, the resistance of RPW to pesticides and the health problems of workers, which cannot be avoided at present. In comparison, biological control appears to be safer. Some studies have shown that Entomopathogenic nematodes (EPNs) are an effective biocontrol agent against the insect. It can feed on and attack target pests without harming the environment and other non-target organisms. ENPs and their symbiotic bacteria have a reciprocal interaction that can kill the host in a short period of time and is a method of control worth considering (Nurashikin-Khairuddin et al., Reference Nurashikin-Khairuddin, Abdul-Hamid, Mansor, Bharudin, Othman and Jalinas2022).
In this work, 19 bioclimatic variables were combined and modelled using the MaxEnt model to explore the geographic distribution of the RPW in China. At the same time, a hierarchical assessment of the insect's suitable distribution area was carried out. The 19 bioclimatic variables characterise the climate mainly in terms of indicators of both temperature and precipitation. Although it is already a relatively well-established indicator for climate, the survival of a species will also be affected by topography, terrain, elevation, species competition, human activities, etc. (Morales and Fernández, Reference Morales and Fernández2020). As a result, there are limitations in the breadth of data collection, and the predicted potentially suitable area will deviate somewhat from the actual suitable area (Convertino et al., Reference Convertino, Muñoz-Carpena, Chu-Agor, Kiker and Linkov2014). In future prediction efforts, additional research should obtain richer data as the modelling technology continues to mature and to expand the biotic and abiotic variables in the model to produce more accurate predictions. Although there is some room for improvement, this study successfully predicted the potential suitable distribution area of RPW within China based on the MaxEnt model with high reliability.
Conclusion
In this study, the potential geographic distribution areas of the RPW under three climate change scenarios (SSP1-2.6, SSP2-4.5 and SSP5-8.5) were successfully simulated based on the MaxEnt model for the current and two future periods (2050s and 2090s). Under the current climatic conditions, these southeastern coastal areas, such as Hainan, Guangdong, Fujian, Guangxi and Taiwan, are the main regions of the high suitability zones, which cover a total area of 9.12 × 10⁴ km2. The most significant factors (thresholds) affecting their distribution were temperature followed by precipitation, including annual mean temperature (24.6–29.4℃), mean diurnal range (2.80–5.50℃), minimum temperature of coldest month (15.8–23.2℃), precipitation of wettest quarter (=755 mm) and precipitation of driest quarter (=80 mm). The predicted potentially suitable distribution areas for RPW are in excellent agreement with actual occurrences. In order to more accurately model changes in the suitable geographic distribution of the pest under future climate change scenarios and to better control the pest, the combined effects of biotic and abiotic factors need to be fully considered in future research. This work aims to provide some theoretical references for the prediction and forecasting work of RPW as well as in the area of pest and disease control.
Supplementary material
The supplementary material for this article can be found at https://doi.org/10.1017/S0007485324000336.
Author contributions
Conceptualisation, Danping Xu; data curation, Habib Ali and Sumbul Mureed; formal analysis, Zhiling Wang and Danping Xu; investigation, Quanwei Liu and Xuebin Yang; methodology, Zhiling Wang and Zhihang Zhuo; software, Danping Xu; supervision, Danping Xu; writing – original draft, Zhiling Wang; writing – review and editing, Danping Xu and Zhihang Zhuo. All authors have read and agreed to the published version of the manuscript.
Financial support
This work was funded by the Ministry of Sichuan Province Science and Technology Support Program (2022NSFSC0986) and China West Normal University Support Program (20A007, 20E051, 21E040 and 22kA011).
Institutional review board statement
Not applicable.
Informed consent statement
Not applicable.
Data availability statement
The data supporting the results are available in a public repository at: EPPO (2023) Rhynchophorus ferrugineus. EPPO datasheets on pests recommended for regulation. https://gd.eppo.int (accessed 2023-05-21), GBIF.org (22 March 2023) GBIF Occurrence Download https://doi.org/10.15468/dl.ctrqpv, and Zhiling Wang (2023). Rhynchophorus ferrugineus Olivier occurrence. figshare. Dataset. https://doi.org/10.6084/m9.figshare.23984130.v1.
Competing interests
None.