


Introduction
Ethnic and racial differences in human capital and earnings are one of the key determinants of inequality in Latin America (Reference De Ferranti, Perry, Ferreira and WaltonDe Ferranti et al. 2004; Reference Hall and PatrinosHall and Patrinos 2006; Reference ÑopoÑopo 2012). Although the specific social dynamics faced by Afro-descendants and indigenous peoples differ, both of these populations have systematically higher poverty rates and are disproportionately represented among the poor.Footnote 1 Fiscal redistribution is one of the policy levers the state has to address ethnoracial inequalities. As shown in a series of existing studies that apply the common methodological framework developed at the Commitment to Equity Institute (Tulane University), fiscal policy unambiguously reduces income inequality, albeit to different degrees.Footnote 2
Does fiscal policy also reduce income inequality between ethnic and racial groups?Footnote 3 This article analyzes the effects of fiscal policy on inequality along ethnic and racial lines for Bolivia, Guatemala, and Brazil in 2009, the year for which comparable analysis for these three countries is available.Footnote 4 These three countries were selected because they have large Afro-descendant (Brazil) and indigenous (Bolivia and Guatemala) populations, and welfare gaps between whites and nonwhites are quite high. Using the self-identification method to classify individuals,Footnote 5 the indigenous populations in Bolivia and Guatemala represent 54.2 and 40.7 percent of the total populations, respectively, the largest shares in the region. In the last census round in Brazil, 50.8 percent of the national population self-identified as Afro-descendant, the largest both in absolute and relative terms in Latin America.Footnote 6
A salient indicator of ethnoracial inequality is the extent to which the indigenous and Afro-descendant populations are disproportionately underrepresented among the higher income groups and disproportionately overrepresented among the poor.Footnote 7 If whites and nonwhites were similarly affected by social circumstances and market forces, one would expect the share of the nonwhite population at every income stratum to be roughly equal to its share in the total population. However, this is far from true. In Bolivia, Brazil, and Guatemala, the share of the nonwhite population is roughly 54.2, 50.8, and 40.7 percent, respectively. And, yet, before fiscal redistribution, nonwhites represent 71.7 percent in Bolivia, 74.2 percent in Brazil, and 60.8 percent in Guatemala. The overrepresentation of nonwhites among the poor is just the other side of the coin of how poverty affects the different ethnoracial groups. The indigenous and Afro-descendant peoples face a considerably higher probability of being poor than does the white population. The probability of being poor is measured by the head count ratio.Footnote 8 In Bolivia and Guatemala, the head count ratio (with the national poverty line) is 14.7 and 20.6 percent, respectively, for the nonindigenous population, but 31.5 and 46.6 percent, respectively, for the indigenous population. In Brazil, the head count ratio is 5.2 percent for the white population but 14.6 percent for Afro-descendants.
To what extent does fiscal policy reduce the gap in the probability of being poor for different ethnic and racial groups? I will answer this question using fiscal incidence analysis, which essentially allows us to trace the changes in people’s incomes from incomes before taxes and transfers to incomes after taxes and transfers. The specific components of fiscal policy looked at here are direct taxes and transfers (such as personal income tax and cash transfers), indirect taxes (such as value-added taxes or VAT and excise taxes), and subsidies (such as energy and food price subsidies). The article draws from the following Commitment to Equity Institute studies: Bolivia: Paz Arauco et al. (Reference Paz Arauco, Molina, Pozo and Aguilar2013, Reference Paz Arauco, Molina, Pozo, Aguilar, Lustig, Pessino and Scott2014); Brazil: Higgins and Pereira (Reference Higgins and Pereira2013 and Reference Higgins, Pereira, Lustig, Pessino and Scott2014) and Pereira (Reference Pereira and Lustig2017); and Guatemala: Cabrera, Lustig, and Moran (Reference Cabrera, Lustig and Moran2015).Footnote 9 The results can be compared across countries because the studies use the same fiscal incidence methodological framework, described in Lustig and Higgins (Reference Lustig and Higgins2013) and Lustig (Reference Lustig2017a). The household surveys used for the analyses are, in Bolivia, Encuesta de Hogares, 2009; in Brazil, Pesquisa de Orçamentos Familiares, 2009; and in Guatemala, Encuesta Nacional de Ingresos y Gastos de las Familias, 2009–2010.
In the three countries, although fiscal policy reduces ethnoracial gaps, the change is negligibly small and in some instances does not exist. While, as I will show below, cash transfer programs targeted to the poor tend to redistribute more resources to Afro-descendants and indigenous groups, they are too small to make a significant difference in terms of ethnoracial differentials in poverty rates.
Fiscal Incidence Analysis: A Brief Overview
Fiscal incidence analysis is used to assess the distributional impacts of a country’s taxes and transfers.Footnote 10 Essentially, it consists of allocating taxes and public spending (particularly social spending) to households or individuals so that one can compare incomes before with incomes after net taxes. The fiscal incidence analysis used here—known as the “accounting approach”— is a point-in-time analysis and does not incorporate behavioral or general equilibrium effects. That is, no claim is made that the original or market income equals the true counterfactual income in the absence of taxes and transfers. It is a first-order approximation that measures the average incidence of fiscal interventions.
However, the analysis is not a mechanically applied accounting exercise. The incidence of taxes is the economic rather than statutory incidence. Consistent with other conventional tax incidence analyses, here we assume that the economic burden of direct personal income taxes is borne by the recipient of income. The burden of payroll and social security taxes is assumed to fall entirely on workers. It is assumed that individual income taxes and contributions by both employees and employers, for instance, are borne by labor in the formal sector. Individuals who are not contributing to social security are assumed to pay neither direct taxes nor contributions. Consumption taxes are assumed to be shifted forward to consumers. In the case of consumption taxes, the analyses take into account the lower incidence associated with own consumption, rural markets, and informality. These assumptions are strong because, in essence, they imply that labor supply is perfectly inelastic and that consumers have perfectly inelastic demands for goods and services. In practice they provide a reasonable approximation.Footnote 11
A fiscal incidence study must start by defining the basic income concepts that are used to assess the effects of fiscal policy on people’s incomes and their distribution. In this article, there are three basic income concepts.
Market income, also called primary or original income, is total current income before direct taxes and transfers.Footnote 12 It equals the sum of gross (pretax) wages and salaries in the formal and informal sectors (also known as earned income); income from capital (dividends, interest, profits, rents, and so on) in the formal and informal sectors (excluding capital gains and gifts); consumption of own production; imputed rent for owner-occupied housing; and private transfers (remittances, pensions from private schemes, and other private transfers such as alimony).
Disposable income is market income minus direct personal income taxes on all income sources (included in market income) that are subject to taxation plus direct government transfers (mainly cash transfers but also including near-cash transfers such as food transfers, free textbooks, and school uniforms).
Consumable income is disposable income plus indirect subsidies (such as food and energy price subsidies) minus indirect taxes (such as value-added taxes, excise taxes, and sales taxes).
These concepts are summarized in Figure 1.

Figure 1 Fiscal redistribution and income concepts. Source: Lustig and Higgins (Reference Lustig and Higgins2013).
Taxes, Transfers, and Subsidies
Bolivia
Taxes
In 2009, total tax revenues amounted to 26.9 percent of GDP. In Bolivia, income tax is negligible and was not included in the analysis.Footnote 13 There are four indirect taxes applied to consumption were included in the analysis: a value-added tax (VAT), a transaction tax, a special tax on hydrocarbons, and a specific consumption tax (excise taxes), all of which account for 41 percent of total tax revenues in 2009 (or 11 percent of GDP).
Transfers
In 2009, the year of the survey used for the fiscal incidence analysis, spending on direct transfers equaled 2.0 percent of GDP. With spending at 1.4 percent of GDP in 2009, the largest direct cash transfer program was the noncontributory pension program Renta Dignidad. Implemented in 2008, the program built on an earlier transfer program created in 1994 (Bono Solidario, known as Bonosol). Beneficiaries are citizens aged sixty or older. In 2009, the program benefited close to 800,000 people. Direct transfers also included two flagship conditional cash transfer programs: Bono Juancito Pinto and Bono Juana Azurduy.
The Bono Juancito Pinto was launched to promote primary school attendance. All children between six and nineteen years of age attending public schools are eligible for the program. The transfer consists of a yearly payment equal to 200 bolivianos, approximately $0.18/day (in 2005 purchasing power parity, or PPP) paid once a year, conditional on proven attendance during the school year.Footnote 14 According to the program’s roster, 1.7 million children benefited from the transfer in 2009, with public expenditures equaling 0.3 percent of GDP. The Bono Juana Azurduy was created in 2009 with the purpose of promoting prenatal health, infant checkups, and an increase in the rate of hospital-attended births. Only mothers and children without access to health insurance are eligible. The program consists of a maximum transfer of 1,820 bolivianos over a maximum period of thirty-three months (equivalent to an average of $0.58 PPP/day). According to the program registry, 776,045 women and children benefited from the program in 2009. Public expenditure on the program reached 0.02 percent of GDP.
Desayuno Escolar (school breakfast program) provides breakfast to children between the ages of four and nineteen who attend school. The per capita average cost of the program is 9 bolivianos per month, about $0.1 PPP/day. In 2008, the program benefited 1,985,158 people. Resources spent on the program reached 0.2 percent of GDP in 2009. The war veterans’ transfer program Beneméritos del Chaco consists of an average monthly payment of 1,254 bolivianos, equivalent to $13.2 PPP/day, paid to veterans of the Chaco War (1932–1935). In 2009, the payment benefited more than one thousand veterans and resources spent on the program amounted to 0.14 percent of GDP.
Subsidies
Indirect subsidies include the subsidized fraction of liquid gas and the subsidized fraction of gasoline consumed by households. In 2009 subsidies were equivalent to 0.6 percent of GDP.
Brazil
Taxes
Total fiscal revenues at the federal, state, and municipal levels were about 35 percent of GDP in 2009, much higher than the Latin American average.Footnote 15 Direct taxes (personal and corporate) represented 45 percent of the taxes levied by the government, and indirect taxes represented 55 percent. The Brazilian tax system is exceedingly complex. The taxes included in the incidence analysis are direct personal income taxes and consumption taxes. The most important indirect tax is the ICMS, a state tax levied on the sale or physical movement of goods, freight, transportation, communications services, and electricity. ICMS accounted for 21 percent of fiscal revenues in 2009. Other important indirect taxes are the COFINS (federal tax on goods and services to finance the social security deficit), ISS (municipal tax on services), PIS (federal tax on goods and services to finance social services for workers), and IPI (federal tax on industrial products). They correspond to 10.8, 4.1, 2.9, and 2.8 percent of fiscal revenues, respectively. Many indirect taxes operate with their own administering department, which may be at the federal, state, or municipal level, compounding on each other, something known as the “cascading effect.” These effects are especially important due to their impact on consumer purchasing power. Exemptions on consumption taxes are almost nonexistent in Brazil and, hence, the effective rates paid on basic food products in Brazil can be especially deleterious for the poor.
Transfers
In 2009, direct transfers included in the incidence analysis were roughly equal to 4 percent of GDP. Special Circumstances Pensions, the largest program in terms of spending (2.3 percent of GDP), are designed to smooth the impact of idiosyncratic shocks or are means tested. They are paid in the case of an accident at work, sickness, or related idiosyncratic shock. Although these pensions are funded by the contributory pension system, they are considered noncontributory because they have low or no requirements in terms of length of contribution period. In 2009, there were about 2.9 million beneficiaries (INSS 2010) and the average benefit per person was $5.22 PPP per day.
Bolsa Família, Brazil’s flagship conditional cash transfer program, transfers cash to eligible families in exchange for complying with certain conditions. Eligible families are poor families with children less than eighteen years of age or with pregnant women, and all extreme poor (the latter group is regardless of having children). Eligibility is determined through partially verified means testing; households with income below the cutoffs are incorporated into the program. The conditions are prenatal and postnatal care sessions for pregnant women, adherence to a calendar of vaccinations for children up to age five, and a minimum level of school attendance for children ages six to seventeen. There are no conditions for the “fixed benefit” given to extremely poor households. In 2009, the government spent 0.4 percent of GDP on 41.2 million individuals living in beneficiary families, and the average benefit per person living in a beneficiary household was US$0.35 PPP per day.
Benefício de Prestação Continuada (Continued Payment Benefits, BPC) is a noncontributory pension program that provides a monthly monetary transfer of one minimum salary (465 reais per month or US$8.83 PPP per day in 2009) to elderly poor or incapacitated poor. Elderly means sixty-five years old and older, and incapacitated is determined by doctors based on ability to work. In 2009, the government spent 0.5 percent of GDP on this program and there were 3.2 million beneficiaries and the average benefit per person living in a beneficiary household was US$2.18 PPP per day.
Other social transfers such as Food Transfer Programs (Programa de Aquisição de Alimentos, PAA), Unemployment Insurance, and other smaller programs represented 0.9 percent of GDP.
Subsidies
The main indirect subsidy in Brazil, the Social Tariff on Electric Energy (TSEE), is a price subsidy on energy for low-income households with total energy consumption below 220 kilowatt hours per month. In 2009, the average benefit per person in a beneficiary household was US$0.36 PPP per day.
Guatemala
Taxes
One of the structural features of the Guatemalan tax system is the low level of tax revenues.Footnote 16 Total tax revenue as a percentage of GDP (including contributions to the social security system) is only 12.2 percent. Direct taxes composed almost 27 percent of the total, while indirect taxes were a little over 60 percent. Of total direct taxes, personal income tax is only 2.9 percent. The VAT is over 40 percent of total tax revenues. The VAT general rate is 12 percent and zero for exports. Generic medicines, certain financial services, education, low-value sales of food bought in cantonal and municipal markets (value less than 100 quetzales, approximately $13), and resale of real estate property are exempt. Other indirect taxes, which include excise taxes on consumption of gasoline and diesel, beverages, tobacco, stamp tax, and cement, amount to 12.6 percent of total tax revenues.
Transfers
In 2010, there were five main cash transfers programs: a conditional cash transfer (CCT) called Mi Familia Progresa (MIFAPRO), a noncontributory pension program called Economic Assistance Program for the Elderly (Programa de Aporte Económico del Adulto Mayor), a food transfer program called Bolsa Solidaria, two educational scholarships program called Bolsa de Estudio and Becas Solidarias, and a small cash transfer for transportation called Bono de Transporte. From this list, the most relevant programs are MIFAPRO and the noncontributory pension. Together they represented 0.5 percent of GDP; the rest were very small programs that altogether amount to 0.1 percent of GDP. In 2010, spending on MIFAPRO program was 0.4 percent of GDP, the number of beneficiaries was 2.7 million and the average per capita transfer among beneficiary households was about $57 PPP dollars per year. The program covered 51 percent of the indigenous poor and 23 percent of the nonindigenous poor.
Subsidies
The most important consumption subsidies were a subsidy on electricity for households that consume less than 300 kilowatt hours per month, and a public transportation subsidy that was delivered to owners of public buses (in Guatemala City and major cities of the country). Both subsidies represent 0.3 percent of GDP, and the beneficiaries lived in urban areas.
Indicators of Fiscal Redistribution in the Ethnoracial Space
A fiscal incidence analysis designed to assess how governments reduce the welfare gap between ethnic and racial groups needs to identify indicators that can capture how income inequities across these groups change with fiscal interventions.
The most obvious indicator of ethnoracial income inequality is the ratio of per capita income between the indigenous and nonindigenous populations and between Afro-descendants and the white population. A second commonly used indicator is the contribution of inequality between ethnic or racial groups to overall inequality. This is usually measured by identifying the between- and within-group inequality with a standard decomposable inequality indicator such as the Theil index. In addition, a society with high ethnoracial equity should feature fairly equal opportunities across ethnic and racial groups. To assess the extent to which fiscal policy equalizes opportunities, following the ideas originally set out by Roemer (Reference Roemer1998) and their application by Barros et al. (Reference Barros, Ferreira, Vega and Saavedra2009), I propose to use an indicator that can track the extent to which taxes and transfers reduce the inequality associated with circumstances. Circumstances are predetermined factors that are not dependent on an individual’s effort, such as ethnicity and race, gender, place of birth, and parents’ education or parents’ income. In these national surveys, information on parents or place of birth is not available. Thus, for our purposes, circumstances include race or ethnic group, gender, and location (rural or urban).Footnote 17
A third key indicator is, of course, the extent to which the indigenous and Afro-descendant populations are disproportionately underrepresented among the higher income groups and disproportionately overrepresented among the poor. As stated before, if whites and nonwhites were similarly affected by social circumstances and market forces, one would expect the share of the nonwhite population at every income stratum to be roughly equal to its share in the total population, and the probability of being poor to be approximately the same for whites and nonwhites. The probability of being poor is simply the head count ratio (also known as the incidence of poverty), that is, the ratio of the poor population divided by the total.Footnote 18
The question is to what extent fiscal redistribution reduces these measures of inequity across ethnic and racial groups. In order to estimate the impact of fiscal redistribution, we need to calculate the above indicators for the three different income concepts presented in Figure 1: market income, disposable income, and consumable income.
Main Results
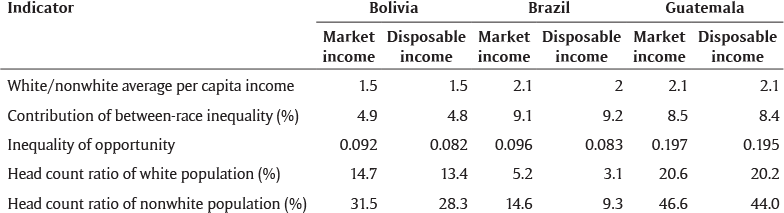
Ethnic and racial inequality in all three countries is high (Table 1). Per capita market (prefiscal) income of the white population is between 60 percent and two times higher than the Afro-descendants or indigenous population’s income. Also shown in Table 1, the indigenous and Afro-descendant populations represent a considerably larger share of the poor than they do of the total population. The probability of being poor (measured by the head count ratio using national extreme poverty lines) is between two and three times higher for indigenous and Afro-descendants than whites.Footnote 19 Although not shown in the table, average educational attainment levels are roughly between two and three years lower for Afrodescendant or indigenous populations in all three countries.
Table 1 Ethnic and racial inequality before taxes and transfers: Bolivia, Brazil, and Guatemala.

Source: Author’s calculations based on the following sources: Bolivia: Paz Arauco et al. (Reference Paz Arauco, Molina, Pozo and Aguilar2013); Brazil: Higgins and Pereira (Reference Higgins and Pereira2013); and Guatemala: Cabrera, Lustig and Moran (Reference Cabrera, Lustig and Moran2015).
Notes: Household surveys: Bolivia (Encuesta de Hogares, 2009), Brazil (Pesquisa de Orçamentos Familiares, 2009), and Guatemala (Encuesta Nacional de Ingresos y Gastos de las Familias, 2009–2010).
All the measures presented above use prefiscal or market income, defined as gross wages and salaries, income from capital, private transfers and contributory pensions; it includes consumption of own production (except for Bolivia) and imputed rent for owner’s occupied housing.
The nonwhite population for Bolivia and Guatemala refer to the indigenous population; and in the case of Brazil, to the Afro-Brazilian (pardo and preto) population.
Poverty is measured for per capita market income with national extreme poverty lines.
The contribution of between ethnic and racial groups components to overall inequality corresponds to the “between” component of a standard decomposition of the Theil index.
Fiscal Policy, Inequality, and Poverty in the Ethnoracial Space
What is the impact of direct taxes and direct transfers on ethnic and racial inequality? Using the indicators described above, Table 2 reveals that the impact is negligible. Although the indicators tend to move in the right direction, the order of magnitude of the change is quite small or nonexistent. The ratio of average per capita incomes by ethnicity or race declines by one decimal point (Bolivia and Brazil) to nothing (Guatemala).Footnote 20 Inequality of opportunity also declines by a relatively small amount. While fiscal policy reduces overall inequality in all three countries, it is interesting to note that the contribution of the between-race component in Brazil increases. This means that in Brazil, fiscal policy is making intraracial inequality fall at a faster rate than interracial inequality.
Table 2 Ethnoracial gaps before (market income) and after direct taxes and transfers (disposable income): Bolivia, Brazil, and Guatemala.
Source: Author’s calculations based on the following sources: Bolivia: Paz Arauco et al. (Reference Paz Arauco, Molina, Pozo and Aguilar2013); Brazil: Higgins and Pereira (Reference Higgins and Pereira2013); and Guatemala: Cabrera, Lustig and Moran (Reference Cabrera, Lustig and Moran2015).
Notes: Household surveys: Bolivia (Encuesta de Hogares, 2009), Brazil (Pesquisa de Orçamentos Familiares 2009), and Guatemala (Encuesta Nacional de Ingresos y Gastos de las Familias, 2009–2010).
All the measures presented above use market (pre-fiscal) income, defined as gross wages and salaries, income from capital, private transfers and contributory pensions; it includes consumption of own production (except for Bolivia) and imputed rent for owner’s occupied housing. Disposable income equals market income minus personal income taxes and contributions to social security plus direct transfers (cash and near cash such as food and school uniforms).
The nonwhite population for Bolivia and Guatemala refer to the indigenous population; and in the case of Brazil, to the Afro-Brazilian (pardo and preto) population.
Poverty is measured for per capita income with national extreme poverty lines.
The contribution of between ethnic and racial groups components to overall inequality corresponds to the “between” component of a standard decomposition of the Theil index.
Inequality of opportunity is measured by the mean log deviation of smoothed distribution with gender of head, location (rural or urban), and race/ethnicity as circumstances.
Although the difference in the probability of being poor after direct taxes and transfers declines,Footnote 21 as Table 3 shows the difference in head count ratios by ethnic group and race remain very large. More importantly, when the combined effect of both direct and consumption taxes net of transfers and subsidies is considered, fiscal interventions slightly reduce the differences in the probability of being poor between ethnic and racial groups in Guatemala and Bolivia but in Brazil there is no change. That is, in Brazil the effect of cash transfers on narrowing the difference in the probability of being poor between Afro-descendants and whites is completely wiped out by the effect of consumption taxes.
Table 3 Differences in probability of being poor by ethnic and racial group by income concept: market income, disposable income and consumable income.

Source: Author’s calculations based on the following sources: Bolivia: Paz Arauco et al. (Reference Paz Arauco, Molina, Pozo and Aguilar2013); Brazil: Higgins and Pereira (Reference Higgins and Pereira2013); and Guatemala: Cabrera, Lustig, and Moran (Reference Cabrera, Lustig and Moran2015).
Notes: Household surveys: Bolivia (Encuesta de Hogares, 2009), Brazil (Pesquisa de Orçamentos Familiares, 2009), and Guatemala (Encuesta Nacional de Ingresos y Gastos de las Familias, 2009–2010).
The probability of being poor is measured as the head count ratio. Market (prefiscal) income is defined as gross wages and salaries, income from capital, private transfers and contributory pensions; it includes consumption of own production (except for Bolivia) and imputed rent for owner’s occupied housing. Disposable income equals market income minus personal income taxes and contributions to social security plus direct transfers (cash and near cash such as food and school uniforms). Consumable income is defined as disposable income minus consumption taxes (e.g., value-added taxes, sales taxes, etc.) plus consumption subsidies (e.g., food, energy, etc.).
The nonwhite population for Bolivia and Guatemala refer to the indigenous population; and in the case of Brazil, to the Afro-Brazilian (pardo and preto) population.
Poverty is measured for per capita income with national extreme poverty lines.
Incidence of Direct Cash Transfers across Ethnic and Racial Groups
As seen above, fiscal interventions have little impact on the indicators we selected to measure the ethnoracial gap in the income space. In fact, when (net) indirect taxes are added, the differences in the probability of being poor do not change (Brazil) or fall only slightly (Bolivia and Guatemala). Are there specific characteristics of the fiscal system that may be associated with these rather disappointing outcomes? As shown in Figures 2, 3, 4, the incidence of direct cash transfers for the bottom deciles of Afro-descendants and indigenous populations is higher than for the bottom deciles of the nonindigenous and white populations. Thus, the fact that fiscal policy is so limited in its ability to reduce ethnoracial income gaps is more a consequence of the small size of cash transfers than their distribution between ethnic and racial groups.

Figure 2 Bolivia: incidence of direct cash transfers by ethnic and racial groups (shares in percent). Author’s calculations based on Paz Arauco et al. (Reference Paz Arauco, Molina, Pozo and Aguilar2013).

Figure 3 Brazil: incidence of direct cash transfers by ethnic and racial groups (shares in percent). Author’s calculations based on Higgins and Pereira (Reference Higgins and Pereira2013).

Figure 4 Guatemala: incidence of direct cash transfers by ethnic and racial groups (shares in percent). Author’s calculations based on Cabrera, Lustig, and Moran (Reference Cabrera, Lustig and Moran2015).
The flagship cash transfers are Bono Juancito Pinto in Bolivia, Bolsa Família in Brazil, and Mi Familia Progresa in Guatemala.Footnote 22 The share of GDP (in the year of the survey) allocated to each is only 0.3, 0.4, and 0.3 percent, respectively. Given the huge income gaps and the large differences in numbers of poor people, it is not surprising that redistributive policy achieves so little reduction in inequity in the ethnoracial space.
Furthermore, while it is generally true that per capita cash transfers for the indigenous and Afro-descendants are systematically higher in the three countries, there is an exception: the Special Circumstances Pensions (Pensões e Outros Benefícios) in Brazil. The cash transfers in this program are designed to smooth the impact of idiosyncratic shocks such as accident at work, sickness, or other individual shocks. In 2009, there were about 2.9 million beneficiaries (INSS 2010) and the average benefit per person was $5.22 PPP per day. Although these transfers are funded by the contributory pension system, they are considered noncontributory because they have low or no requirements in terms of length of time of contribution. To be eligible, however, individuals must be registered in the social security system. There clearly must be a factor that explains why Afro-descendants are less likely to register. This is a result that deserves further investigation so that this bias toward the white population can be corrected.
Concluding Remarks
The importance of reducing ethnoracial inequalities arises both from what this divide means ethically as well as its causes and consequences. Today’s ethnic and racial inequalities are often the product of morally condemnable societal actions such as discrimination in the present and subjugation of indigenous groups and slavery in the past. Due to the discrimination that indigenous peoples and Afro-descendants face in Latin America and the resulting gaps, these ethnic and racial groups are what philosophers would call “morally relevant” groups and, as a result, policies developed to correct these gaps would be deemed ethically acceptable (Reference Nickel and CahnNickel 2002). In addition, ethnic and racial inequalities are found to be associated with lower overall development and growth (Reference Alesina, Michalopoulos and PapaioannouAlesina et al. 2012; Reference Easterly and LevineEasterly and Levine 1997). Thus, addressing ethnoracial inequalities may have the additional benefit of generating higher welfare levels for everyone.
While fiscal redistribution can play a role in reducing income inequality in the ethnoracial space, our results show that the impact is very limited. Using several indicators, I showed that taxes and transfers reduce ethnoracial inequality very little or not at all. This is due in large part to the small magnitude of government spending on targeted cash transfers programs. However, the difference in, for instance, the number of poor people by ethnicity and race is so large, that it is unlikely it can be significantly reduced through just income transfers. Nonetheless, at the minimum, the design of transfer programs should avoid exacerbating ethnoracial inequalities. As discussed above, this is the case with the Special Circumstances Pensions in Brazil, which disproportionately benefit the white population because Afro-Brazilians are less likely to be enrolled.
Acknowledgements
This article is part of “Incidence of Taxes and Social Spending by Ethnicity and Race,” a joint project of the Commitment to Equity (CEQ) Institute and the Gender and Diversity Division of the Inter-American Development Bank. Led by Nora Lustig since 2008, the CEQ is a joint initiative of the Center for Inter-American Policy and Research and the Department of Economics at Tulane University and the Inter-American Dialogue (www.commitmentoequity.org). For their very useful comments and feedback on earlier drafts, I am very grateful to Suzanne Duryea, Ariel Fiszbein, Miguel Jaramillo, Andrew Morrison, Judith Morrison, Marcos Robles, and participants of the November 21, 2013, and May 12, 2014, seminars at the Inter-American Development Bank, as well as to José R. Jouve-Martín and Philip Oxhorn, editors of the special issue of the Latin American Research Review, and to two anonymous reviewers. I am also very grateful to Adam Ratzlaff for his excellent research assistantship as well as to Ana Lucia Iturriza and Eliana Rubiano for their valuable support in the coordination of the project.


 Open access