


Factual and counterfactual learning in adolescent depressive disorder, evidence from an instrumental learning study
In the modern era, depression has increasingly emerged as one of the most challenging and troubling of mental health disorders, apparently exacerbated as a consequence of the COVID-19 pandemic (Miller & Campo, Reference Miller and Campo2021; Santomauro et al., Reference Santomauro, Herrera, Shadid, Zheng, Ashbaugh, Pigott and Ferrari2021). During development, the incidence of depressive disorder rises strikingly at puberty and following adult trends, is more pronounced for females (Paus, Keshavan, & Giedd, Reference Paus, Keshavan and Giedd2008; Stevanovic, Jancic, & Lakic, Reference Stevanovic, Jancic and Lakic2011). Notably, both in Asia and the West, the prevalence of adolescent depression is skyrocketing in recent years and has emerged as a major public health concern of the first order. Notably, adolescent depression is gaining considerable attention both from governments and society as a whole (Clayborne, Varin, & Colman, Reference Clayborne, Varin and Colman2019; Lu, Reference Lu2019; Twenge, Cooper, Joiner, Duffy, & Binau, Reference Twenge, Cooper, Joiner, Duffy and Binau2019).
Prior studies of depression, including in adolescence, suggest that individuals with depressive symptoms experience the world around them in a more negative manner which presents either as hypersensitivity toward punishment or hyposensitivity to rewards (Kube, Schwarting, Rozenkrantz, Glombiewski, & Rief, Reference Kube, Schwarting, Rozenkrantz, Glombiewski and Rief2020; Nielson et al., Reference Nielson, Keren, O'Callaghan, Jackson, Douka, Vidal-Ribas and Stringaris2021). Toward a better understanding of the latent mechanisms underpinning adolescent depression, a considerable group of studies have applied instrumental learning tasks to reveal behavioral regularities of decision making (Bavard, Rustichini, & Palminteri, Reference Bavard, Rustichini and Palminteri2021; Frank, Seeberger, & O'reilly, Reference Frank, Seeberger and O'reilly2004; Gillan, Otto, Phelps, & Daw, Reference Gillan, Otto, Phelps and Daw2015). The key feature of the instrumental reinforcement learning task is that it connects situations with actions and individuals to achieve goal-oriented behaviors through trial-and-error exploration (Sutton & Barto, Reference Sutton and Barto2018). Notably, action selection will not only determine imminent rewards, but could also shape belief and value formation in subsequent trials. These considerations make it feasible to characterize both the qualitative and quantitative dynamics of learning behavior in both adult and adolescent depression.
Computational modeling of reward (Berwian et al., Reference Berwian, Wenzel, Collins, Seifritz, Stephan, Walter and Huys2020; Montague, Dolan, Friston, & Dayan, Reference Montague, Dolan, Friston and Dayan2012), and the refinement of our understanding of reward as ‘reward prediction error’ (RPE), especially as encoded by midbrain dopamine neurons, offers a window into a better understanding of the blunted reward response in the adolescent depressive patient (Ng, Alloy, & Smith, Reference Ng, Alloy and Smith2019; Stringaris et al., Reference Stringaris, Vidal-Ribas Belil, Artiges, Lemaitre, Gollier-Briant and Wolke2015). In the framework of RPE, it is crucial to differentiate the positive RPE from the negative RPE and track the potential asymmetric response over the valence (either positive or negative). Implementing this approach makes it feasible to examine the potential asymmetric response, viz. whether the valence reflects ‘good news’ or ‘bad news’ for belief updating. As indicated in widely-used psychological paradigms implemented in recent series of studies, instead of arriving at an accurate belief, individual tends to interpret the choice-contingent outcome to form a belief to achieve a desirable manner for their own sake (e.g. optimistic bias, Bromberg-Martin & Sharot, Reference Bromberg-Martin and Sharot2020; Ma et al., Reference Ma, Li, Wang, Liu, Li, Yan and Han2016; Sharot, Reference Sharot2011; Sharot, Riccardi, Raio, & Phelps, Reference Sharot, Riccardi, Raio and Phelps2007).
Applying the instrumental learning task, for typical individuals, Lefebvre, Lebreton, Meyniel, Bourgeois-Gironde, and Palminteri (Reference Lefebvre, Lebreton, Meyniel, Bourgeois-Gironde and Palminteri2017) suggests that there is an inclination to assign a higher weight (learning rate) toward the reward, or positive prediction error, in comparison to negative prediction error. This tendency has been termed optimistic bias and this optimistic update is congruent at the neural level, as revealed by fMRI analysis, with an increasing RPE signal in the reward-related region brain regions (striatum). This optimistic bias is coincident with the findings from the studies of belief updating with a priori desirability or undesirability (Sharot & Garrett, Reference Sharot and Garrett2016; Sharot, Velasquez, & Dolan, Reference Sharot, Velasquez and Dolan2010).
In depressive disorders, however, Korn, Sharot, Walter, Heekeren, and Dolan (Reference Korn, Sharot, Walter, Heekeren and Dolan2014) found that such an optimism bias with prior belief tends to be absent for depressive patients and, moreover, is correlated with a higher Beck Depression Inventory score. From the perspective of RPE, Kumar et al. (Reference Kumar, Goer, Murray, Dillon, Beltzer, Cohen and Pizzagalli2018) suggests the depressive subjects selectively reduce positive RPE rather than enhance punishment or negative RPE. At the neural level, depressive subjects exhibit corresponding reduced striatal-midbrain connectivity. Altogether, the findings from RPE (positive v. negative) suggest that there might be a selective and asymmetric impairment of reward related processing in the depressive subjects.
Interestingly, recent studies also have tracked how choice shapes belief formation and behavioral adjustment in learning tasks. In the field of economics, Hartzmark, Hirshman, and Imas (Reference Hartzmark, Hirshman and Imas2021) reported that the exogenously manipulated ownership could elicit the optimistic belief from positive information. In psychology, Palminteri, Lefebvre, Kilford, and Blakemore (Reference Palminteri, Lefebvre, Kilford and Blakemore2017) and Chambon et al. (Reference Chambon, Thero, Vidal, Vandendriessche, Haggard and Palminteri2020) found that the self-determined choice itself could modulate the confirmation of the chosen choice (factual learning) and disconfirm the unchosen option (counterfactual learning, see also Lefebvre, Summerfield, & Bogacz, Reference Lefebvre, Summerfield and Bogacz2021; Tarantola, Folke, Boldt, Perez, & De Martino, Reference Tarantola, Folke, Boldt, Perez and De Martino2021 for recent progress). Importantly, empirical studies suggest that adolescent individuals might fail to benefit from counterfactual information in comparison to adult subjects (Palminteri, Kilford, Coricelli, & Blakemore, Reference Palminteri, Kilford, Coricelli and Blakemore2016). Despite the importance of this phenomenon, few studies have yet examined the contours of behavioral regularities for subjects with depressive disorder from such a learning perspective nor attempted to unravel how such patients use information from counterfactual observation.
Last but not least, recent studies have attempted to tease apart the underlying mechanism of distorted belief updating in depression through the lens of intra-trial dynamics of choice implementation within the context of reinforcement learning. For instance, Pedersen, Frank, and Biele (Reference Pedersen, Frank and Biele2017) and Fontanesi, Gluth, Spektor, and Rieskamp (Reference Fontanesi, Gluth, Spektor and Rieskamp2019) have introduced the measurement of response time to value-based decision making in a reinforcement learning framework. With respect to adolescent depressive disorder, previous studies already suggested that there is a prolonged response time of the adolescent depressive subjects compared with those of the healthy controls (Chase et al., Reference Chase, Frank, Michael, Bullmore, Sahakian and Robbins2010). Nevertheless, few studies have integrated this potentially crucial component into computational modeling toward a more complete understanding of reinforcement learning for psychiatric diseases (see Wiehler, Chakroun, & Peters, Reference Wiehler, Chakroun and Peters2021 for a most recent attempt for gambling disorders).
To our knowledge, no existing studies have examined how choice, prediction error and intra-trial dynamics integrally shape the learning processing in adolescent depressive disorders. Toward capturing the learning characteristics of adolescent depression, we employ a two-bandit instrumental learning task (following Palminteri et al., Reference Palminteri, Lefebvre, Kilford and Blakemore2017), which involves both partial and complete feedback in adolescent patients and age matched normal adolescent subjects. By leveraging the advantages of using computational modeling, and including response time which likely reflects salient aspects of the decision process, this design allows us to evaluate the extent to which adolescent depressive subjects make use of choice-related outcome (factual v. counterfactual), RPE (positive v. negative), and their interaction, which we hypothesize shape dysfunctional decision making in such patients.
Methods
Subjects
We recruited 84 adolescent subjects (age from 12 to 18), including 42 adolescent subjects with major depression (MDD) (age: mean = 15.19, s.d. = 1.73; 4 males) and 42 healthy subjects (age: mean = 14.88, s.d. = 2.00; 13 males). Subjects diagnosed with major depressive disorders were hospitalized patients at the Seventh People's Hospital of Hangzhou, Zhejiang Province in a specialized ward for adolescent psychiatric patients. Subjects in the control group were students from local junior and senior high schools in Hangzhou. All adolescent depressive patients were diagnosed by board-qualified psychiatrists and patients were characterized with Hamilton Depression Rating Scale (HAMD, 24-item version, Zhang & He, Reference Zhang and He2015) scores equal or greater than 20 (mean = 31.69, s.d. = 6.55, see online Supplementary Table S1 for the detailed clinical status including medication, comorbidity etc., of the MDD patients). The written informed consent was obtained from all subjects prior to their participation. The study was officially approved by the Ethics committee of the Seventh People's Hospital in Hangzhou, Zhejiang province (No. 2020029).
To rule out potential confounds related to cognitive abilities, all subjects were asked to complete part of the Raven's Standard Progressive Matrices (set E, Raven & Court, Reference Raven and Court1998); the average score for the MDD group was 6.38 (s.d. = 2.06) and compared to 6.69 (s.d. = 1.75) for healthy controls (t(79) = 0.723, p = 0.472).
Behavioral task
Following the original design of Palminteri et al. (Reference Palminteri, Lefebvre, Kilford and Blakemore2017), the subjects were instructed to carry out a probabilistic instrumental task and aimed to earn monetary payoff through trial and error. In a series of consecutive 24 trials within each block, the subjects were asked to make a choice selection out of two fixed abstract symbols (Fig. 1 for a demo). Adopting a within subject strategy, we involved two factors: information (partial and complete) and probability (3 levels: symmetric, asymmetric and reversal) for the learning task. For the partial condition, only the choice-contingent outcome was revealed whereas for the complete condition, both the chosen and unchosen option-related outcome was presented at the end of the trial. The outcome was either winning one point (+1) for gain or losing one point (−1) for loss. For the ‘Symmetric’ condition, both options had a half-half chance of getting a reward or incurring a loss; with respect to the ‘Asymmetric’ condition, one symbol was linked with a ¾ chance of gain, whereas the other option was coupled with a ¼ chance of winning; In the final ‘Reversal’ condition, where one option was associated with an 83% chance of getting a reward and the other option was linked with a 17% chance of getting a reward for the 1st half of the total 24 trials, whereas in the 2nd half of the block, the reward contingencies for two options were reversed. Although we fixed that the winning probabilities in the two options added up to 1, in the experiment, gain or loss is independently determined for each option. Within each block, for the fixed pair of abstract symbols, the subjects need to discover the regularities gradually without any prior informed knowledge. There were two blocks for all the 6 levels (2×3) as elaborated above, resulting in 288 trials for each participant. A schematic illustration of a complete trial was exhibited in Fig. 1. The task was programmed with open-source package PsychoPy v3 (version 3.2.4, https://www.psychopy.org/) on the python platform. The abstract symbols were reproduced or newly created by a professional designer with high resolution, here we thank Dr. Stefano Palminteri for providing us with their initial symbol library from their previous publication for reference (Palminteri et al., Reference Palminteri, Lefebvre, Kilford and Blakemore2017). To minimize a potential order effect, the task was counterbalanced at the condition level across subjects; Within each subject, the order of the two designated options with predetermined probability (symmetric, asymmetric and reversal) was randomly determined at the very start of the block and then the position keep unchanged across the whole block (24 trials). As illustrated in Fig. 1, once the subjects used the numeric keypad to select their preferred option (key ‘4’ for the left option and key ‘6’ for the right option), the chosen option was highlighted immediately and subsequently the outcome of the chosen option was revealed for the partial condition (panel A). For the complete condition, both the outcome of the chosen and the unchosen alternative were shown to the subjects concurrently (panel B). At the end of the experimental task, the subjects got their earned payoff according to their realistic performance as well as their show-up fee and the performance score was converted into compensation with a fixed exchange rate (3:1) in the form of payoff matched gifts.

Figure 1. A trial starts with a ‘cross’ sign and two abstract symbols present on the screen which would keep fixed across one whole block (24 trials), the chosen option is highlighted with a colored rectangle once the subjects selected it with the key press and then the chosen outcome is revealed only for the partial condition (Panel A) and the outcome of the unchosen option is also revealed for complete option (Panel B). The winning outcome is 1 point together with a smiley face while the loss outcome is −1 point with a sad face. The earned money is accumulated for all earned points across 288 trials for the final performance score.
Behavioral data analysis
Payoff and choice accuracy
For the initial step, we calculated the aggregate payoff as well as the frequency of correct choice selection of both the depressive disorder patients and their age-matched normal adolescent subjects. As there was no theoretically correct option for the symmetric condition, we only counted the values for the asymmetric and reversal condition. Notably, the correct option was reversed for the 2nd half of the block in the reversal condition, therefore, we analyzed the correct choice rate separately for these two learning phases (Palminteri et al., Reference Palminteri, Lefebvre, Kilford and Blakemore2017). To illustrate the dynamic learning process of the implemented task, we graphically show the cumulative frequency of choice accuracy across 24 trials (Fig. 2).

Figure 2. It illustrates the trial-wise cumulative choice accuracy for asymmetric (top panel) and reversal condition (bottom panel) across 24 trials in each block. The left panel represents the partial condition and the right panel is for the complete condition. Note that there is no definition of correct choice for the symmetric condition, therefore it is omitted in the figure.
For the statistical inference for the payoff, we carry out a multi-level linear regression, DV payoff it is subject i's at trial t (assigns as 1 if the current feedback is reward and −1 otherwise). The key independent variables relating to the experiment are Group (equal to 1 for healthy control and 0 for MDD), Information (equal to 1 for partial and 0 for complete feedback) and probability (dummy variables: Symmetric, Asymmetric and Reversal, for the dummy example using Reversal as a reference 0). Given the within-subject serial correlation across trials, the standard error was clustered at the individual level. The analysis applies for the choice accuracy is in a similar spirit as implemented for the payoff. The differences lie in two aspects, 1: the dependent variable is Choice it (assigns as 1 if the choice is accurate and 0 otherwise, hence the logistic regression is applied); 2: here we only focused on the asymmetric and reversal conditions as there is no explicit definition of the correct answer for symmetric condition.
Response time (RT)
Although reinforcement learning task primarily focuses on the choice data, the response time also indexes relevant information concerning both choice and decision values (Palminteri et al., Reference Palminteri, Kilford, Coricelli and Blakemore2016) including recent advances over the RL drift diffusion model (e.g. Pedersen & Frank, Reference Pedersen and Frank2020). Therefore, as a computational psychiatric investigation, it is of apparent interest to examine the potential link between the duration of response time and the depressive disorders. Given the skewed distribution of the RT data by nature, we firstly removed the RTs outliers when they were above the 0.75 quartile by more than 1.5 times the interquartile range, or below the 0.25 quantile by more than 1.5 times the interquartile range. We then perform the Box-Cox transformation of the RT and run the multi-level linear regression in a similar manner as that carried out for payoff (section Payoff and choice accuracy).
Reinforcement learning model with standard random utility specification (Model I)
With the classical Rescorla-Wagner (RW) model, a standard Q-learning algorithm is applied to generate trial-by-trial estimates of Q-values and prediction errors (PEs). To test the potential asymmetric effect toward the valence of the prediction error (positive v. negative), we separated the positive RPE and negative RPE based on the realized magnitude of the trial-wise PE. Moreover, there were two different kinds of feedback, chosen outcome (R c) v. unchosen outcome (R u) for the complete condition, which results in both factual and counterfactual learning for subjects in such a context. Therefore, as illustrated in equations 1 and 3 (Palminteri et al., Reference Palminteri, Kilford, Coricelli and Blakemore2016), we derived the reinforcement learning model with two separate learning rates for the partial condition (α +, α −) and four learning rates for the complete condition (α c+, α c−, α u+, α u−). As illustrated in Fig. 2, there was no explicit definition of correct choice for the symmetric condition which might also lead to the uninformative feature of the learning rate derived from the model. Moreover, the RL model analysis we applied here might not be sufficient for the reversal task, as a Rescorla − Wagner model with associability-gated learning rate normally requires longer trials (e.g. 60 trials), which could be used to test the cognitive flexibility of the belief updating (see Mukherjee, Filipowicz, Vo, Satterthwaite, & Kable, Reference Mukherjee, Filipowicz, Vo, Satterthwaite and Kable2020; Raio, Hartley, Orederu, Li, & Phelps, Reference Raio, Hartley, Orederu, Li and Phelps2017 for reference). Therefore, we mainly focused on the asymmetric condition for the subsequent learning rate analysis (see online Supplementary Fig. S3-S4 for the results of the symmetric and reversal condition). For the two options in each block, the value of Q was assigned as 0 for the initial trial. For those trials t > 1, the Q-value of the chosen option is updated according to the following rule (factual learning module):

In the 1st equation, α c is divided into α c+ and α c− according to PE c(t). PE c(t) is the prediction error of the chosen option, which is calculated as:

R c(t) is the reward outcome of the chosen option at current trial t. R c(t) – Q c(t) represents chosen RPE at current trial t.
For the complete information condition, in addition to the chosen option, the value of the unchosen option is also updated according to the following rule (counterfactual learning module):

In equation 3, according to PE u(t), α u is divided into α u+ and α u−. PE u(t) is the prediction error of the unchosen option, which is calculated as:
R u(t) is the unchosen reward outcome on the current trial t. R u(t) – Q u(t) represents unchosen RPE on the current trial t.
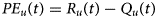
The probability of an individual's actual choice at trial t is estimated on the basis of the softmax rule:

For equation 5, Pc(t) is the probability of choosing the option at current trial t. Q c(t) and Q u(t) is the updated value at the current trial. β is referred to the inverse temperature parameter that adjusts the stochasticity of decision-making. Maximum Likelihood Estimation (MLE) is implemented to estimate the parameters with software R with the self-written scripts and the R package DEoptim (Mullen, Ardia, Gil, Windover, & Cline, Reference Mullen, Ardia, Gil, Windover and Cline2011) is used to achieve a global optimization for parameter estimation. Negative log-likelihoods (LL) are used to compute classical model selection criteria (Equation 6, see online Supplementary Table S7 for details).
Reinforcement learning model with response time (Model II)
Although with the dynamic update feature of the Qt of each option as the trial evolves in each block, the Q-learning model illustrated above still falls within in the framework of the random utility model (RUM, McFadden, Reference McFadden and Zarembka1973). As highlighted recently by Webb (Reference Webb2019), with the omission of the endogenous variable RT which is closely correlated with the utility difference between options, might lead to misspecification of the choice probabilities and bias estimates of model parameters. Therefore, we drew on the method proposed by his work (Webb, Reference Webb2019) and involved the response time into the RL model for evidence accumulation (EA) consideration. Critically, we specified the choice probabilities
with $\beta = e^{s + g\ast ( {RT_t-RT_{mean}} ) } \hskip-1pt .{\rm \;} s + g\ast ( {RT_t-RT_{mean}} )$ is a linear form where RT t is the response time at trial t and RT mean is the average response time for certain condition. Therefore, RT t − RT mean can be regarded as the centered response time, and s and g are two parameters in the model (see online Supplementary Table S8). According to Webb (Reference Webb2019), the response time is negatively correlated to the absolute difference between the two options. Generally speaking, the choice noise is less when the absolute difference between the two options is larger. Therefore, at the aggregate level, parameter g should be negative. This reasoning is consistent with our estimation results (see online Supplementary Table S8).
We also conduct a model selection procedure to compare the standard model to the model with response time (see online Supplementary Model selection). The result of model selection shows that introducing response time to the standard model cannot achieve a significant better explanatory power. However, as Webb (Reference Webb2019) argued, the main improvement of including response time is to reduce the bias of estimates. To further verify this argument within the framework of reinforcement learning which inherently contains dynamic updating, we carry out a simulation in which we simulate the data including both the choices and response times (Miletić et al., Reference Miletić, Boag, Trutti, Stevenson, Forstmann and Heathcote2021). Then, we recover the parameters using the two models discussed in this paper (see online Supplementary Simulation recovery). We find that, after including response time data, the recovered parameters achieve a smaller mean squared error (MSE, see online Supplementary Simulation recovery for detailed simulation procedure and results). Therefore, in the results part of this paper, we choose to report the estimation results from the two models as robustness checks.
For the comparison of the learning rates across conditions, we implement 2 (Group: HC v. MDD) × 2 (Valence: PE+, PE−) × 3 (Probability: Symmetric, Asymmetric, Reversal) repeated ANOVA for the partial feedback and 2 (Group: HC v. MDD) × 2 (Valence: PE+, PE−) × 2 (Selection: chosen v. unchosen) × 3 (Probability: Symmetric, Asymmetric, Reversal) for the complete feedback. Collapsing the 3 probabilities (Symmetric, Asymmetric, Reversal), we further did the 2 (Group: HC v. MDD) × 2 (Valence: PE+, PE−) × 2 (Selection: chosen v. unchosen) ANOVA for partial feedback and 2 (Group: HC v. MDD) × 2 (Valence: PE+, PE−) repeated measure ANOVA for complete feedback. Additionally, post hoc pairwise comparisons were implemented when the interaction terms were significant. As noted in the section ‘Reinforcement learning model with standard random utility specification’, we reported the general ANOVA results and the asymmetric condition in the Results section below and the other details in online supplementary material (see online Supplementary Computational model).
To formulate the connection between the severity of clinical symptoms and the learning behavior from the two-arm bandit task, we derived the learning index from the learning rate (see online Supplementary Learning index for detailed definition) and run the regression analysis with the HAMD score as the dependent variable and the learning index (partial, complete) as the independent variable using robust standard error.
All the data manipulation and statistical analysis including the computational modeling of the reinforcement model were implemented using the open-source software R (https://www.r-project.org, version 4.1.2). R package lfe (Gaure, Reference Gaure2013) was used for the linear regression including that adjusted for the clustered standard errors (payoff, Box-Cox transformed response time); package rms (Harrell, Reference Harrell2021) was adopted to run the multi-level logistic regression (choice accuracy); and bruceR (Bao, Reference Bao2022) was used to perform the repeated-measure ANOVA analysis (two versions of RL model-derived learning rates). Two-sided t test was used for the statistical reports. Multiple comparisons were corrected using Bonferroni method when appropriate.
Result
Choice accuracy
For the monetary payoff, the multi-level regression analysis revealed that the healthy adolescent controls earned more token points (mean = 44.10, s.e. = 3.022) from the RL task than that of the MDD patients (mean = 35.29, s.e. = 2.90, online Supplementary Fig. S1, β Group = 0.031, p = 0.034) (see online Supplementary Table S2). Consistent with our general intuition, there was also a prominent effect of information (β Information = −0.049, p < 0.001). Both for MDD and HC group, the subjects had better performance with complete feedback compared to partial feedback (HC: β Information = −0.055, p < 0.001; MDD: β Information = −0.043, p = 0.003).
For the choice accuracy, the mixed-level logistic regression analysis reveals a similar finding as those observed for the payoff (see online Supplementary Table S3). In general, the MDD patient had worse performance over the option selection as opposed to the control group (β Group = 0.182, p = 0.042). There was also a prominent effect for information (β Information = −0.306, p < 0.001) such that the subjects showed better performance in the complete condition notwithstanding group (HC: β Information = −0.383, p < 0.001; MDD: β Information = −0.235, p = 0.005), and generally in line with the results of monetary payoff. For the pooled data with asymmetric condition and the first half of the reversal condition, we found a prominent group effect (β Group = 0.360, p = 0.016), and the interaction between group and information was also marginally significant (β Group×Information = −0.259, p = 0.087).
Additionally, collapsed by condition (asymmetric and reversal) over choice accuracy, irrespective of whether it is the asymmetric or the 1st half of the reversal condition (see online Supplementary Table S3), we found that there was a prominent effect of group (asymmetric: β Group = 0.354, p = 0.036; reversal 1st half: β Group = 0.381, p = 0.030). Generally, the depressive subjects tended to perform worse than that of the healthy controls. As illustrated in Fig. 2, when checking the results for the partial and complete condition separately, we found that, regardless of the asymmetric or the reversal condition (see online Supplementary Table S4), for the partial condition, we failed to find a significant effect (asymmetric: β Group = 0.130, p = 0.391; reversed 1st half: β Group = 0.038, p = 0.830). However, the group effect was significant for the complete condition (asymmetric: β Group = 0.359, p = 0.037; reversal 1st half: β Group = 0.388, p = 0.030). Moreover, for the 2nd half of the reversal condition, no matter for the aggregate or those separated by information, we did not observe any significant difference (aggregate: β Group = 0.061, p = 0.632; partial: β Group = 0.174, p = 0.216; complete: β Group = 0.064, p = 0.632).
Response time
Considering the response time at the stage of choice execution, as presented in Fig. 3, we compared the difference of the Box-Cox transformed RT data between MDD and HC. The multi-level linear regression of the transformed response time reveals that, albeit the poor performance (lower payoff and choice accuracy) of the MDD subjects (see online Supplementary Table S5), they nevertheless exhibit a prolonged response time (β Group = −0.165, p < 0.001). However, there is no effect for information (β Information = −0.014, p = 0.214). As indicated in online Supplementary Table S5, the response time of the asymmetric and reversal conditions was longer than that of the symmetric condition (Asymmetric: β Probability = 0.016, p = 0.153; Reversal: β Probability = 0.025, p = 0.058), and the response time of the reversal was longer than that of the asymmetric condition (β Probability = 0.009, p = 0.439). Therefore, we further examined the response time separately for symmetric, asymmetric and reversal condition.
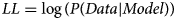
Figure 3. This figure exhibits the response time for MDD and HC across three conditions, i.e. symmetric, asymmetric and reversal condition with partial and complete information stratification. Error bars describe standard errors (* p < 0.05, ** p < 0.01, *** p < 0.001).
Firstly, for the symmetric condition, the regression analysis showed a significant effect of group (β Group = −0.175, p < 0.001), but no effect for information (β Information = −0.025, p = 0.234). Further analysis suggests that irrespective of whether the partial or complete (see online Supplementary Table S6), the response times of MDD were longer than that HC (partial: β Group = −0.208, p < 0.001; complete: β Group = −0.143, p = 0.008). Secondly, for the asymmetric condition, the regression analysis also showed a significant effect of group (β Group = −0.156, p = 0.001), but there was no effect for information condition (β Information = −0.029, p = 0.121). The separate analysis indicated a similar effect as those observed for the symmetric condition, viz. the response time of HC was shorter than MDD for partial condition (β Group = −0.162, p = 0.002) and complete condition (β Group = −0.150, p = 0.004). Finally, for the reversal condition, the regression analysis showed a significant effect of group (β Group = −0.165, p < 0.001), but no effect for information (β Information = 0.012, p = 0.487). The partial and complete differentiation also indicated RT difference between HC and MDD (partial: β Group = −0.172, p < 0.001; complete: β Group = −0.158, p = 0.003). Therefore, for the RT comparison, we find that for all three conditions across symmetric, asymmetric and reversal condition, there was a stable and prominent difference across MDD and healthy subjects, indicating the important role of the reaction time in the process of decision making for the learning task.
Computational modelling
For the computational modeling estimation, we applied the adapted RW reinforcement learning framework as illustrated in equation 1 and 3 (Niv, Edlund, Dayan, & O'Doherty, Reference Niv, Edlund, Dayan and O'Doherty2012; Palminteri et al., Reference Palminteri, Lefebvre, Kilford and Blakemore2017). Such a framework allows us to test both the potential asymmetric/symmetric coding of the positive and negative RPE and their pattern in the chosen and unchosen condition.
On the basis of standard reinforcement learning model (Model I), given the prominent RT discrepancy between the two groups (Fig. 3) and potential better unbiased specification, according to the suggestion of Webb (Reference Webb2019), we further introduced the response time into the RL framework, and examine the learning rate for normal adolescent subjects and MDD patients accordingly (Model II). As revealed in Fig. 4, the general pattern was similar to what was observed in the RL model (see online Supplementary Fig. S2), but with a potentially larger contrast between the normal subjects and MDD patients. A possible conundrum in our results is that, since we separately estimate the models with the data from each condition, the observations in the asymmetric condition might be imbalanced among the four parameters. If the observations of PEs are very few for some parameters, the estimation result could be highly biased. To rule out this possibility, based on the results of Model I, we have counted the realized observations of PEs corresponding to each parameter for each individual and reported the average distribution in each condition across all individuals (see online Supplementary Fig. S5). The results show that, in the asymmetric condition, the distribution of the observations is not especially biased and there is no significant imbalance in the data for the estimation exercise.

Figure 4. The learning rates of RL model with bounded accumulation from the asymmetric condition. The green color is for the healthy controls and the red color is for the MDD patients. Error bars describe standard errors (* p < 0.05, ** p < 0.01, *** p < 0.001).
The 3 × 2 × 2 repeated ANOVA in the partial condition, it showed a significant effect of probability (F(2, 164) = 5.667, p = 0.004, η 2p = 0.065). Although there was no effect for group (F(1, 82) = 0.288, p = 0.593, η 2p = 0.004), there was a prominent interaction effect between probability and valence (F(2, 164) = 3.844, p = 0.023, η 2p = 0.045). For the 3 × 2 × 2 × 2 repeated ANOVA in the complete condition, a significant effect of probability was observed (F(2, 164) = 5.667, p = 0.004, η 2p = 0.065), and a significant effect of selection (F(1, 82) = 4.500, p = 0.037, η 2p = 0.052). There was no effect for group (F(1, 82) = 1.249, p = 0.267, η 2p = 0.015). There was also a prominent effect between probability and selection (F(2, 164) = 4.081, p = 0.019, η 2p = 0.047). Hence, there were different learning rates under different probability conditions, especially in the complete condition. Moreover, the selection condition also affected the learning rate. Here we mainly focused on the asymmetric condition, and the remainder of the results is detailed in the online Supplementary material (see online Supplementary Computational model, Fig. S3-S4).
As illustrated in Fig. 4, for the healthy adolescent subjects, there was a positive bias in the partial condition, viz. there was a higher learning rate for PE+ than that of PE− (α + = 0.535, s.e. = 0.065, α − = 0.286, s.e. = 0.053, t(82) = 2.974, p = 0.004). For the complete condition, there was also a positive bias for the chosen option (α c+ = 0.506, s.e. = 0.063, α c− = 0.281, s.e. = 0.057, t(82) = 2.732, p = 0.008) and there was no discrepancy for the unchosen option (α u+ = 0.312, s.e. = 0.049, α u− = 0.296, s.e. = 0.063, t(82) = 0.205, p = 0.838). However, with respect to the adolescent MDD group, however, we failed to find the learning rate difference between positive negative RPE irrespective of whether it is the chosen option in the partial condition (α + = 0.481, s.e. = 0.065, α − = 0.370, s.e. = 0.053, t(82) = 1.326, p = 0.189) or the chosen option in the complete condition (α c+ = 0.431, s.e. = 0.063, α c− = 0.312, s.e. = 0.057, t(82) = 1.450, p = 0.151). Strikingly, for the RT, there remained a prominent pattern of the non-negligible negative bias for the unchosen option and a higher learning rate for PE- than that of PE+ (α u+ = 0.228, s.e. = 0.049, α u− = 0.434, s.e. = 0.063, t(82) = −2.713, p = 0.008).
Finally, to examine the feasibility of verifying whether the parameters derived from the computational model indeed reflect the severity of the clinical symptom of the depressive disease, we ran an individual heterogeneity analysis for the adolescent MDD patients and considered whether the constructed learning index from partial and complete condition could link with the scores in the HAMD questionnaire. We found that there was a significantly negative connection between learning index and HAMD score (β LI = −2.402, p = 0.025) (see Fig. 5 and online Supplementary Table S9). For the partial condition, the result was β LI = −2.926, p = 0.078, and β LI = −2.197, p = 0.074 for the complete condition (see online Supplementary Table S10).

Figure 5. It illustrates the links between the HAMD depression score and the learning index for the partial and complete condition.
Discussion
The current study applies an instrumental learning task with the manipulation of the degree of the revealed information to evaluate the reinforcement learning behavior for adolescent depressive patients. Both the earned payoff and the choice accuracy reveal that the depressive adolescent patients generally perform poorly, compared with normal age-matched controls. As previously reported, the patients also displayed longer reaction times to complete the choice selection (Bakic et al., Reference Bakic, Pourtois, Jepma, Duprat, De Raedt and Baeken2017; Chase et al., Reference Chase, Frank, Michael, Bullmore, Sahakian and Robbins2010; Pizzagalli, Iosifescu, Hallett, Ratner, & Fava, Reference Pizzagalli, Iosifescu, Hallett, Ratner and Fava2008). Computational modeling reveals that the usually observed positive bias in typical adolescents is absent in the depressive subjects. Notably, as compared with the normal subjects, the depressive subjects also exhibit an increased bias toward choosing the negative outcome for the counterfactual option. Finally, the learning index derived from the bias of the learning rate is correlated with the severity of the depressive symptoms of adolescent patients.
The behavioral findings that depressed adolescents choose negative outcomes, as well as the results from the computational modeling where we observe an increased negative prediction error for the unchosen option, viz. compared with the positive RPE there is a higher learning rate for the negative RPE in the depressed adolescent group, allows us to critically evaluate recent advances regarding how depressed adolescent subjects relate to positive and negative RPE, i.e. whether in a symmetric or asymmetric manner (Fig. 4).
Consistent with recent advances obtained in empirical RL studies (Lefebvre et al., Reference Lefebvre, Lebreton, Meyniel, Bourgeois-Gironde and Palminteri2017; Niv et al., Reference Niv, Edlund, Dayan and O'Doherty2012; Sugawara & Katahira, Reference Sugawara and Katahira2021), for the chosen option no matter in the partial or complete condition, normal adolescent subjects tend to exhibit a higher learning rate toward the positive RPE compared to negative RPE (Fig. 4). On the one side, these results underscore that healthy individuals are characterized by an optimistic bias and who by and large, tend to update the belief that matches self-serving interests or opinions (Kappes, Harvey, Lohrenz, Montague, & Sharot, Reference Kappes, Harvey, Lohrenz, Montague and Sharot2019; Sharot & Garrett, Reference Sharot and Garrett2016). Furthermore, such a tendency is also reliably observed in the dynamic instrumental learning context (Lefebvre et al., Reference Lefebvre, Lebreton, Meyniel, Bourgeois-Gironde and Palminteri2017). For the counterfactual outcome (unchosen option), the normal adolescent subjects do not show this tendency. That being said, some recent studies suggest perhaps there is an inclination to such a confirmation bias even in non-clinical subjects. Adult subjects tend to have an opposite learning rate pattern for the counterfactual outcome (Palminteri et al., Reference Palminteri, Lefebvre, Kilford and Blakemore2017; Tarantola et al., Reference Tarantola, Folke, Boldt, Perez and De Martino2021). Nevertheless, at least one recent study suggests that, compared with adults, the typical adolescent subjects seem to at least partially fail to consider the alternative information from the unchosen option (Palminteri et al., Reference Palminteri, Kilford, Coricelli and Blakemore2016).
Focusing on the adolescent depressive subjects, we find that, similar to adult depressive patients who tend to reduce the response toward positive rewards and are more sensitive to negative stimuli, adolescent depressed patients, similar to their adult counterparts, are characterized by an omitted positive bias (Auerbach, Pagliaccio, & Pizzagalli, Reference Auerbach, Pagliaccio and Pizzagalli2019; Bishop & Gagne, Reference Bishop and Gagne2018; Kube et al., Reference Kube, Schwarting, Rozenkrantz, Glombiewski and Rief2020; Nielson et al., Reference Nielson, Keren, O'Callaghan, Jackson, Douka, Vidal-Ribas and Stringaris2021). Therefore, in contrast to the normal subjects who disregard the negative RPE, the depressive subjects apparently encode the prediction error with positive and negative valence in a more symmetric manner, consistent with the notion that the depressive patients in fact tend to objectively interpret the choice-contingent outcome from a more ‘realistic’ manner (depressive realism, Frank, Reference Frank2016; Seidel et al., Reference Seidel, Satterthwaite, Eickhoff, Schneider, Gur, Wolf and Derntl2012).
Interestingly, for the depressive adolescent patients, with respect to the learning rate, they have a pronounced negative bias toward the outcome of the counterfactual option (Fig. 4). Seemingly counterintuitive at first glance, this is nevertheless, in accordance with the findings that the depressive subjects show more regret toward the post decision outcome (Kraines, Krug, & Wells, Reference Kraines, Krug and Wells2017; Roese et al., Reference Roese, Epstude, Fessel, Morrison, Smallman, Summerville and Segerstrom2009). As we noted above, whether depressive patients show a negative bias or not is an unresolved question that is recently experiencing a heated debate (Brolsma et al., Reference Brolsma, Vassena, Vrijsen, Sescousse, Collard, van Eijndhoven and Cools2021). Importantly, the findings from the present study offer a potentially new perspective toward understanding more precisely the exact role of negative bias in depression. Notably, when the choice and RPE valence jointly come into play, it is not only possible to check whether there is a reduced positive bias or increased negative bias, but also feasible to test the asymmetry of the chosen v. unchosen PE (e.g. Palminteri et al., Reference Palminteri, Kilford, Coricelli and Blakemore2016). We infer that, given the general self-blame inclination for the justification of choice selection observed in the depressive subjects, such atypical subjects have a predisposition to exhibit more counterfactual thinking. Hence, they show a higher response toward counterfactual outcome and tend to be more responsive toward the unchosen option, which leads to an increased pessimistic bias toward the unchosen outcome (Broomhall, Phillips, Hine, & Loi, Reference Broomhall, Phillips, Hine and Loi2017).
With respect to the adolescent depressive subjects, the degree of bias at the individual level from the factual and counterfactual outcomes, are correlated with the severity of the depressive symptoms as measured by the HAMD depression score (Fig. 5). This finding suggests that the anomalous behavioral bias toward the RPE is a possibly salient mechanistic channel that underpins the decision deficits which is prominent in adolescent depressive orders. Therefore, by leveraging the instrumental learning task with computational modeling, and including the model with response time which likely reflects the process of dynamics of intra-trial process, the current study suggests there is considerable value to search for computational and decision markers in depression. Finding such unique biomarkers, would undoubtedly not only enhance our theoretical understanding of depression but also contribute to improvements in clinical evaluation such as the therapeutic effect of drugs and cognitive behavioral therapy. Further studies could profitably integrate the instrumental learning task with neuroimaging techniques (e.g. fMRI) to directly validate the findings we observed here in order to examine the extent to which both choice and RPE valence shapes the behavioral regularities as well as observed deficits in depressed adolescent subjects.
Supplementary material
The supplementary material for this article can be found at https://doi.org/10.1017/S0033291723001307.
Financial support
This work was supported by grant 71971199 and 71942004 from the National Natural Science Foundation of China.
Conflict of interest
None.


