1. Introduction
The U.S. livestock industry is increasingly faced with pressure to adjust practices in response to societal concerns, whether through governmental regulation, ballot initiatives, or retailers responding to consumers. A specific area of growing concern surrounds how production practices affect the welfare of farm animals. For example, in May 2015, Walmart announced their new position on farm animal welfare and antibiotic use (Walmart, 2015). In their release, Kathleen McLaughlin, president of the Walmart Foundation and senior vice president of Walmart, stated, “We have listened to our customers, and are asking our suppliers to engage in improved reporting standards and transparency measures regarding the treatment of farm animals” (Walmart, 2015). Examples of other major U.S. companies that announced changes in animal welfare polices such as antibiotic use, housing, and use of pain control include McDonald's (Storm, Reference Storm2015), Tyson Foods (Kissel, Reference Kissel2015), and Aramark (Aramark, 2015).
Although U.S. consumer concerns and attention to animal welfare have increased recently, corresponding research and outreach efforts have not kept pace. Most of the limited existing work has focused on consumers’ willingness to pay for animal welfare–friendly attributes or willingness to vote for banning production practices. Gestation crates/stalls in the swine industry (e.g., McKendree et al., Reference McKendree, Widmar, Ortega and Foster2013; Nilsson, Foster and Lusk, Reference Nilsson, Foster and Lusk2006; Norwood and Lusk Reference Norwood and Lusk2011; Pozo, Tonsor, and Schroder, Reference Pozo, Tonsor and Schroeder2012; Tonsor, Olynk, and Wolf, Reference Tonsor, Olynk and Wolf2009; Tonsor, Wolf, and Olynk, Reference Tonsor, Wolf and Olynk2009) and alternative uses to laying hen cages in the poultry industry (e.g., Chang, Lusk, and Norwood Reference Chang, Lusk and Norwood2010; Heng, Peterson, and Li, Reference Heng, Peterson and Li2013; Lusk, Reference Lusk2010; Norwood and Lusk, Reference Norwood and Lusk2011) have gained the most attention in the agricultural economics literature because these practices have been the focus of ballot initiatives and legislation. Fewer studies have focused on animal welfare in U.S. beef (Lister et al., Reference Lister, Tonsor, Brix, Schroeder and Yang2017) and dairy products (Olynk and Ortega, Reference Olynk and Ortega2013; Wolf, Tonsor, and Olynk, Reference Wolf, Tonsor and Olynk2011). Tonsor and Olynk (Reference Tonsor and Olynk2011) suggest that all livestock industries have experienced negative meat demand impacts from increasing media attention to animal welfare. Additionally, several recent corporate animal welfare announcements involved policies relating to all species of livestock (e.g., Aramark, 2015).
Fewer studies have focused on livestock producers’ willingness to change and preferences for production practices. Schulz and Tonsor (Reference Schulz and Tonsor2010) found significant heterogeneity in cow-calf producers’ willingness to adopt voluntary traceability systems and preferences for system attributes using choice experiments. Similarly, Olynk, Wolf, and Tonsor (Reference Olynk, Wolf and Tonsor2012) found significant heterogeneity in dairy producers’ views on recombinant bovine somatotropin–free (rBST-free) milk production and discovered that eliminating conventional production practices from the producers’ choice set negatively affected welfare measures.
Wolf and Tonsor (Reference Wolf and Tonsor2017) conducted a unique study that surveyed U.S. public members on their willingness to pay for, and dairy producers on their willingness to change, production practices to improve dairy cattle welfare. However, no such study has compared public member and producer views on animal welfare in the beef industry.
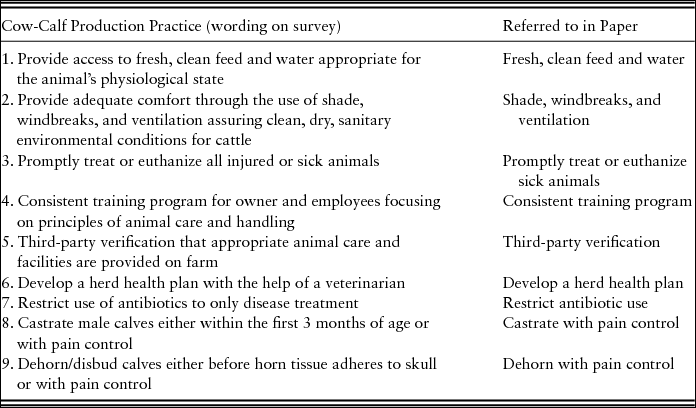
It is important to understand economic implications of animal welfare concerns for the beef industry. This understanding starts with a benchmarking of existing awareness and perceptions of both producers and the public. This study aims to provide exactly this benchmarking information by identifying the U.S. public and cow-calf producer perceptions of animal welfare in the beef industry. A unique contribution of this study is the comparison of the U.S. public's perceptions to those of cow-calf producers. This comparison sheds new light on possible market opportunities (e.g., aligning producer and consumer interest) and identifies potential threats (e.g., noting existing perception gaps that may result in calls for production changes). Stated differently, this comparison helps document potential actions to better align desires of the U.S. public with practices of beef producers. The first objective of this analysis is to use maximum difference scaling to determine which of the nine practices investigated (Table 1) the U.S. public and cow-calf producers view as the most effective and most practical to improve the welfare of U.S. beef cattle. The second objective is to determine similarities and differences in public and producer views.
Table 1. Cow-Calf Production Practices Investigated to Improve Welfare of U.S. Beef Cattle
2. Research Methodology
Maximum difference (also known as best-worst or most-least) scaling is a methodology that presents individual survey respondents (either public member or producer in this analysis) with multiple answer options (production practices in our application) and asks them to select one option as “most” and one option as “least” of the multiple choices presented (at least three). Through multiple choice scenarios, a cardinal ranking of the presented practices can be developed. Maximum difference scaling questions are preferred to simple ranking or Likert-scale questions because individuals are required to make trade-offs instead of simply rating the importance of each practice independently (Lusk and Briggeman, Reference Lusk and Briggeman2009; Wolf and Tonsor, Reference Wolf and Tonsor2013). This combats the issue of respondents marking all practices as most practical, for example. Additionally, maximum difference scaling nullifies the scale subjectivity of ranking questions. For example, what is considered a “4” to one individual might be a “5” on another individual's scale (Lusk and Briggeman, Reference Lusk and Briggeman2009; Lusk and Parker, Reference Lusk and Parker2009; Wolf and Tonsor, Reference Wolf and Tonsor2013). Outside of the agricultural economics field, maximum difference scaling has been used in health care preferences (e.g., Flynn et al., Reference Flynn, Louviere, Peters and Coast2007), epidemiology (e.g., Cross, Rigby, and Edwards-Jones, Reference Cross, Rigby and Edwards-Jones2012), and preferences for companion animals (Bir, Widmar, and Croney, Reference Bir, Widmar and Croney2017). In agricultural economics, maximum difference has been used to evaluate consumer preferences for food values (Lister et al., Reference Lister, Tonsor, Brix, Schroeder and Yang2017; Lusk and Briggeman, Reference Lusk and Briggeman2009) and dairy producer preferences for policies (Wolf and Tonsor, Reference Wolf and Tonsor2013). However, to the authors’ knowledge, no study has employed maximum difference scaling to compare public and producer perceptions of food production issues including beef cattle welfare.
The data collection portion of this project was threefold: online public survey, mail producer survey, and online producer survey. An online nationally representative U.S. public survey of primary household shoppers was completed in December 2013.Footnote 1 The survey was written by the team of researchers, but administered by Decipher Inc. Of the 2,000 completed responses collected, 1,992 were usable.Footnote 2 Collaborating with BEEF magazine using surveys very similar to those provided to the public sample, U.S. cow-calf producers were surveyed using mail and online surveys in December 2013 through January 2014. Similar to the data collection methods employed in Schulz and Tonsor (Reference Schulz and Tonsor2010), BEEF magazine drew a random sample of their subscribers who best aligned with those selling calves, rather than fed cattle, to receive mail surveys. Of the 1,500 surveys mailed, 433 were returned (28.9% response rate). There were 15,202 e-mails sent to BEEF magazine subscribers with online survey links; 290 surveys were recorded (1.9% response rate). However, of the 723 producer responses, only 374 properly completed the maximum difference questions and are used in this analysis. Of the 374 usable responses, 91 were mail surveys and 283 were Internet surveys.Footnote 3 In addition to maximum difference questions, questions were asked to elicit public and producer demographic information, perceptions of animal welfare in the beef industry, and for the public sample, their ground beef and beef steak purchasing behaviors.
Given multiple dimensions of possible changes in animal care provision, it is important to consider the feasibility of implementing changes (practicality) as well as to examine corresponding impacts on realized animal welfare (effectiveness). The issue of feasibility is inherently linked to practicality of on-farm adjustments and hence production costs and supply-side economics. Similarly, prospects for demand maintenance or changes are tied to perceptions regarding effectiveness. By examining both effectiveness and practicality, we gain a more complete picture of underlying economic issues tied to beef cattle welfare.
Accordingly, in this analysis, a split sample approach was used. Half of respondents were randomly assigned to assess practicality, while the other half assessed effectiveness; respondents were not asked to assess both practicality and effectiveness. That is, the “best” options were presented as “most effective” or “most practical,” whereas the “worst” options were “least effective” or “least practical.”
The SAS %MktMDiff macro was used to determine the optional balanced incomplete block design (SAS Institute Inc., 2018). The optimal design includes 12 choice scenarios, each showing different combinations of six of the nine production practices. Each attribute appears in the design eight times and appears five times with each of the other attributes. To mitigate respondent fatigue, the 12 choice scenarios were randomly allocated to one of two blocks such that a given respondent received six scenarios. This same design was used for both the practical and effective scales.Footnote 4 Each respondent saw one block of six scenarios with most/least effective scales or one block of six scenarios with most/least practical scales. An example maximum difference choice scenario from this study using the effective scale is shown in Figure 1. The design was identical for both the public and producer maximum difference analyses.

Figure 1. Example of a Maximum Difference Scaling Question in the Effectiveness Survey Version
The nine production practices investigated (Table 1) were selected following a multistage process in consultation with veterinarians and animal behaviorists. A longer list of production practices was identified from existing literature and current animal welfare protocols embedded in verification programs. Additional practices were considered following focus group discussions with livestock producers in related extension meetings. Ultimately, this original practice list was refined to shorten the list to a set manageable for feasible investigation.
2.1. Multinomial Logit and Latent Class Models
According to Louviere (Reference Louviere1993), a key assumption of maximum difference scaling is that the participant evaluates all possible pairs of items within the choices shown and then will choose the pair that maximizes the difference (in either effectiveness or practicality in our application). If there are J items (or production practices in this analysis, six in each scenario), then J(J − 1) most-least combinations will be possible (for this analysis, 6 × 5 = 30). The most-least pair chosen represents the choice that maximizes the difference in effectiveness (practicality). Following Lusk and Briggeman (Reference Lusk and Briggeman2009) and Wolf and Tonsor (Reference Wolf and Tonsor2013), let λj represent the location of j on the scale of effectiveness (practicality), and let the true or latent unobservable level of effectiveness (practicality) for individual i be given by Iij = λj + εij, where εij is the random error term. The probability that the pair j, k is chosen, with production practice j being the most and production practice k being the least out of a choice set with J production practices, is the probability that the difference between j and k is larger than all the J(J − 1) − 1 other possible differences in the choice set. If the error terms are independent and identically distributed type I extreme value, then the probability described takes the multinomial logit (MNL) form:
 $$\begin{equation}
{\rm{Pro}}{{\rm{b}}_i}\left( {j\,\,{\rm{is}}\,{\rm{chosen}}\,{\rm{as}}\,{\rm{most}}\,{\rm{and}}\,k\,{\rm{as}}\,{\rm{least}}} \right)=\frac{{{e^{{\lambda _j}{\rm{\ }} - {\rm{\ }}{\lambda _k}}}}}{{\sum\nolimits_{l{\rm{\ }} = {\rm{\ }}1}^J {\sum\nolimits_{m = {\rm{\ }}1}^J {{e^{{\lambda _l}{\rm{\ }} - {\rm{\ }}{\lambda _m}}} - J} } }}
\end{equation}$$
Based on the probability statement in equation (1), the λj parameters can be estimated by maximizing the log-likelihood function. Here, the dependent variable is 1 if the most-least pair is chosen by the individual, and 0 for the J(J − 1) − 1 other pairs of production practices. The λj estimated represents the effectiveness (practicality) of production practice j relative to some other production practice that is normalized to 0 to prevent the dummy variable trap.
The MNL assumes that individuals have homogeneous views of the production practices investigated. Given the likely diverse views on animal welfare broadly and individual production practices more narrowly, it seems likely that perceived effectiveness and practicality could vary across respondents. Accordingly, to allow for respondent heterogeneity, latent class models (LCMs) are also estimated (Boxall and Adamowicz, Reference Boxall and Adamowicz2002). In LCM, preferences are assumed to be homogenous within each class, but heterogeneous across classes. Akaike information criterion (AIC; Boxall and Adamowicz, Reference Boxall and Adamowicz2002) and adjusted Bayesian information criterion (BIC; Dziak et al., Reference Dziak, Coffman, Lanza and Li2012) tests were used to determine if the LCM was preferred to the MNL model, and thus if homogeneity restrictions were rejected.Footnote 5
Coefficient estimates from MNL and LCMs are not intuitive for direct interpretation. Fortunately, a “share of effectiveness (practicality)” for each practice can be calculated that provides an interpretable estimate. Following Lusk and Briggeman (Reference Lusk and Briggeman2009), these shares are the forecasted probability that each production practice is chosen as the most effective (practical):
 $$\begin{equation}
{\rm{Share}}\,{\rm{of}}\,{\rm{effectiveness}}\,\left( {{\rm{practicality}}} \right)\,{\rm{for}}\,{\rm{production}}\,{\rm{practice}}\,j=\frac{{{e^{\widehat {{\lambda _j}}}}}}{{\sum\nolimits_{k = 1}^J {{e^{\widehat {{\lambda _k}}}}} }}
\end{equation}$$
The shares must sum to one across all nine production practices investigated. The value calculated in equation (2) represents the effectiveness or practicality of production practice j on a ratio scale. For example, if one production practice has an effectiveness share that is twice that of the other, then the former is viewed as twice as effective as the latter. This share represents the probability that a production practice is more effective (or practical) than another production practice. If all practices were viewed as equally effective, their share would be 0.11 (i.e., 1/9).
Using responses to the sets of maximum difference scaling questions, both ordinal and cardinal rankings of the practices can be developed and compared across the producer and public groups, as well as segments within each group. The resulting survey responses can be used to compare similarities between perceived effectiveness (e.g., improvement of welfare; potential demand-side benefits) and practicality (e.g., feasibility of implementation; supply-side impacts) that are critical to understanding economic implications of possible changes in production practices.
Krinsky-Robb confidence intervals (Krinsky and Robb, 1986) were calculated to compare shares both within and across samples. Overlapping confidence intervals can be used to determine if shares are statistically different within a model and across the LCMs.Footnote 6 The full combinatorial method (Poe, Giraud, and Loomis, Reference Poe, Giraud and Loomis2005) was used to test if shares are different across the four MNL models.
Inattention bias in surveys is a concern in choice results (Carlsson, Reference Carlsson, Lusk, Roosen and Shogren2011; Malone and Lusk, Reference Malone and Lusk2018; Murphy et al., Reference Murphy, Allen, Stevens and Weatherhead2005). Malone and Lusk (Reference Malone and Lusk2018) and Gao, House, and Bi (Reference Gao, House and Bi2016) found that respondents who missed validation questions, and thus were likely not fully reading questions, had statistically different choice outcomes. Malone and Lusk (Reference Malone and Lusk2018) introduce the random response share (RRS) methodology to help mitigate the impact of inattention bias. The RRS approach is simple to apply; in one of the latent classes, all parameters are restricted to zero indicating these choices were purely random. The significance of the restricted class membership determines if the RRS method is beneficial, while the class size indicates the extent of random response behavior in each data set.
In LCMs, a class membership probability can be calculated for each respondent. The participants are then sorted into one class based on their largest class membership probability (greater than 0.30).Footnote 7 Then the demographic characteristics across classes are compared using F-tests and pairwise t-tests. If the F-test is significant, revealing differences in means across classes (RRS class was not used because the data are unreliable), then pairwise t-tests are conducted (class 1 to class 2, class 1 to class 3, etc.). This procedure is similar to that used by Ortega et al. (Reference Ortega, Waldman, Richardson, Clay and Snapp2016).
3. Results
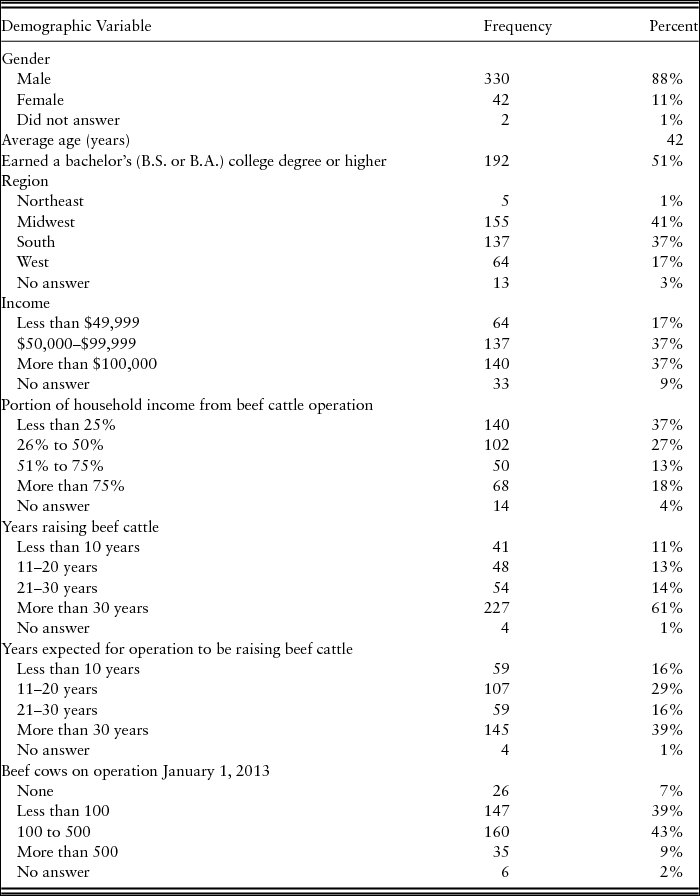
Table 2 and Table 3 present summary statistics of the U.S. public and cow-calf producer samples. Extensive details of the survey responses and descriptive statistics are available in McKendree et al. (Reference McKendree, Tonsor, Wolf, Thomson and Swanson2015a, Reference McKendree, Tonsor, Wolf, Thomson and Swanson2015b).
Table 2. Summary Statistics of the U.S. Public Sample (n = 1,992)
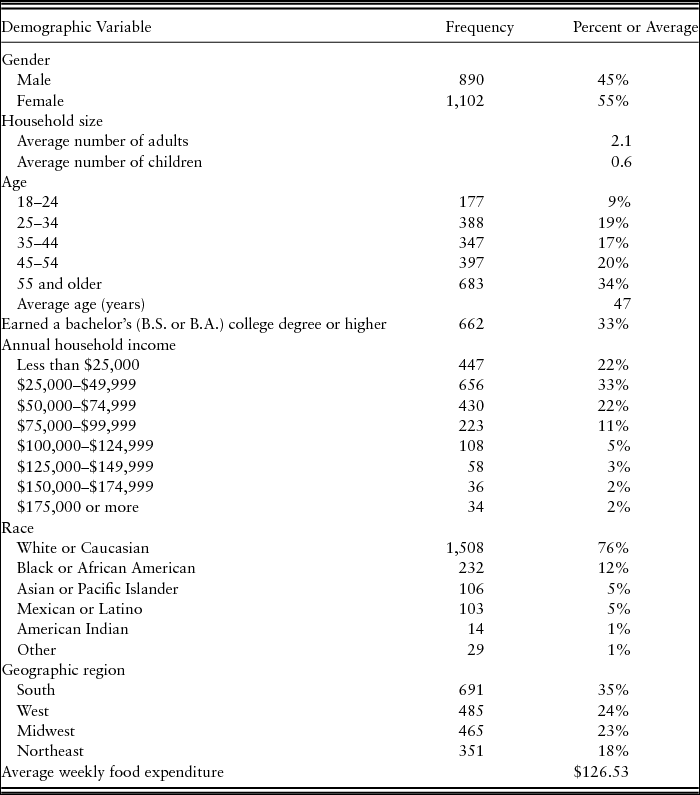
Table 3. Summary Statistic of the U.S. Cow-Calf Producer Sample (n = 374)
The U.S. public respondents are representative of the U.S. population. Our sample consisted of 55% females (Table 2), slightly higher than the U.S. population of 51% female (U.S. Census Bureau, 2017b). This increased female percentage is likely attributable to the survey being of primary household shoppers. The average respondent age was 47. One-third of the public sample had received at least a bachelor's degree, similar to 30.3% of the U.S. population (U.S. Census Bureau, 2017b). More than half of the sample had household incomes of less than $50,000, similar to the median U.S. household income of $55,322 (U.S. Census Bureau, 2017b). About three-fourths of the sample considered themselves white, while the other quarter considered themselves black, Asian, Mexican or Latino, American Indian, or other races. The U.S. public participants were geographically diverse with 35%, 24%, 23%, and 18% of respondents from the South, West, Midwest, and Northeast geographic regions, respectively. In 2014, 39%, 24%, 21%, and 18% of the U.S. population was located in the South, West, Midwest, and Northeast geographic regions (U.S. Census Bureau, 2017a).
The majority, 88%, of cow-calf producers surveyed were male, and the average age was 42 (Table 3). Approximately half of producers surveyed had earned at least a bachelor's degree, which is a larger percentage than the U.S. public sample. Half of the producer sample reported household incomes of less than $100,000 with most having 50% or less of their household income coming from their beef cattle operation. The majority of the sample was from the Midwest and South regions. According to the 2013 cattle inventory report, 45% of U.S. beef cows were in the South, 34% in the Midwest, 20% in the West, and 1% in the Northeast regions (Livestock Marketing Information Center, 2018). This difference is likely because our sample is of operators, which might not accurately reflect total beef cows because of different operation sizes. Thirty-nine percent of our sample had operations with less than 100 cows, and 43% had between 100 and 500 cows. In 2011, 90% of U.S. beef cow herds were less than 100 head, with 79% being from operations with less than 50 head (Livestock Marketing Information Center, 2018). However, generally there are concerns about what the U.S. Department of Agriculture counts as a beef cow herd (i.e., 4-H or FFA projects), thus likely overcounting smaller operations. The majority of producers surveyed had raised beef cattle for more than 20 years, and most expected their operation to continue raising cattle for more than 20 years in the future.
The results of the estimated MNL and LCMs for both the U.S. public and cow-calf producers’ maximum difference responses are presented subsequently. The shares of relative effectiveness or practicality have a more useful interpretation than coefficient estimates. Accordingly, the shares of effectiveness and practicality are shown in Table 4 to Table 9, while underlying coefficient estimates for the models are reported in the Appendix. In all of the models, the effectiveness and practicality of each production practice are estimated relative to fresh, clean feed and water.
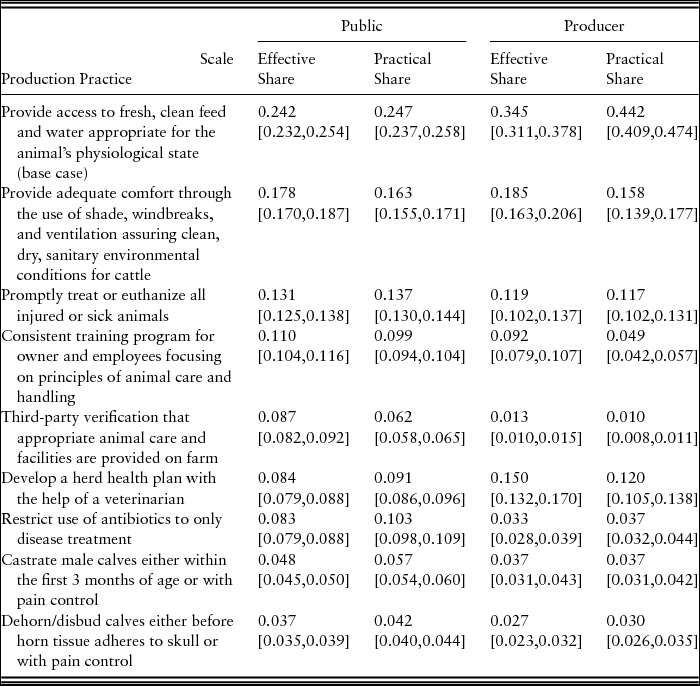
Table 4. Multinomial Logit Model Shares for U.S. Public and Producers’ Views of the Effectiveness and Practicality of Production Practices to Improve Cattle Welfare
Note: The 95% confidence intervals in square brackets were derived following Krinsky and Robb (1986).
3.1. Multinomial Logit Models
The MNL shares for effectiveness and practicality of the nine production practices for the public and producer samples are shown in Table 4. Furthermore, P values from the complete combinatorial tests (Poe, Giraud, and Loomis, Reference Poe, Giraud and Loomis2005) across models are given in Table 5.
Table 5. Poe Test (Poe, Giraud, and Loomis, 2005) P Values for Multinomial Logit Models
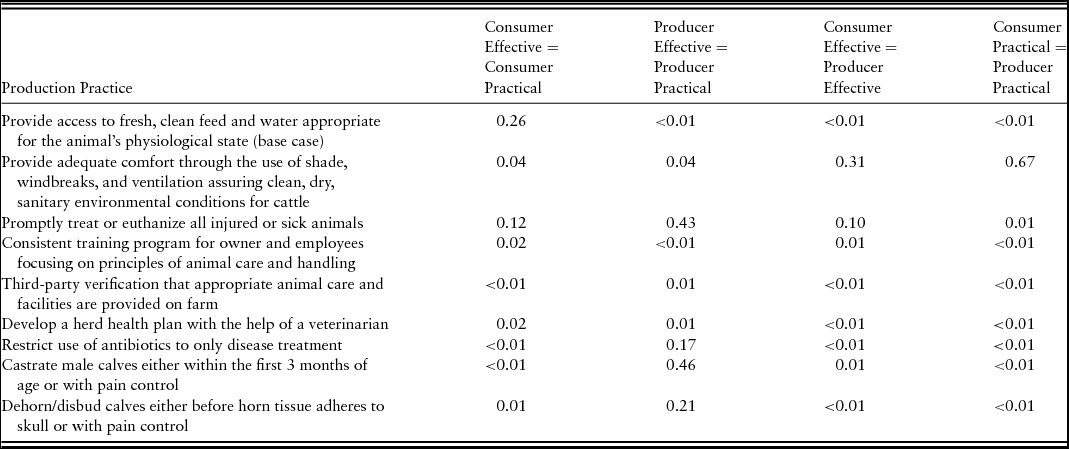
The effectiveness and practicality shares for the public sample were similar, but statistical differences were found. “Fresh, clean feed and water” and “shade, windbreaks, and ventilation” were viewed as the most and second most effective and practical practices to improve beef cattle welfare (Table 4, columns 2 and 3). “Castrate with pain control” and “dehorn with pain control” were viewed as the least effective and practical practices. “Fresh, clean feed and water” and “promptly treat or euthanize sick animals” were viewed as equally effective and practical (Table 5, column 2). Three practices—(1) shade, windbreaks, and ventilation, (2) consistent training program, and (3) third-party verification—were viewed as more effective than practical. Four practices—(1) develop a herd health plan, (2) restrict antibiotic use, (3) castrate with pain control, and (4) dehorn with pain control—were viewed as more practical than effective.
The cow-calf producers also viewed “fresh, clean feed and water” and “shade, wind breaks, and ventilation” as the most and second most effective and practical practices (Table 4, columns 4 and 5). However, the shares for “fresh, clean feed and water” were statistically larger than those of the public (Table 5, columns 4 and 5). Furthermore, the producers’ shares for “fresh, clean feed and water” were double, or nearly double, that of “shade, windbreaks, and ventilation.” Similar to the public sample, the producers also did not view “castrate with pain control” or “dehorn with pain control” as effective or practical practices with shares less than 0.05. However, producers viewed “third-party verification” as the least effective and practical practice to improve beef cattle welfare. The public sample viewed this as a somewhat effective (0.087) and practical (0.062) practice with statistically larger shares than the producer sample (Table 5, columns 4 and 5). The producer effectiveness and practicality shares were not statistically different for “promptly treat or euthanize sick animals,” “restrict antibiotic use,” “castrate with pain control,” and “dehorn with pain control.” Producers viewed “shade, windbreaks, and ventilation,” “consistent training program,” “third-party verification,” and “develop a herd health plan” as more effective than practical. Only “fresh, clean feed and water” was viewed as more practical than effective by producers.
The public and producer views were not statistically different regarding the effectiveness and practicality of “shade, windbreaks, and ventilation” or the effectiveness of “promptly treat or euthanize sick animals” (Table 5, columns 4 and 5). Producers viewed “fresh, clean feed and water” and “develop a herd health plan” as more effective and practical than the public. Conversely, for the remaining five production practices for effective and six production practices for practical, the public member shares were statistically larger than producer shares.
Given the strong homogeneity assumption in the MNL model, it is important to investigate the potential for heterogeneity in preferences using LCMs.
3.2. U.S. Public Latent Class Models
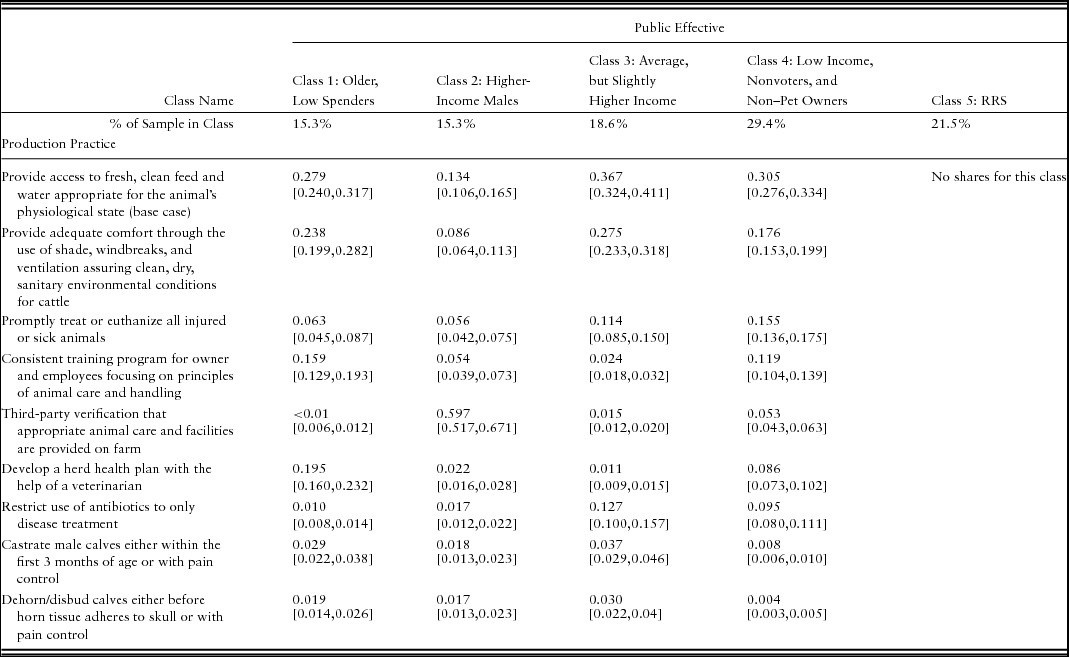
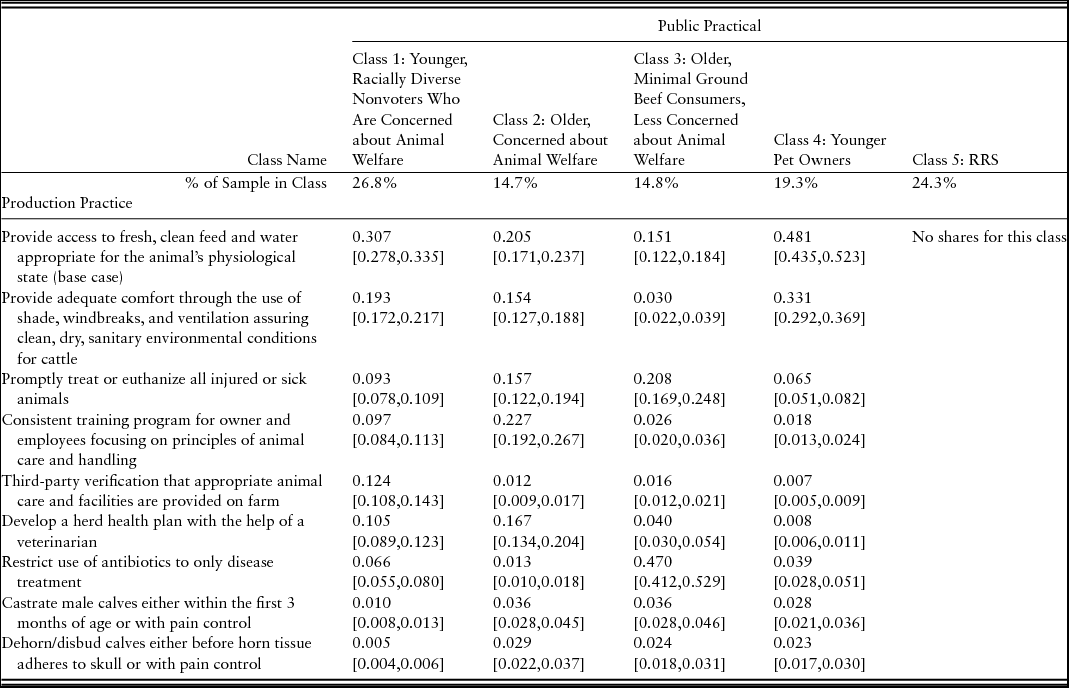
Table 6 and Table 7 present the U.S. public's relative views on the effectiveness and practicality of the nine examined practices to improve the welfare of beef cattle in the United States using the LCM results, respectively.
Table 6. Latent Class Modeling Shares for U.S. Public's View of the Effectiveness of Selected Production Practices to Improve Cattle Welfare
Notes: The 95% confidence intervals in square brackets were derived following Krinsky and Robb (1986). RRS, random response share.
Table 7. Latent Class Modeling Shares for U.S. Public's View of the Practicality of Selected Production Practices to Improve Cattle Welfare
Notes: The 95% confidence intervals in square brackets were derived following Krinsky and Robb (1986). RRS, random response share.
The five-class LCM was preferred to models with one (MNL) to four classes, based on AIC/BIC measures, confirming preference heterogeneity. Heterogeneity is not surprising given the diverse set of information held by the public and corresponding impacts on beliefs. Observing partial, but not full, support in voting activity aligns with this heterogeneity (Tonsor and Wolf, Reference Tonsor and Wolf2011). LCM coefficient estimates and F-test and t-tests for the demographic comparisons across classes are available in the Appendix. Class 1 (15.3% membership probability) was composed of those who were older with lower weekly food expenditures (Table 6) and will be called “older, low spenders” (Table 6). Class 2 (15.3% membership probability), composed of more males with relatively higher incomes, will be called “higher-income males.” Class 3 (18.6% membership probability) had characteristics aligned with sample averages but had higher incomes. We will call them the “average, but slightly higher income” group. Class 4, the largest class (29.4% membership probability), was composed of those with relatively lower incomes who were less likely to own pets and voted less frequently. Class 4 will be called “low income, nonvoters and non–pet owners.” Class 5 (21.5% class membership probability) represents the RRS class, and therefore, no shares were calculated.
Older, low spenders (class 1), average, but slightly higher income (class 3), and low income, nonvoters and non–pet owners (class 4) viewed “fresh, clean feed and water” as the most effective practice (Table 6). However, the average, but slightly higher income class (class 3) had the largest effectiveness share for “fresh, clean feed and water,” 0.367. These three classes also viewed “shade, windbreaks, and ventilation” as one of the most effective practices to improve the welfare of beef cattle, with the average, but slightly higher income class (class 3) having the highest share, 0.275. Conversely, higher-income males (class 2), viewed “third-party verification” as the most effective practice to improve beef cattle welfare, with the largest effectiveness share across all classes and practices, 0.597. The other three classes did not view “third-party verification” as an effective practice, even having one of the lowest effectiveness shares for older, low spenders (class 1). The next highest effectiveness shares for higher-income males (class 2) were “fresh, clean feed and water” (0.134) and “shade, windbreaks, and ventilation” (0.086). Therefore, higher-income males viewed “third-party verification” as more than four times as effective at improving beef cattle welfare as “providing access to fresh, clean feed and water.” However, all four classes viewed “providing access to fresh, clean feed and water” as one of the top two most effective practices. Overall, all four classes had low effectiveness shares, less than 0.05, for “castrate with pain control” and “dehorn with pain control.”
Prominent differences in perceptions are evident in the intermediate effectiveness rankings (Table 6). The average, but slightly higher income (class 3) and low income, nonvoters and non–pet owners (class 4) classes perceived “restrict antibiotic use” as a somewhat effective practice with shares of 0.127 and 0.095, whereas it was one of the least effective practices by older, low spenders (class 1) and higher-income males (class 2). A similar story is true for “promptly treat or euthanize all sick animals” with the average, but slightly higher income class (class 3) and the low income, nonvoters and non–pet owners class (class 4) viewing this practice as more effective than older, low spenders (class 1) and higher-income males (class 2). “Consistent training program” was viewed as more effective by older, low spenders (class 1) and low income, nonvoters and non–pet owners (class 4), both generally lower-income groups, than higher-income males (class 2) and the average, but slightly higher income class (class 3), generally higher-income groups.
The U.S. public's perceptions of the practicality of the nine production practices to improve the welfare of U.S. beef cattle were also heterogeneous (Table 7). Class membership probabilities were 26.8%, 14.7%, 14.8%, 19.3%, and 24.3% for the classes, respectively. Class 1 was composed of younger and more racially diverse participants who were concerned about animal welfare and voted less often. Class 1 will be called “younger, racially diverse nonvoters who are concerned about animal welfare.” Class 2, composed of older participants who were concerned about animal welfare, will be called “older, concerned about animal welfare.” Class 3 was also composed of older participants; however, they were less concerned about animal welfare and consumed ground beef less frequently. Class 3 will be called “older, minimal ground beef consumers, less concerned about animal welfare.” Class 4, composed of younger participants who were more likely to own a pet, will be called “younger pet owners.” Class 5 is the RRS class.
“Provide access to fresh, clean feed and water” was ranked the most practical practice by the two younger classes of participants—younger, racially diverse nonvoters who are concerned about animal welfare (class 1; share of 0.307) and younger pet owners (class 4; share of 0.481) (Table 7). Additionally, it was viewed as a practical practice by older public members who were concerned about animal welfare (class 2). However, the relative share for younger pet owners (class 4) was more than double that of older public members who were concerned about animal welfare (class 2). Both classes of younger public members (classes 1 and 4) ranked “shade, windbreaks, and ventilation” as the second most practical practice with shares of 0.193 and 0.331. Conversely, older participants who were more concerned about animal welfare (class 2) ranked “consistent training program” as the most effective practice to improve beef cattle animal welfare. Older participants who were less concerned about animal welfare and consumed less ground beef (class 3) perceived “restricting antibiotic use” as the most effective practice to improve the welfare of U.S. beef cattle (0.470), followed by “promptly treat or euthanize sick animals” (0.208).
“Third-party verification” was viewed as one of the least practical practices by older public members who were concerned about animal welfare (class 2; share of 0.012), older, minimal ground beef consumers, less concerned about animal welfare (class 3; share of 0.016), and younger pet owners (class 4; share of 0.007) (Table 7). However, “third-party verification” was the third most practical practice for younger, racially diverse nonvoters who are concerned about animal welfare (class 1; share of 0.124). Additionally, there were diverse views regarding the practicality of “develop a herd health plan.” Both classes that were more concerned about animal welfare, classes 1 and 2, had higher practicality shares for “develop a herd health plan” than the other two classes. Similar to effectiveness, all classes did not view “castrate with pain control” or “dehorn with pain control” as practical practices to improve the welfare of U.S. beef cattle with shares less than 0.05 for all classes.
3.3. U.S. Cow-Calf Producers Latent Class Models
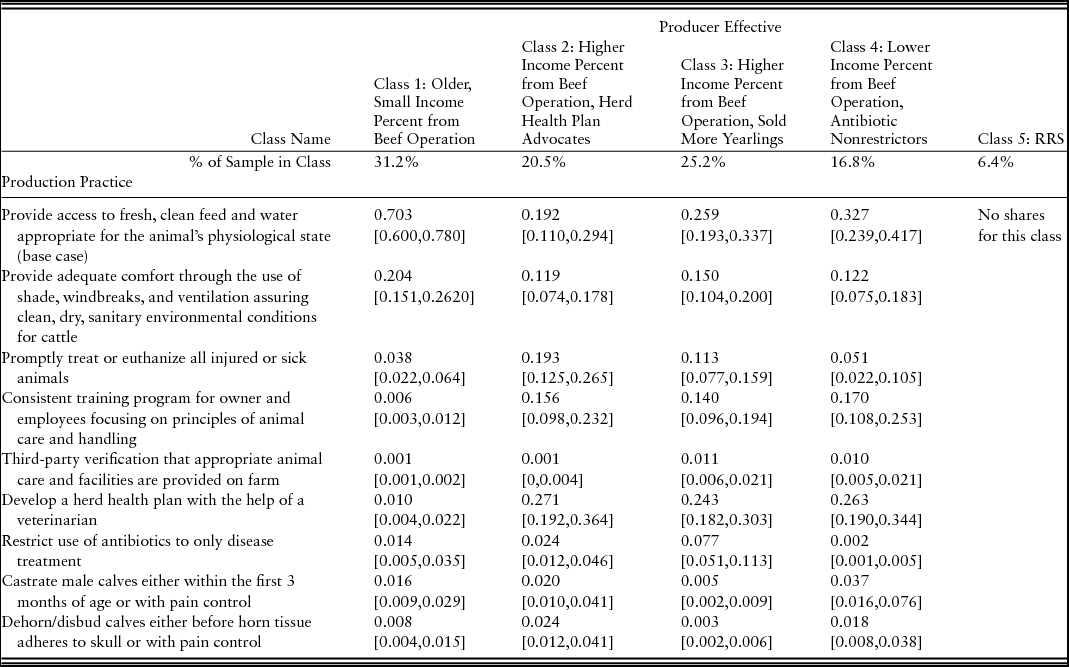
Table 8 and
Table 8. Latent Class Modeling Shares for U.S. Cow-Calf Producers’ Views of the Effectiveness of Selected Production Practices to Improve Cattle Welfare
Notes: The 95% confidence intervals in square brackets were derived following Krinsky and Robb (1986). RRS, random response share.
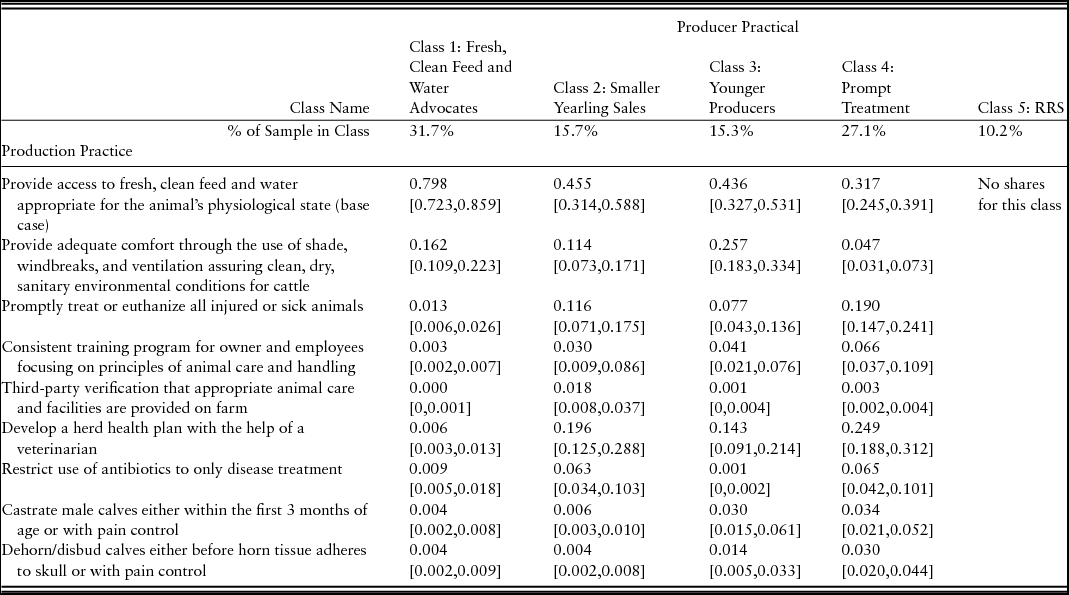
Table 9 present the U.S. cow-calf producers’ relative views on the effectiveness and practicality of the nine examined practices to improve the welfare of beef cattle in the United States using the LCM results, respectively. Using AIC and adjusted BIC, five class models were chosen for both effectiveness and practicality, confirming preference heterogeneity. Recall that class 5 was the RRS class where parameter estimates were restricted to zero and thus no shares were calculated. The RRS classes were smaller in the producer samples than the public samples.
Table 9. Latent Class Modeling Shares for U.S. Cow-Calf Producers’ View of the Practicality of Selected Production Practices to Improve Cattle Welfare
Notes: The 95% confidence intervals in square brackets were derived following Krinsky and Robb (1986). RRS, random response share.
In the producer effective LCM, the five classes had membership probabilities of 31.2%, 20.5%, 25.2%, 16.8%, and 6.4%, respectively (Table 8). Class 1 was composed of older producers who had a relatively smaller percent of their household income coming from the beef operation and will be called “older, small income percent from beef operation.” Class 2 was composed of producers with a relatively higher percent of their income coming from their beef operation. Class 2 will be called “higher income percent from beef operation, herd health plan advocates.” Class 3 also had a higher percent of their income from their beef operation but sold relatively more yearlings. Class 3 will be called “higher income percent from beef operation, sold more yearlings.” Class 4 was composed of those with a relatively smaller percent of their household income from their beef operation and will be called “lower income percent from beef operation, antibiotic nonrestrictors.”
Older producers with a small income percent from their beef operation (class 1) viewed “fresh, clean feed and water” as the most effective practice to improve the welfare of beef cattle with an effectiveness share of 0.703 (Table 8). This effectiveness share was two or three times that of the other classes. Furthermore, producers with a higher income percent from their beef operation who sold more yearlings (class 3) and producers with a lower income percent from their beef operation who were antibiotic nonrestrictors (class 4) viewed “fresh, clean feed and water” as the most effective practice to improve the welfare of beef cattle. “Fresh, clean feed and water” was still ranked highly by producers with a higher income percent from their beef operation who were herd health plan advocates (class 2; share of 0.192).
Class 2, producers with a higher income percent from their beef operation who were herd health plan advocates, viewed “develop a herd health plan” as the most effective practice (0.271) (Table 8). Producers with a higher income percent from their beef operation who sold more yearlings (class 3) and those with a lower income percent from their beef operation who were antibiotic nonrestrictors (class 4) agreed, with practicality shares of 0.243 and 0.263. However, older producers with a small income percent from their beef operation (class 1) did not view “develop a herd health plan” as effective with a share of 0.010. All classes had practicality shares greater or equal to 0.122 for “shade, windbreaks, and ventilation.” Producers with a higher income percent from their beef operation who were herd health plan advocates (class 2) had the highest effectiveness shares of all the classes for “promptly treat or euthanize sick animals.” “Consistent training program” was viewed as a somewhat effective practice for producers with a higher income percent from their beef operation who were herd health plan advocates (class 2), producers with a higher income percent from their beef operation who sold more yearlings (class 3), and producers with a lower income percent from their beef operation who were antibiotic nonrestrictors (class 4). However, the effectiveness share for older producers with a small income percent from beef operation (class 1) was negligible. All four groups did not view “third-party verification,” “restrict the use of antibiotics,” “castrate with pain control,” or “dehorn with pain control” as relatively effective practices. Looking at the size of the shares within classes, older producers with a small income percent from their beef operation (class 1) had large effectiveness shares for two practices, whereas the other classes had more distributed shares.
Shares and rankings of the producers’ views on the practicality of the nine practices to improve beef cattle welfare are found in Table 9. Membership probabilities for the five classes were 31.7%, 15.7%, 15.3%, 27.1%, and 10.2%, respectively. Very few descriptive statistics were different across the classes, and thus some classes were classified by their views on the practicality of practices. Class 1 was called “fresh, clean feed and water advocates” because of the largest practicality share of 0.798 for “fresh, clean feed and water.” Class 2 sold a smaller number of yearlings relative to the other classes. Class 3 was composed of relatively younger producers. Class 4 was classified as the prompt treatment group because they had the highest practicality share for “promptly treat and euthanize sick animals.”
In terms of practicality, producers overwhelmingly viewed “fresh, clean feed and water” as the most practical practice to improve the welfare of beef cattle in the United States across all classes (Table 9). However, fresh, clean feed and water advocates (class 1) had a practicality share (0.798) double or nearly double that of all other classes. Fresh, clean feed and water advocates (class 1) and younger producers (class 3) viewed “shade, windbreaks, and ventilation” as the second most practical practice. Conversely, producers with smaller yearling sales (class 2) and prompt treatment advocates (class 4) viewed “develop a herd health plan” and “promptly treat or euthanize” as more practical practices. All four classes viewed “consistent training program,” “third-party verification,” “restrict the use of antibiotics,” “castrate with pain control,” and “dehorn with pain control” as less practical practices to improve beef cattle welfare with practicality shares of 0.066 to less than 0.010.
4. Discussion and Implications
Comparing the LCMs across the public and producers is a useful exercise for at least two purposes. First, in order to maintain the social license to produce—and avoid regulation—producers need to align their priorities with the public. Second, this exercise can be useful for maintaining market access and matching potential groups of consumers (demand) with producers (supply).
4.1. Effectiveness
Overall, the majority of the public and producers agreed that “fresh, clean feed and water” was the most effective practice to improve the welfare of U.S. beef cattle (Table 6 and Table 8). Additionally, the majority of classes across the producers and the public viewed “shade, windbreaks, and ventilation” as an effective practice. Furthermore, both the public and producers did not view “castrate with pain control” or “dehorn with pain control” as effective practices to improve beef cattle welfare. Because the public and producers held similar views on “fresh, clean feed and water,” “shade, windbreaks, and ventilation,” “dehorning with pain control,” and “castrating with pain control,” these practices could make for viable areas of agreement in future discussions on verifying animal welfare on-farm. Furthermore, there are potential opportunities to match particular supplier groups with groups of consumers. As an example, producers with a higher income percent from their beef operation who were herd health plan advocates (producer class 2), producers with a higher income percent from their beef operation who sold more yearlings (producer class 3), and producers with a lower income percent from their beef operation who were antibiotic nonrestrictors (producer class 4), as well as older public members who were low spenders (public class 1) and low income, nonvoters and non–pet owners (public class 4), viewed “consistent training program” as an effective practice to improve beef cattle welfare.
Although there were areas of agreement across the classes of the public and producers, there were also areas of disagreement. For example, male public members with higher incomes (public class 1), believed that “third-party verification” was the most effective practice to improve the welfare of beef cattle. However, no producer class viewed this practice as highly effective. Therefore, discussions around “third-party verification” between this public group and producers are more likely to be difficult. Comparing other groups across the public and producers shows potential extreme views in the market that could lead to heightened friction or controversy. Additionally, although three producer classes thought “developing a herd health plan” was an effective practice with shares greater than 0.240, only older public members who were lower spenders (public class 1) thought this was an effective practice (share of 0.195). Similar exercises can be completed for all combinations of classes across the two models where similarities and differences in perceptions were found.
4.2. Practicality
Repeating this exercise for practicality, more heterogeneity was found across the public and producers. However, there were still some areas of agreement (Table 7 and Table 9). All producer classes ranked “fresh, clean feed and water” as the most practical practice, but only younger, racially diverse nonvoters who are concerned about animal welfare (public class 1) and younger pet owners (public class 4) ranked it as most practical. All public and producer classes had low practicality shares for “castrating with pain control” and “dehorning with pain control.” When looking at aligning groups of producers with public members, potentially producers in the fresh, clean feed and water advocates class (producer class 1) match well with younger pet owner public members (public class 4). Both groups had large practicality shares for “fresh, clean feed and water” and “shade, windbreaks, and ventilation.” Additionally, younger producers (producer class 3) and public members who were younger, racially diverse nonvoters who are concerned about animal welfare (public class 1) had high shares for “fresh, clean feed and water,” “shade, windbreaks, and ventilation,” and “develop a herd health plan.” Interestingly, both groups were generally younger. However, public members who were older and more concerned about animal welfare (public class 2) and those who were older, minimal ground beef consumers, and less concerned about animal welfare (public class 3) do not match well to producer groups. This is especially true for the latter class whose top practice was “restrict antibiotic use” (0.470), while the largest producer shares were 0.065 and 0.063 by producers with smaller yearling sales (producer class 2) and prompt treatment advocates (producer class 4). Additionally, public members who were older and more concerned about animal welfare (public class 2) viewed “consistent training program” as the most practical practice. However, the highest share among producer classes was 0.066 from the prompt treatment advocate group (producer class 4). Potentially, antibiotic restriction and training programs could be points of debate in animal welfare discussions moving forward. One could envision productive conversations regarding animal welfare to be difficult between producers and the nearly 30% of the older public members represented by public classes 2 and 3. It is also important to note that these two “outlier” groups vote relatively more than class 1.
Overall, heterogeneity is present both within and across the public and producer groups. LCMs allow further exploration and identification of groups of the public whose views on effectiveness and practicality are similar to groups of producers, but also identify groups with disagreements. Combined this may suggest “fresh, clean feed and water” and “shade, windbreaks, and ventilation” would be given high priority, with reasonable chance of producer acceptance, in designing animal welfare programs and protocols such as those mentioned in the introduction. Further, the majority of cow-calf producers surveyed already implement these practices (McKendree et al., Reference McKendree, Tonsor, Wolf, Thomson and Swanson2015b). Thus, this could be an important point to communicate to the public.
5. Conclusions
This analysis used maximum difference scaling to determine views on the effectiveness and practicality of production practices to improve welfare of U.S. beef cattle. Both U.S. public members and cow-calf producers were surveyed, and effectiveness and practicality scales were developed from MNL models and LCMs. Heterogeneity was found both within the public and cow-calf producers and across the two groups, and classes with similar and opposing views were identified. “Fresh, clean feed and water” was viewed by most classes as both effective and practical, whereas “castrate with pain control” and “dehorn with pain control” were seen as the least effective and practical practices.
Based on the LCM results, though some similarities were found, gaps in perceptions between the public and producers were notable. These results can be used to inform future areas of agreement and disagreement in discussions on certification underlying an animal welfare assured label, corporate or public policy, or by industry in responding to increasing calls from supply chain customers. Identifying heterogeneity across and within U.S. cow-calf producers and the public assists in aligning those in the marketplace who are concerned about beef animal welfare and are willing to pay a premium for products with desired attributes with producers who are willing to change their production practices (or market those already implemented) to those sought after by said groups of consumers. These maximum difference results could also be compared with data collected from producers regarding current production practices in place to assess gaps from on-the-ground practices. This will highlight the extent to which “real-world change” may be required to alleviate growing public concern.
The practices identified as both most effective and most practical, “fresh, clean feed and water” and “shade, windbreaks, and ventilation,” could be candidates for practices in animal welfare certification programs, policy promotions, or industry recommendations. These practices are likely already widely implemented in the beef industry and thus may require fewer on-the-ground changes (McKendree et al., Reference McKendree, Tonsor, Wolf, Thomson and Swanson2015b). Instead, more documentation and verification of these attributes could be warranted and communicated as holding value to the public.
One surprising finding was the heterogeneity and lower shares of effectiveness and practicality of restricting antibiotic use given the large attention to antibiotic use recently, except for two smaller classes in the public samples (both less than 20%). Many corporations, such as Walmart (Walmart, 2015) and McDonald's (Storm, Reference Storm2015), are requiring or voluntarily asking their suppliers to limit antibiotic use. However, in this study, antibiotic use was not one of the top practices mentioned for effectiveness or practicality, except by a minority group. Potentially, antibiotic use is not viewed as an animal welfare issue by most. Potentially, the public is concerned about antibiotic use for other reasons such as human health and medical concerns.
Perhaps media announcements such as those by Aramark, Walmart, and McDonald's are the result of pressure from the minority of the U.S. public consistent with alternative perceptions held by the smaller classes identified in our LCMs. If indeed this is true, future work would be well served to identify the aggregate economic welfare impacts of required changes in production practices (or documentation thereof) being initiated by calls for change by the minority of the public.
Appendix: Coefficient Estimates
Table A1. U.S. Public Effective Model Coefficient Estimates (n = 995)

Table A2. U.S. Public Practical Model Coefficient Estimates (n = 997)
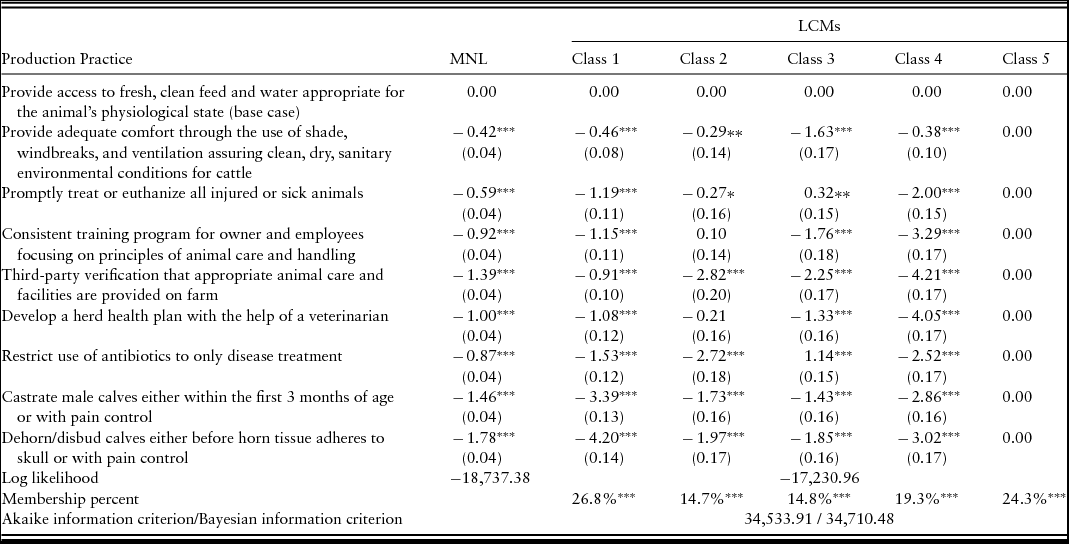
Table A3. U.S. Cow-Calf Producer Effective Model Coefficient Estimates (n = 168)
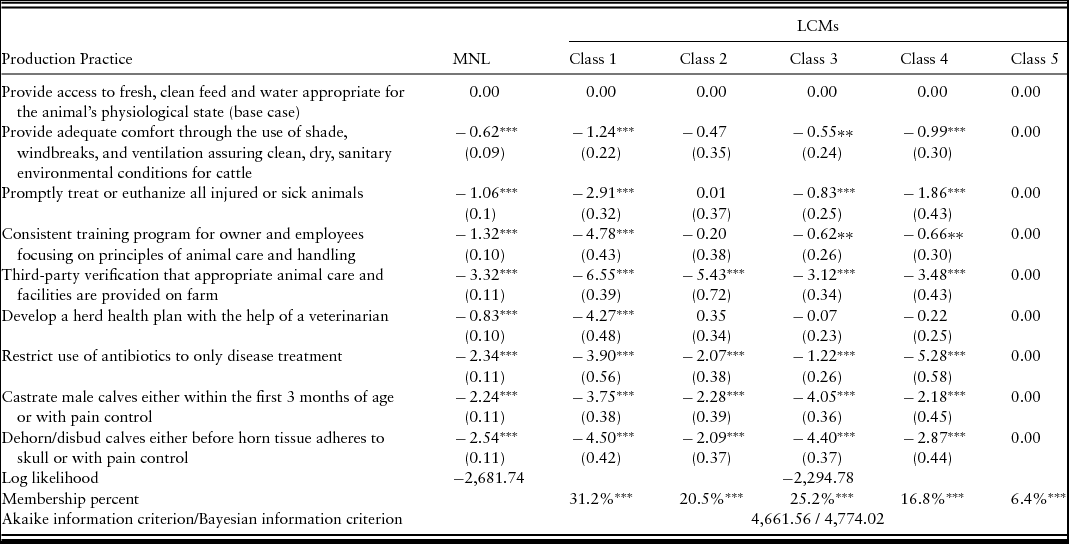
Table A4. U.S. Cow-Calf Producer Practical Model Coefficient Estimates (n = 206)
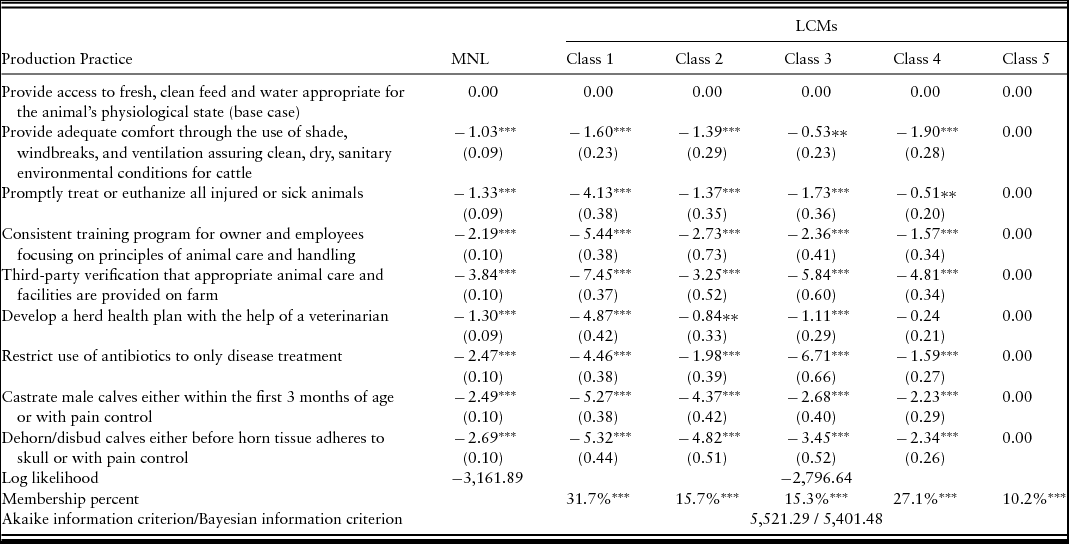
Table A5. Descriptive Statistics across Public Classes and t-Tests of Differences in Sample Average across Classes

Table A6. Descriptive Statistics across Producer Classes and t-Tests of Differences in Sample Average across Classes


