Mild cognitive impairment (MCI) is a transition state between normal aging and dementia. MCI diagnosis is most often determined by the presence or absence of memory impairment, the ability to continue general cognitive and functional activities, and the absence of diagnosed dementia.Reference Morris and Cummings 1 - Reference Petersen, Smith and Ivnik 3
The MoCA, Montreal Cognitive Assessment, is 10-minute, one-page, 30-point cognitive screening testReference Nasreddine, Phillips and Bédirian 4 used around the world to help detect MCI.
Although MoCA was designed as a diagnostic screening tool, clinicians have increasingly used it on longitudinal assessments. Repeated measures may lead to a practice effect and decrease the test validity. The development of reliable alternate versions would counteract these inconveniences.
In 2012, Ana Costa et al developed two alternate forms for the German MoCA test with the goal of determining the reliability of the alternate forms for longitudinal assessments.Reference Costa, Fimm and Friesen 5 The original and one of two alternate forms were administered to MCI, Alzheimer’s disease, and a control group of patients within a 60-minute interval. A strong correlation between the alternate forms and the original MoCA was observed, indicating that all three forms could be used with reliability and alternatively for cognitive assessment.
The purpose of this study is to validate the alternate versions 2 and 3 of the French MoCA test to assist physicians in the detection of MCI, while decreasing the learning effect upon repeated testing.
Methods
Participants
Twenty-five subjects with amnestic MCI who met the Petersen criteria,Reference Petersen 6 who underwent a recent (less than 6 months) confirmation by a neuropsychological assessment (with a minimum of 1.5 standard deviations below normal on the Rey Auditory Verbal Learning Test) were recruited at the MoCA Clinic and Institute in Québec, Canada, to form the MCI group. Subjects were aged 55 years or older (average age, 72.69); both males and females were included. Subjects had to be fluent in French.
An additional 25 patients were recruited to form the normal control (NC) group. Subjects in this group considered themselves healthy, 65 years of age and older (average age, 72.88), had 5 years or more of formal education, functioned independently in the community, and also had to be fluent in French. Healthy controls did not undergo neuropsychological assessment, but were not considered depressed according to the Geriatric Depression scale and did not exhibit significant cognitive complaints on Subjective Memory Scale (SMS). See Appendix 1 for inclusion and exclusion criteria.
All subjects signed a written informed consent. The study was approved by an independent ethics committee.
Procedure
Eligible subjects that were recruited were tested with MoCA version 1 (original MoCA version), version 2, and version 3 within the same session. The counterbalanced method was used to have a balanced order of administration of versions 1, 2, and 3 that are presented equally in terms of the sequence in positions 1, 2, or 3 for each group of subject group. All three versions were administered back to back within 30 minutes (10 minutes per test). The test was administered to the subjects in each group (MCI and NC) by the same examiner; however, a different examiner was used to correct all the subjects’ tests.
The test was administered to patients as they were seated comfortably in a quiet room in an environment that would elicit compliant participation and cooperation. All tests and medical evaluations were conducted at the MoCA Clinic and Institute.
MoCA Test and Alternate Versions
Alternate versions’ development consisted of replacing all elements of the original MoCA test with equivalent elements that respect complexity, level of difficulty, administration and scoring time, linguistic frequency, cultural compatibility, cognitive domain specificity, and ability to discriminate between healthy controls and patients with MCI as well as the original version in terms of sensitivity and specificity and cutoff scores.
New test items had to be very close to the original version because they were already shown to discriminate between normal controls and subjects with MCI. They also had to be different to prevent a learning effect. All new test elements for the new versions were chosen by one author (ZN) by testing the items on the memory clinic staff and making changes while preserving the concept, complexity, ease of administration/rating, and category of information compared with the original version.
The item-by-item changes follow.
-
∙ Trail: Alternating between numbers and letters; only the spatial location of the numbers and letters were changed.
-
∙ Cube: a different three-dimensional element was chosen with a similar time to complete the task.
-
∙ Clock: The time was changed to 9:10 (version 7.2) from 11:10; the subject may choose to put the minute hand on the number 10, thus preserving the abstraction/executive function element as well as the same visuospatial elements. The same concept was used for version 3 with the time at 10:05.
-
∙ Animal naming: lion, rhino, and camel were replaced with a similar complex of and frequently known animals (version 7.2: snake, elephant, and crocodile; version 7.3: horse, tiger, and duck).
-
∙ Memory: Five words were chosen to respect the category, frequency, and length of the words in version 1; for example, face was replaced by hand (in French: main) in version 7.2, and leg (in French: jambe) in version 7.3.
-
∙ Attention: digit span: the forward and backward numbers were shuffled only.
-
∙ Letter A: not changed because the learning effect was not considered to be possible.
-
∙ Serial 7: the same concept was kept by subtracting from a round number, starting at 70 for version 2 and 60 for version 3, instead of 100.
-
∙ Sentence repetition: the number of words, grammatical complexity, and understandability were respected.
-
∙ Letter fluency: Equally frequent letters were chosen by using their frequency in the dictionary and testing them on the clinic staff.
-
∙ Abstraction: The same level of difficulty and frequency of the elements was respected, with one easier task and one harder.
-
∙ Orientation: Not changed because it already varies from one test to the next.
In a preliminary study, where alternate versions 2 and 3 in subjects speaking French were administered to MCI (n=25), AD (n=28), and NC (n=33) patients, results revealed that these versions were slightly more difficult than the original MoCA version. As a result, changes to versions 2 and 3 were made that included replacing a few components in the MoCA 2 and MoCA 3 tests (Tables 1 and 2). See www.mocatest.org for the original French MoCA version 7.1 and the two alternate MoCA 7.2 and 7.3 versions used to test subjects in this study.
Table 1 Summary of the changes made from the older French MoCA version 2
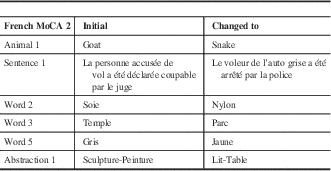
The “Initial” column refers to what the alternate version 2 for the French test contained. The “Changed to” column refers to the changes made on the test for specific items from the “initial” version 2 test. The test containing the changes is now the French alternate MoCA 2 version used for diagnostic purposes.
Table 2 Summary of the changes made from the older French MoCA version 3
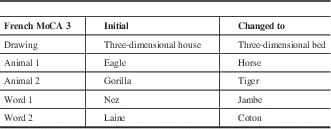
The “Initial” column refers to what the alternate version 3 for the French test contained. The “Changed to” column refers to the changes made on the test for specific items from the “initial” version 3 test. The test containing the changes is now the French alternate MoCA 3 version used for diagnostic purposes.
Statistical Analysis
Sample sizes were based on practical possibility of recruiting patients as well as being based on prior experience with the MoCA validation study.Reference Nasreddine, Phillips and Bédirian 4 A minimum sample size of 25 subjects per group was chosen to provide a minimum of 80% power (this is considered to be within the reasonable norms of a minimum of 80% to 90%), which is able to detect an effect size of 0.6 points in this study and is considered moderate to high according to Cohen. Clinically, a difference of 2 points is considered significant on a 30-point test according to the author’s (ZN) clinical experience with this test.
Validation and comparison assessments were conducted by performing t tests and determining intraclass correlation coefficients among the three MoCA test versions as well as the MCI versus NC study subject groups.
Intraclass correlation coefficients (ICCs) are generally calculated to understand consistency or conformity between two or more quantitative measurements.Reference Müller and Büttner 7 Given that all subjects were given all MoCA versions by one administrator, ICCs were calculated, again using SPSS, to assess the reliability and consistency of score measurements by a single test administrator during the multiple test distributions. Scores of the three possible combinations of alternate MoCA versions were compared in both subject populations (NC and MCI). A single measure ICC value that falls between the upper and lower bound of the 95% confidence interval indicates consistency of measurements from one test score to the next by the same test administrator. Although the SPSS-generated test results also provide an average measure ICC, this value is not discussed in this case because the value is an estimate that is computed assuming the interaction effect is absent.
Moreover, two-tailed paired sample tests using SPSS was also performed among the different MoCA versions to assess whether the difference of mean scores generated by the two subject groups from one MoCA version to the next was of significance or could be disregarded. In other words, the paired t test was used to assess whether the mean scores of the alternate versions agreed with each other, on average.
A receiver operating characteristics plot (ROC curve) was also generated to visualize accuracy for MCI detection amongst the three MoCA test versions.
Results and Discussion
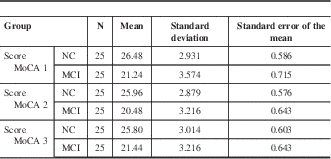
Mean average score for NC subjects from MoCA version 1 varied by −0.52 to −0.68 points with a variation in standard error of −0.1 to +0.017 points in comparison to MoCA versions 2 and 3. Whereas, MCI subjects scored an average of 0.76 to 0.2 points lower on MoCA versions 2 and 3, relative to MoCA 1. Similarly, standard error for the two alternate versions was also lower in comparison to MoCA version 1 (±0.072 points lower) (Table 3).
Table 3 Mean score for NC and MCI population groups who were tested with all three MoCA test versions
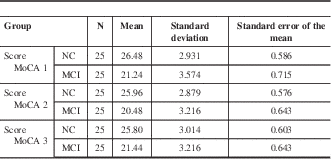
Mean score was generated from each subject group, where N=25.
Given the scores presented in Table 3, it can be seen that in all three MoCA versions, the MCI group was consistently below 26 points, which is the cognitively impaired range (MoCA 1 mean score=21.24; MoCA 2 mean score=20.48; MoCA 3 mean score=21.44). On the other hand, in the NC subject group, all three MoCA versions demonstrated mean scores ranging from 25.80 to 26.48, which is in the normal range.
Paired sample correlation test was performed in both subject groups with all three possible MoCA version pairing combinations in order to measure the strength of each test version in relation to one another. Correlation coefficients ranged from r=0.813 to r=0.842 for the MCI group. On the other hand, correlation coefficients in the NC group ranged from r=0.676 to r=0.827 (Table 4). Given that all correlation coefficients seen are positive and greater than 0.5 served as an indication that MoCA pairs in each given case shared a strong linear relationship. It was also observed that the MoCA pairs for the MCI subjects shared an even stronger linear relationship (mean correlation coefficient, r=0.825) when compared to the MoCA pairs in the NC subjects (mean correlation coefficient, r=0.745).
Table 4 Correlation coefficients and p values for mean average MoCA test scores in three possible combination pairs in the NC and MCI subject groups
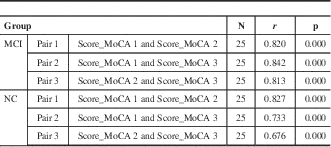
N=25; pair 1= score between MoCA 1 and MoCA 2; pair 2= score between MoCA 1 and MoCA 3; pair 3= score between MoCA 2 and MoCA 3. A value of p< 0.05 is indicative of significance. A positive correlation coefficient (r) >0.5 is indicative of a positive linear relationship in a pair. The closer the positive r gets to +1.0, the stronger the positive linear relationship within a given pair.
Where significance level was set at 0.05, significant values for all paired combinations ranged from 0.023 to 0.739 (Table 5). The 2-tailed significant values relative to the set significance level provided a basis for determining whether the difference observed in the mean score of a given pair was important enough to give an indication as to whether each MoCA version met the adequate qualification of serving as an alternate diagnostic test version. ρ-values above 0.05 were an indication of non-significance, whereas, a ρ -value less 0.05 was an indication of significance in difference.
Table 5 Two-tailed paired sample t test for the three possible combination pairs of MoCA versions in the NC and MCI subject groups, determined by SPSS

CI=confidence interval; df=degrees of freedom; SD=standard deviation; SEM=standard error of the mean. Mean column depicts difference in mean average score between the alternate MoCA versions in each pair. SD and SEM provide the magnitude of the random fluctuations present within the difference of mean score; 95% CI of the difference is determined to demonstrate whether mean difference falls within the lower and upper level of confidence. Test statistic (t) expresses size of the difference relative to the size of the standard error. df (N=25; df=N−1=24), along with “t” allows for determining significance, where p>0.05 implies nonsignificance. Pair 1 assesses the difference in mean average score between MoCA 1 and MoCA 2; pair 2 assesses the difference in mean average score between MoCA 1 and MoCA 3; and pair 3 assesses the difference in mean average score between MoCA 2 and MoCA 3.
In all cases, with the exception of Pair 3 (Score_MoCA 2 – Score_MoCA 3) of the MCI group, all significance values (ρ) were greater than 0.05 (Table 5), indicating that the differences observed from the scores of one MoCA version to the next was not significant enough. In other words, the ability to correctly detect an MCI patient based on MoCA score by all three versions was still equally valid, regardless of the differences of scores observed such as between version 2 and 3. Clinically, a difference of 2 points is considered significant on a 30 point test according to the author’s (ZN) clinical experience with this test. Therefore MoCA version 2 and 3 in MCI subjects was the only pair that showed a small difference in the average total score of 0.960, with a significant p<0.02, was not considered clinically significant. Also Intraclass correlation coefficient comparison of MoCA 2 and MoCA 3 test scores in MCI and NC patients were comparable as well as the Area Under the Curve of French Alternate MoCA Tests versus Original French MoCA test for separating MCI from NC.
When MoCA 1 and MoCA 2 scores were assessed, single measure intraclass correlation values for MCI (ICC=0.801) and NC (ICC=0.819) both fell within their corresponding 95% confidence intervals (MCI=0.595-0.908; NC=0.634-0.916)(Table 6).
Table 6 Intraclass correlation coefficient comparison of MoCA 1 and MoCA 2 test scores in MCI and NC patients generated using SPSS

Table shows results of a two-way mixed effects model in which people effects are random and measures effects are fixed.
* ICCs using an absolute agreement definition.
† Single measure values provide the value for which the estimator is the same, whether the interaction effect is present or not.
‡ Average measures values denote an estimated value computed based on the assumption that the interaction effect is absent.
Similarly, single measure ICC’s in the MCI and NC subject population between MoCA 1 and MoCA 3 also fell within their corresponding 95% confidence intervals. ICC for MCI population was 0.842 (with 95% confidence interval between 0.674-0.927), whereas ICC=0.721 for the NC population (with 95% confidence interval between 0.468-0.866) (Table 7).
Table 7 ICC comparison of MoCA 1 and MoCA 3 test scores in MCI and NC patients generated using SPSS

Table shows results of a two-way mixed effects model in which people effects are random and measures effects are fixed.
* ICCs using an absolute agreement definition.
† Single measure values provide the value for which the estimator is the same, whether the interaction effect is present or not.
‡ Average measures values denote an estimated value computed based on the assumption that the interaction effect is absent.
ICC for MoCA 2 and MoCA 3 in both the MCI (ICC=0.784) and NC (ICC=0.683) cohorts also fell within their respective 95% confidence intervals (95% confidence interval=0.535-0.902 for MCI; 95% confidence interval=0.399-0.847 for NC) (Table 8).
Table 8 ICC comparison of MoCA 2 and MoCA 3 test scores in MCI and NC patients generated using SPSS

Table shows results of a two-way mixed effects model in which people effects are random and measures effects are fixed.
* ICCs using an absolute agreement definition.
† Single measure values provide the value for which the estimator is the same, whether the interaction effect is present or not.
‡ Average measures values denote an estimated value computed based on the assumption that the interaction effect is absent.
Thus, given the ICC’s observed amongst all three French MoCA tests, within each corresponding subject cohort, the possibility of lack of consistency in terms of reliability and consistency of score measurements due to the fact that a single test administrator was used to distribute all three tests on multiple occurrences, could be ruled out. In other words, all intraclass correlations indicated that the single test administrator used throughout the whole of the validation study was effective in obtaining test scores that were consistent and reliable for all three MoCA test versions in the MCI and NC subject groups.
A receiver operating characteristics plot was also generated to visualize accuracy for MCI detection among the three MoCA test versions. All three versions visually displayed high sensitivity and specificity because there was a trend observed of a vertical incline along with y-axis, with a horizontal incline towards the x-axis (Figure 1).

Figure 1 Receiver operating characteristic (ROC) curve for original French versus alternate French MoCA tests. ROC curve displaying sensitivity and specificity of all three MOCA tests where MoCA 1= score_v1 (blue curve); MoCA 2=score_v2 (green curve); MoCA 3=score_v3 (yellow curve). A reference line is displayed as a diagonal line (purple). Positive actual state is 1-MCI. Scores for each version are compiled based on n=25 for positive and negative groups.
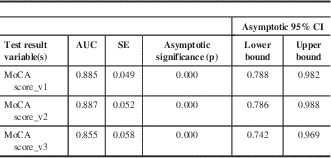
The area under the curve (AUC) was also calculated for all three receiver operating characteristic curves; the AUC ranged from 0.855 to 0.8885. The AUC values for all three MoCA versions fell within their corresponding 95% confidence intervals, which ranged from 0.742 to 0.788 in the lower confidence level, and from 0.969-0.988 in the upper confidence lever. Ρ values (p=0.000 for all three MoCA versions) were also calculated (Table 9).
Table 9 AUC for all three French MoCA test versions
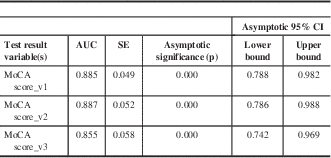
p<0.05 is indicative of significance. SE=standard error.
The results from our validation study demonstrated that all three MoCA versions were accurate for detecting MCI positives by displaying specificity and sensitivity (Figure 1). In the case of all three curves, a vertical incline along the y-axis towards 1.0 is observed, indicative of high sensitivity in the detection of true positives (MCI positive patients). Additionally, a horizontal trend towards 1.0 along the x-axis, representative of specificity was also observed in all three MoCA score curves, indicating the ability to correctly identify the true negatives (non-MCI patients). Finally, accuracy of the three versions of the diagnostic tests was further confirmed by the AUC values, where a trend towards values close to 1.0 was observed (Table 9).
Hypothesis tests in which p values and confidence intervals were obtained for all three MoCA versions helped further validate the accuracy of each diagnostic test (Table 9). In the case of each MoCA test version, AUCs fell within their corresponding confidence intervals, and p values demonstrating nonsignificance indicated that all three MOCA versions could be used interchangeably without compromising the accuracy for detection of MCI patients.
Conclusions
This validation study shows that alternative French MoCA test versions 2 and 3 are equivalent to the original French MoCA test. The three French MoCA tests versions can be used interchangeably with high reliability and consistency to discriminate between MCI and healthy subjects, thus decreasing potential learning effects when the test is administered frequently.
Disclosures
ZN has served as a principal investigator and received research grants from Roche, Eli Lilly, V & V Therapeutics, Eisai, Astra Zeneca, and Merck; and is the director/owner of MoCA Test Inc., receives licensing fees and royalties from licensing agreements when the test is used commercially by pharma, and is the copyright owner of the MoCA test. BBP is a freelance medical writer and has received writing fees from the MoCA Test Inc.
Supplementary Material
For supplementary material/s referred to in this article, please visit http://dx.doi.org/10.1017/cjn.2016.273
Appendix 1
Inclusion/Exclusion Criteria for Health Controls Eligibility
Inclusions
-
1. 65 years of age and older
-
2. 5 years or more of formal education
-
3. Must be functioning independently in the community
-
4. Fluent in the French language
Exclusions
-
1. History of a central nervous system disorder (epilepsy, head trauma, stroke, brain lesion), as well as having any known amnesia or cognitive deficit, or present any condition with susceptibility to causing dementia or cognitive deficit (alcohol abuse, drug abuse, major organ failure, neoplastic disease, sleep apnea)
-
2. Subject must not have any learning disability, attention deficit disorder, or mental retardation
-
3. Subject must not have any physical handicap which could influence test results (paralysis, blindness, and severe hearing deficits)
-
4. Subject must not have preexisting or current major psychiatric illness (major depression requiring hospitalization, bipolar affective disorder, schizophrenia). Previously treated depression lacking hospitalization is permitted if subject has been free of any depressive symptoms within the last 6 months and has scored 6 or less on the Geriatric Depression Scale during screening.
-
5. Subject must not have been on any unstable dose of centrally acting medication in the past 6 months. Stable (for at least 6 months) low doses of hypnotics and antidepressants are allowed.
-
6. Subject may take antiepileptic medication if it has been prescribed for pain control and NOT epilepsy
-
7. Subject may take neuroleptics if taken at low doses and as hypnotics
-
8. Subject must not have a subjective memory scale score of 7 or more
-
9. Subject must not have above permitted alcohol consumption:
-
a) 3 drinks or more of 200 ml of 5%-7% alcohol per day for MEN
-
b) 2 drinks or more of 200 ml of 5%-7% alcohol per day for WOMEN
-
c) 1 or more drink of 200 mL of 35% alcohol per day for MEN and WOMEN
-
10. Subject must not have consumed drugs in the past 5 years. Occasion marijuana use (maximum once a week) is permitted if not consumed within the last week prior to screening
-
11. Vitamins, food or herbal supplements, gingko biloba, and omega-3 are allowed.


