Beginning in fall of 2022, a surge in pediatric hospitalizations for viral respiratory illness in the United States led to significant consumption of hospital resources. Unlike prior years, the respiratory illness season started 2 months earlier, in September, heralded by a rise in the incidence of infection with respiratory syncytial virus (RSV).Reference Hamid, Winn and Parikh 1 This early uptick in RSV infections, coupled with projected coalescence with infections caused by influenza and severe acute respiratory syndrome coronavirus 2, raised concern for overwhelming consumption of pediatric hospital resources over the ensuing months.
While a shortage of pediatric hospital beds across the country during the 2022–2023 respiratory season has been reported,Reference Wu 2 , 3 utilization of acute and critical care resources is unknown. Knowledge of critical care resource capacity is paramount at times of critical illness surges, and prior inventories of critical care have been reported. Reference Horak, Griffin and Brown4–Reference Odetola, Clark and Freed6 However, to be used for planning during a public health emergency such as that experienced in late 2022, contemporaneous data on the capacity of acute and critical care resources are needed.
The current study was a rapid turnaround inventory of human and material acute and critical care resource availability and utilization at a sample of US pediatric hospitals during the viral respiratory illness surge from fall 2022 through winter 2023.
Methods
A cross-sectional study was conducted of physicians in pediatric acute and critical care medicine, and senior hospital administrators, to ascertain resource utilization during the ongoing patient surge. Participants were recruited as a convenience sample by invitations posted to electronic listservs maintained by the American Academy of Pediatrics (AAP) sections of critical care and hospital medicine, 2 Children’s Hospital Association (CHA) community discussion forums, and to the PedSCCM.org website.
Participants
Eligible study participants were physicians in acute and critical care medicine, and senior hospital administrators, who were:
-
• Members of the AAP sections of critical care and hospital medicine.
-
• Members of 2 community discussion forums within CHA: the quality and patient safety and capacity management communities. These are predominantly senior hospital administrators, physicians, and nurses with critical roles in hospital disaster preparedness, quality of care, capacity management, and patient safety.
-
• Pediatric intensive care unit (PICU) clinicians with access to PedSCCM.org, a pediatric critical care website.
Study participation was voluntary and uncompensated, and respondents from hospitals without PICUs were excluded. The study was deemed not regulated (HUM00228469) by the institutional review board of the study institution. To mitigate recall bias and enhance data veracity, respondents had the option to save their responses, verify reported data, and return to the survey repeatedly until final submission.
Survey Design and Administration
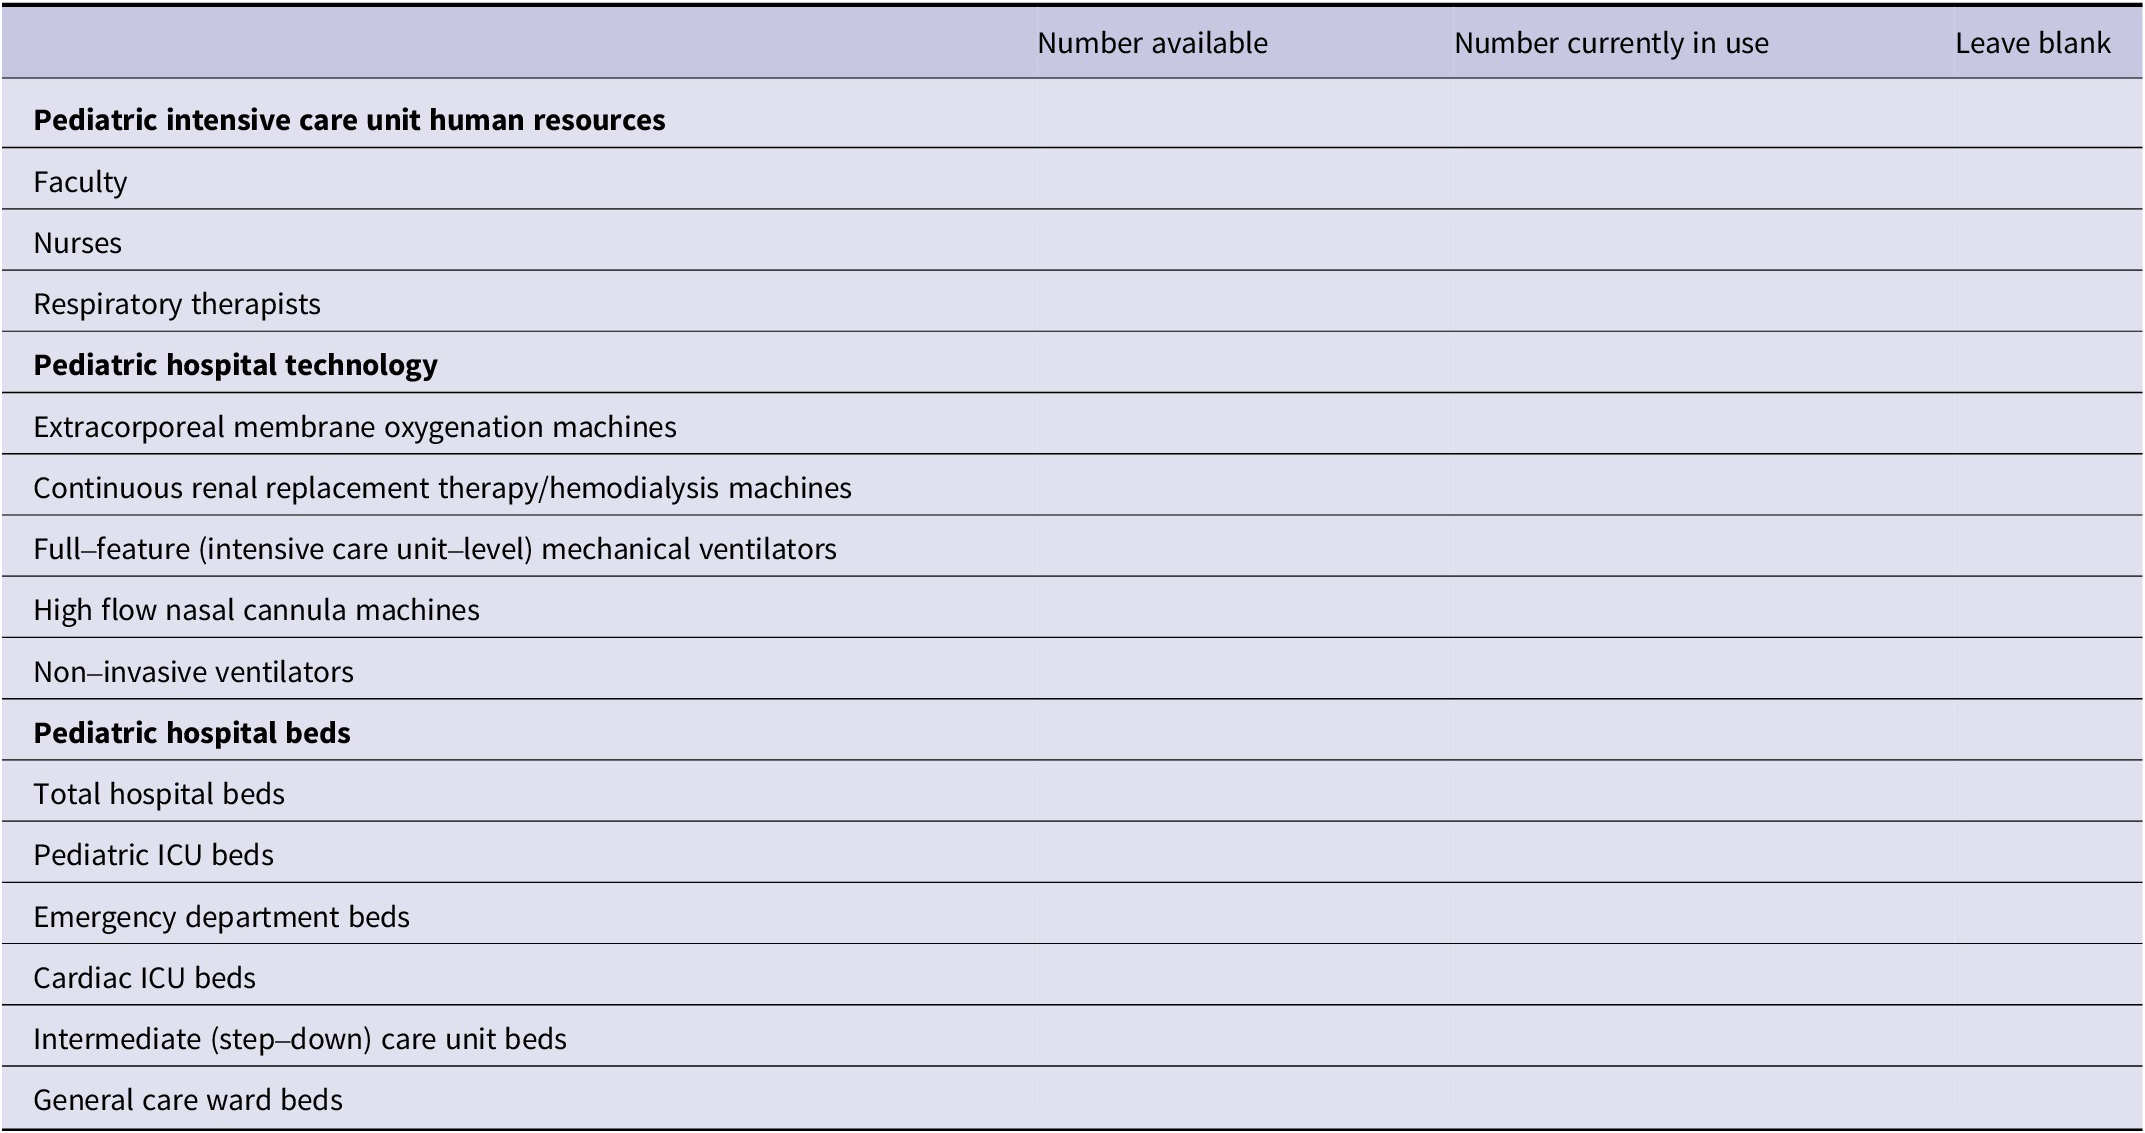
A cross-sectional survey was conducted of the resource capacity at hospitals that employed the study participants. The survey instrument was a 1-page document to inventory key hospital acute and critical care human and material resources (see Appendix). Invitations to participate were sent in 3 weekly waves between January 5, 2023, and February 10, 2023, to electronic listservs maintained by the AAP sections of critical care and hospital medicine, respectively. Two messages were sent to 2 CHA community discussion forums and 1 posting was made to the PedSCCM.org website. The survey was fielded to capture the real-time dynamics of patient flow, resource capacity, and the extent of resource redeployment and redistribution that occurred during a surge in the incidence of respiratory viral illness.
Data Management and Analysis
Data were collected and managed using REDCap (Research Electronic Data Capture) tools hosted at the study institution.Reference Harris, Taylor and Thielke 7 All analyses were conducted using Stata 17 for Windows (Stata Corp, College Station, TX, USA). The unit of analysis for the study was the hospital. This approach was taken given that the denominator population of hospitals with membership in the organizations that served as sources of data for the study was unknown. Respondents indicated the name of their hospital and the associated zip code on the submitted survey instrument. This information was used to ensure only 1 respondent was counted per hospital. Descriptive analyses characterized responses regarding the distribution of acute and critical care resources with summary data presented as median values and interquartile range (25th, 75th percentiles). Resource utilization, expressed as a percentage, was calculated as the ratio of the count of resources currently in use to the count of resources available at baseline before the surge. For technology not available at all hospitals, counts included only hospitals with the specific technology.
Results
Hospital Characteristics
Thirty-five hospitals with a PICU were included in the analysis. The hospitals were from all 4 major census regions: Northeast (6), Midwest (8), South (12), and West (9). Among the 35 hospitals, 25 (71%) were not freestanding children’s hospitals, and 28 (80%) had a designated pediatric emergency department (ED). The ED staffing pool comprised a median of 10 (IQR: 5, 19) faculty physicians and 39 (14, 56) nurses. The PICU staffing pool included a median of 5 (3, 12) attending faculty physicians, and 20 (10, 50) nurses who provided a nurse-to-patient ratio of 1:2 (86%), 1:1 (9%), or 1:3 (6%).
Resource Use During the Surge
In the month preceding the survey, 26 (74%) hospitals diverted patients away from their ED to other hospitals, with 46% diverting 1-5 patients, 23% diverting 6-10 patients, and 31% diverting more than 10 patients. During that same month, respondents from 7 (20%) hospitals reported moving some mechanically ventilated patients from the PICU to other care settings, including the ED (2), intermediate care unit (2), cardiac ICU (1), ward space converted to an ICU (1), and a ward (1).
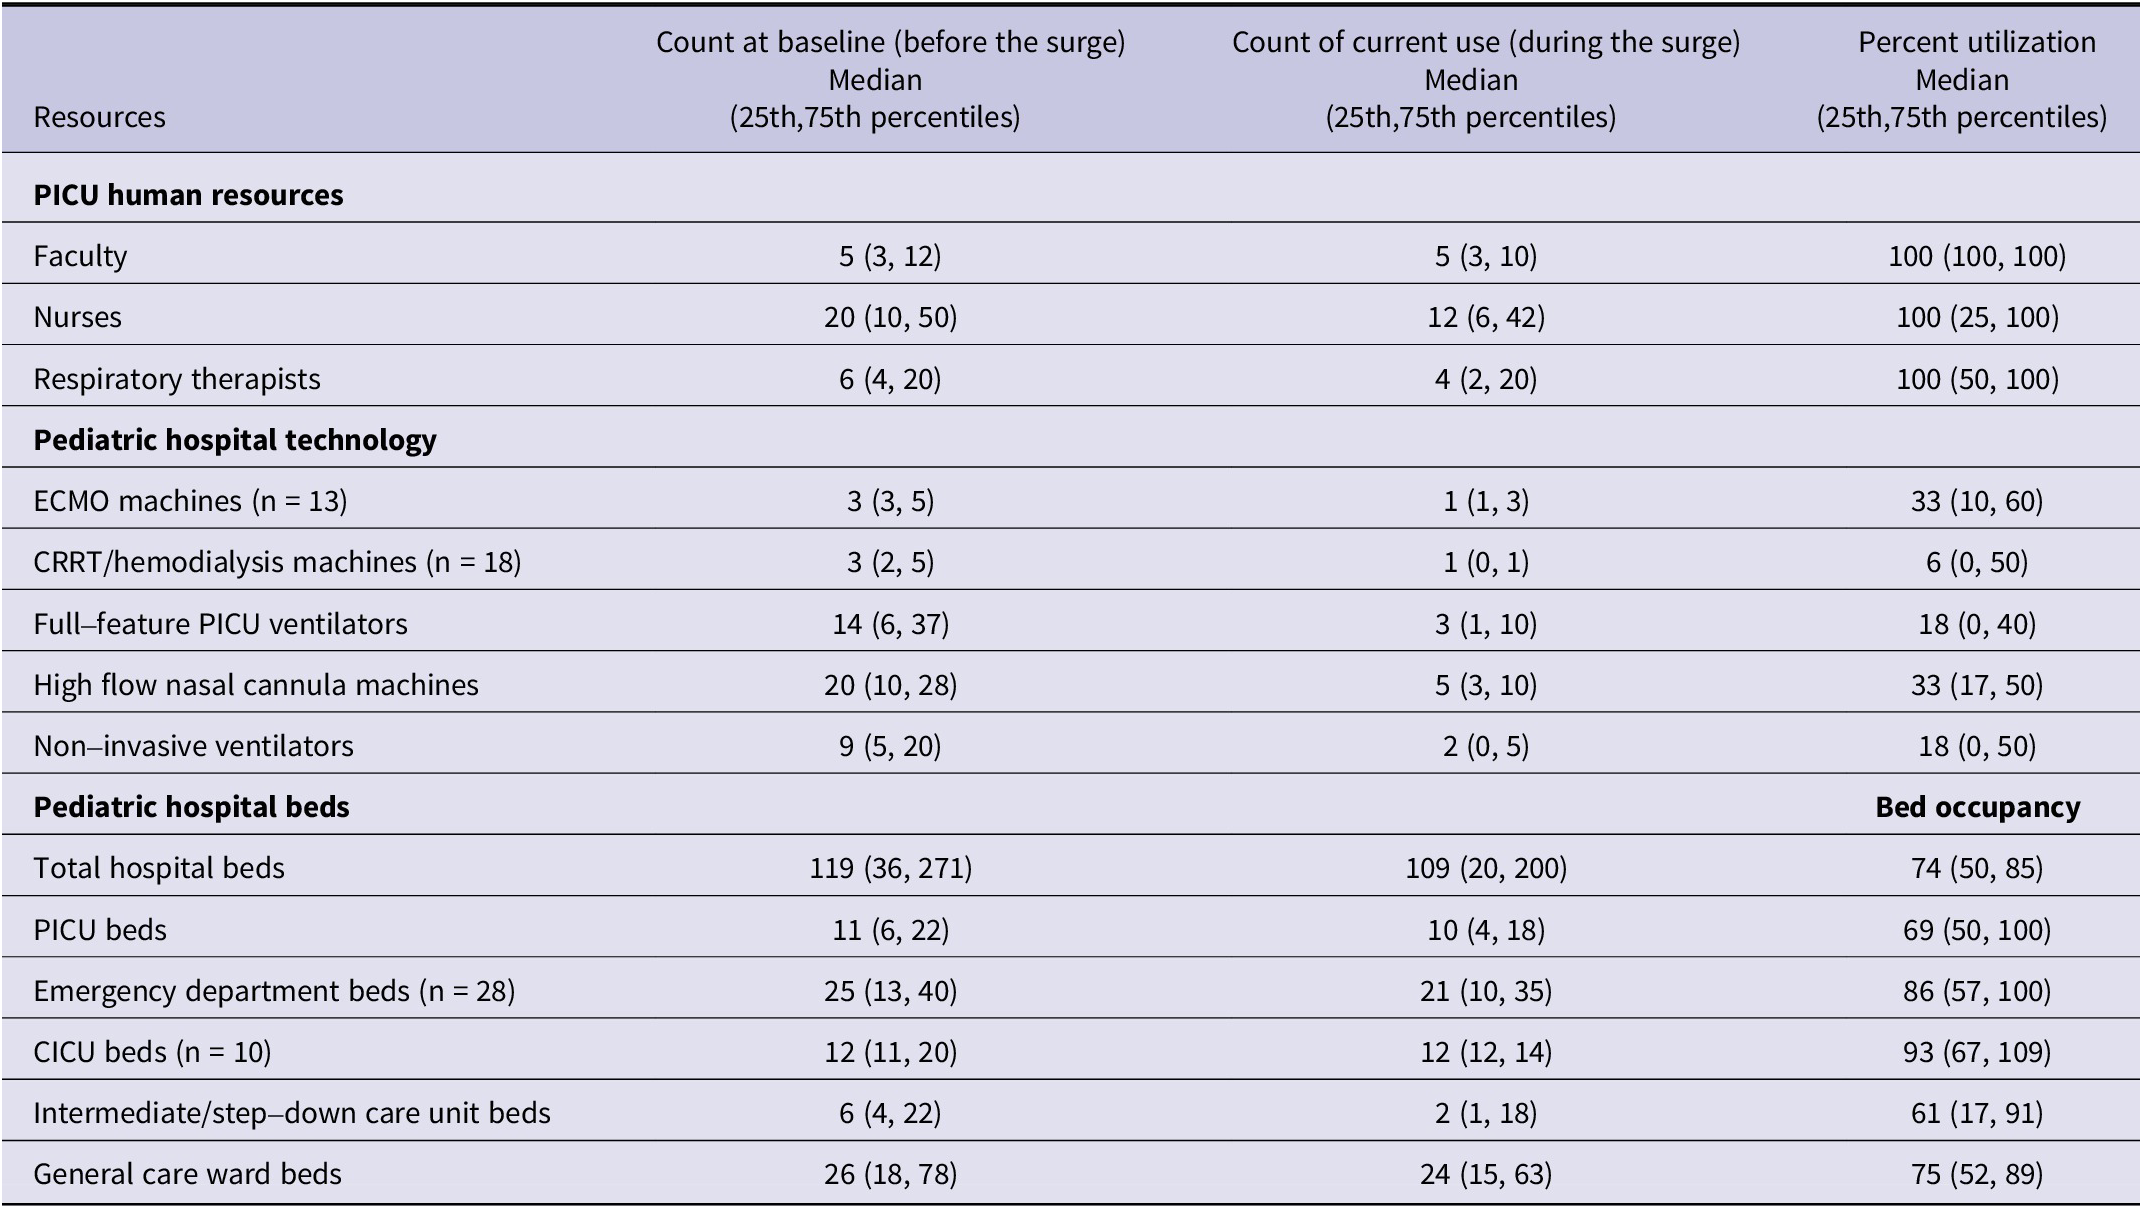
The utilization of human critical care resources was high, with PICU physicians, nurses, and respiratory therapists working at 100% capacity (Table 1). Hospital beds were in high use across all care settings, with cardiac intensive care unit (CICU) beds exceeding 100% use at 25% of 10 respondent hospitals that had a CICU (see Table 1) and full (100%) utilization of beds in the PICU and the ED at 1 of 4 respondent hospitals (see Table 1). Hospital technology, such as ventilators and dialysis machines, remained available at all institutions.
Table 1. Utilization of pediatric hospital acute and critical care resources at the time of the survey

Percent utilization is the ratio of the count of resources currently in use to the count of resources available at baseline before the surge; CICU, cardiac intensive care unit; CRRT, continuous renalreplacement therapy; ECMO, extracorporeal membrane oxygenation; PICU, pediatric intensive care unit.
Discussion
This study provides data on the availability and utilization of acute and critical care resources at a geographically widespread sample of US pediatric hospitals during the recent viral respiratory illness surge. The findings highlight high utilization of human critical care resources and pediatric hospital beds, and variability in the utilization of pediatric hospital technology. Given that hospitals with PICUs have been associated with beneficial outcomes for critically ill children,Reference Odetola, Miller, Davis and Bratton 8 , Reference Kanter 9 real-time information about acute and critical care resource capacity at these hospitals is important during periods of surges in demand for resources to ensure optimal health care delivery to critically ill children.
With US pediatric hospitals just emerging from the multi-year coronavirus disease (COVID-19) pandemic that impacted human and material hospital resource use for an extended period, the recent widespread surge in pediatric respiratory viral illness across the United States raised concern for an overwhelming impact on pediatric hospital resource use. The surge was unexpected both in terms of its early occurrence and the high volume of hospitalizations. Many hospitals were taken by surprise, prompting leaders at the AAP and CHA to ask for federal declaration of a public health emergency.Reference Jenco M 10
Respondent hospitals reported that physicians, nurses, and respiratory therapists were working at 100% capacity, raising the specter of overwork for PICU health care workers, amongst whom burnout is already quite prevalent.Reference Dalal, Gaydos and Gillespie 11 –Reference Rodríguez-Rey, Palacios and Alonso-Tapia 13 Although the duration of such heavy utilization of PICU staff could not be determined given the study’s cross-sectional nature, the multiple-month duration of the surge suggests the high likelihood of persistent burden. Given the known association of cumulative heavy workload with increased risk of infection,Reference Zingg, Holmes and Dettenkofer 14 health-care-acquired complications,Reference Chang, Yu and Chao 15 –Reference Boyle, Zeitz and Hoffman 18 and mortality,Reference Madsen, Ladelund and Linneberg 19 this persistent burden has the potential to affect the quality of care. Notably, beyond the PICU setting, 1 out of every 4 hospitals was operating at very high (85%) overall bed occupancy at the time of the survey, the threshold beyond which quality of care is impacted adversely.Reference Mateen, Wilde and Dennis 20 Similarly, the top quartile of PICUs for occupancy was at 100% capacity, and the median ED and CICU bed occupancy exceeded the concerning threshold of 85%. Importantly, with lower average daily cardiac ICU occupancy being associated with better cardiac arrest prevention,Reference Lasa, Banerjee and Zhang 21 the beyond-maximum bed occupancy in the CICU observed in the top quartile hospitals for bed occupancy is a source of concern regarding patient safety and the high potential for staff burnout. Patient-centered outcomes, resulting from the relocation of some mechanically ventilated patients to non-ICU or newly created ICU settings, are also unknown and require further research.
High ED bed occupancy (86%) led to the diversion of patients away from most respondent hospitals. Although patient outcomes were not captured in the study, diversion from the closest or most suitable hospital causes concern for potential adverse patient outcomes, including death. Reference Shen and Hsia22,Reference Shen and Hsia23 Importantly, the threshold of ED or hospital occupancy that prompts diversion of patients from the ED is unknown and is likely to be institution specific. Further research on patient diversion from the ED is warranted, with a robust collection of data on the frequency of patient diversion accompanied by capture of contemporaneous data on ED and hospital bed occupancy. Such work will be highly instructive to policy-makers and health care decision-makers at the hospital, local, and regional levels. It also has the potential to enhance optimal transfer of children to the next hospital with resource capacity to provide pediatric acute care during periods of high hospital census, including pediatric public health emergencies.
Recent reports of progressive decline in pediatric bed supply nationallyReference Cushing, Bucholz and Chien 24 have generated discourse on the preparedness of pediatric hospitals for future pediatric public health emergencies. The current study captured real-time data on the availability of resources for hospitalized children during what was described by pediatricians nationwide as the pediatric version of the peak of wave 1 of the outgoing COVID-19 pandemic. The 2022–2023 pediatric respiratory illness surge was a test case of emergency preparedness for children, and the study findings suggest significant overburdening of a fragile system.
Limitations
The study findings need to be interpreted considering certain limitations. The absence of a centralized repository of pediatric hospitals limited the ability to conduct a national inventory of pediatric critical care resource use. While the study sample was a convenience sample of hospitals not meant to be epidemiologically or statistically representative of the entire United States, the respondents were physicians in acute and critical care medicine, and senior hospital administrators who could provide reliable data to enable a rapid turnaround snapshot of events at a variety of hospitals that provided care to ill children during a rapidly evolving crisis. This pragmatic rapid turnaround survey captured data across the 4 major US census regions, from a mix of hospitals with varying structure and resource capacity. Although limited by the sample size and sampling methods, the findings’ generalizability was supported by the geographical and structural diversity of the study hospitals.
The study findings were also limited by the inability to capture the downstream patient and family-centered outcomes at the hospitals operating at such high capacity. Such outcomes would likely have supported reports of parental anxiety regarding the inability to have their children hospitalized due to lack of beds or having to travel a long distance to access needed pediatric care.Reference Zdanowicz 25
Conclusions
The fall 2022 to winter 2023 pediatric respiratory illness surge triggered significant hospital resource use—often to maximum capacity, and diversion of patients away from hospitals. Preparedness for future pediatric public health emergencies should innovate around resource capacity. The preparation for pediatric public health emergencies will be enhanced by detailed inventory of baseline resource capacity at pediatric hospitals, real-time capture of resource use during illness surges, and the evaluation of ongoing resource constraints, including pediatric bed supply, across the United States. Improved understanding of these resource constraints will likely provide opportunities to optimize health care delivery, address health care worker workload and well-being, and improve patient care.
Abbreviations
- AAP
-
American Academy of Pediatrics
- CHA
-
Children’s Hospital Association
- ED
-
emergency department
- ICU
-
intensive care unit
- PICU
-
pediatric intensive care unit
- RSV
-
respiratory syncytial virus
Acknowledgments
This manuscript represents the views of the authors and does not represent the views of the Department of Veterans Affairs or the US Government.
Author contribution
Drs Christner, Carlton, and Gorga participated in the study conception and design, interpretation of the data, and critical revision of the manuscript for important intellectual content. Ms Whittington participated in the study conception and design, acquisition and interpretation of the data, and critical revision of the manuscript for important intellectual content. Dr Odetola had full access to the data and takes responsibility for the integrity of the data and the accuracy of the data analysis. He participated in the study conception and design, data acquisition and interpretation, drafting of the manuscript, and critical revision of the manuscript for important intellectual content. All authors approved the final manuscript as submitted and agree to be accountable for all aspects of the work.
Funding statement
None.
Competing interest
The authors have no competing interest relevant to this article to disclose.
Appendix
Survey of Pediatric (Non-Neonatal) Critical Care Resources
Please circle the most appropriate answer for each question, unless directed otherwise.
The following questions refer only to pediatric NOT NEONATAL critical care resources CURRENTLY in your hospital.
-
1. Do you have a pediatric intensive care unit (PICU) within your hospital?
Yes → please go to Question 2 No → Please stop and submit the survey
-
2. Is your hospital a freestanding* children’s hospital? Yes No
-
3. What is the PICU average Nurse: Patient ratio? a. 1:1 b. 1:2 c. 1:3 d. Other____
-
4. Do you have a pediatric emergency department (ED) within your hospital? Yes No
-
5. How many Attending physicians work in the pediatric ED? _____
-
6. How many nurses are in your ED nursing pool? ___
-
7. In the past month:
-
7a. How many times has your hospital ED diverted patients away? a. 0 b. 1-5 c. 6-10 d. >10
-
7b. Have PICU patients on ventilators been housed in overflow units? Yes - Cardiac ICU PACU Step-down ICU Other___ No
-
Please fill in the information in the table below to determine the availability of critical care resources.


