INTRODUCTION
Community-acquired pneumonia is widely recognized to be an important public health problem but there are surprisingly few data on the current incidence of pneumonia in the United Kingdom and how this varies with calendar time and demographic factors such as age, gender and socioeconomic status.
In their guidelines the British Thoracic Society quote annual incidence figures of 6/1000 in the 18–39 years age group and 34/1000 in people aged ⩾75 years [1–3]. These figures are based on the research of Foy et al. [Reference Foy, Conney and Allan4] in the late 1970s in the United States and Jokinen et al. [Reference Jokinen5] in the early 1990s in Finland. More recently Almirall et al. [Reference Almirall6] reported a lower annual incidence rate of 1·6/1000 for people aged >14 years in Spain with a diagnosis of pneumonia confirmed radiologically. Table 1 summarizes studies to date on pneumonia incidence and there is a noticeable lack of recent large-scale studies of pneumonia incidence in the United Kingdom. Potential sources of data on pneumonia incidence include Hospital Episode Statistics, death registrations and computerized general practice databases. Clearly the estimates obtained using these different approaches will vary, but all will provide information on the impact of pneumonia in the United Kingdom and how incidence rates vary with demographic factors. Previous evidence suggests that less than a third of people with a diagnosis of pneumonia in the United Kingdom are admitted to hospital [Reference Holmes and Woodhead7], and so the majority of cases of pneumonia in the United Kingdom are diagnosed and managed by general practitioners (GPs). This suggests that data from Hospital Episodes Statistics will underestimate the true incidence of pneumonia markedly and for this reason we have chosen to study pneumonia incidence using a computerized general practice database. Our main aims were to estimate the overall incidence of pneumonia and current trends in the United Kingdom, to determine how the incidence of pneumonia varies with age, gender and socioeconomic status and to compare our findings with those of studies in other settings.
Table 1. Studies on incidence of community-acquired pneumonia
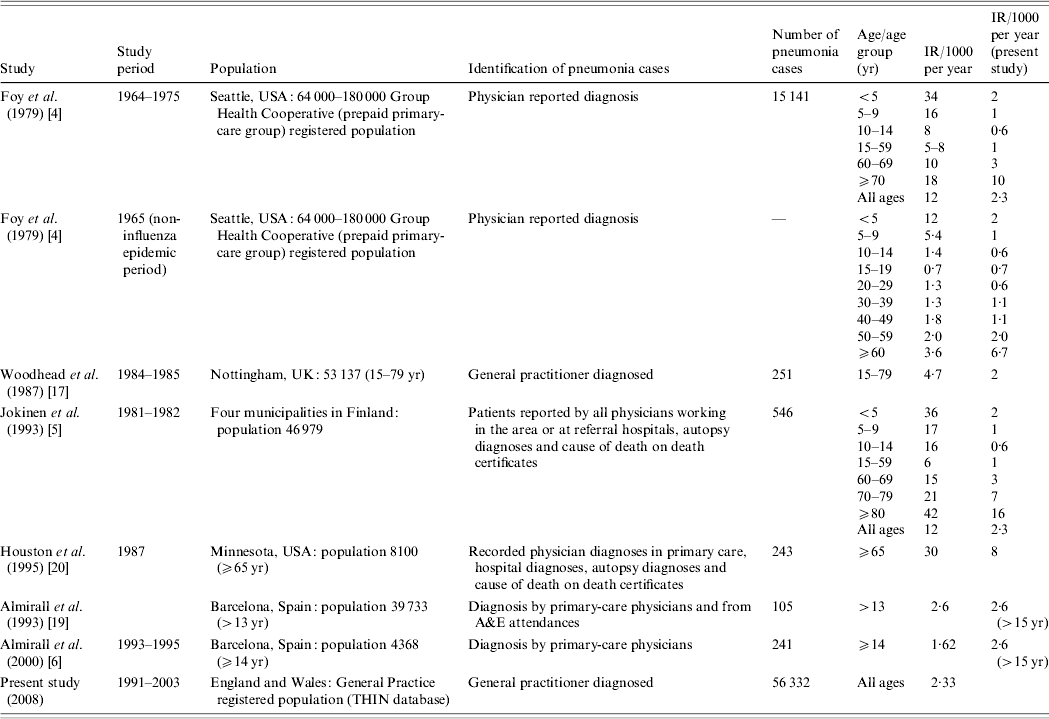
IR, Incidence rate.
METHODS
For our study we used The Health Information Network (THIN), a longitudinal database of computerized medical records from over 300 UK general practices [Reference Bourke, Dattani and Robinson8, 9]. In 2006 when the data for this study was extracted, THIN covered 4% of the UK population with representation from all sections of the population [10]. The THIN database currently includes more than 30 million person-years with diagnostic and prescribing data [9]. It has been shown to have a high level of completeness of clinical, diagnostic and prescribing data [Reference Bourke, Dattani and Robinson8, Reference Lewis11, 12]. Moreover, over half of THIN practices previously contributed data to the General Practice Research Database (GPRD), which has demonstrated high validity for diagnoses and coding in the case of respiratory diseases including pneumonia [Reference Lewis11, Reference Hansell13, 14]. All medical conditions and symptoms reported and diagnosed are recorded on the computer during a consultation. Medical conditions are recorded using the Read Clinical Classification version 2 and the codes may be cross-referenced to the International Classification of Diseases [10].
We identified all recorded diagnoses of pneumonia and acute lower respiratory tract infection from 1991 to 2003 using a look-up table of specific medical Read codes (codes available from the author on request). We excluded Read codes signifying working diagnoses, symptoms, signs and ill-defined conditions [10]. For our denominator values we used the total population active and contributing data to THIN on 1 July of each year. We calculated the overall incidence of pneumonia for our study period and stratified our results by calendar year, age group (5-year age bands), gender and deprivation. We looked for evidence of effect modification by age group and gender in the association between pneumonia incidence and socioeconomic deprivation. Our marker of deprivation was the Townsend index score (in quintiles) derived from the 2001 census at output area level (about 150 households). The Townsend score is calculated using data on house and car ownership, overcrowding of accommodation and employment status [Reference Adams, Ryan and White15]. In order to determine whether the use of specific pneumonia codes had changed over time we repeated our analyses for the four most commonly used pneumonia codes. To allow us to compare rates between different populations, and to allow for confounding variables such as age and sex, we used Poisson regression. All analyses were carried out in Stata SE9 (Stata Statistical Software: Stata/SE 9.0 for Windows; Stata Corporation, College Station, TX, USA). The study protocol was reviewed and approved by the Nottingham Research Ethics Committee.
RESULTS
We were able to identify 56 322 recorded diagnoses of pneumonia in our research database recorded between the years 1991–2003, inclusive. The mean age of people at pneumonia diagnosis was 61·9 years. Seventy-nine percent of cases had only a single recorded diagnosis of pneumonia.
Overall incidence
The overall crude incidence rate (IR) of pneumonia in our cohort between 1991 and 2003 was 233/100 000 person-years [95% confidence interval (CI) 231–235], and remained stable during the study period [incidence rate ratio (IRR) 1·01, 95% CI 1·01–1·01) (Fig. 1). Adjusting these crude incidence rates for age and gender did not alter this pattern.
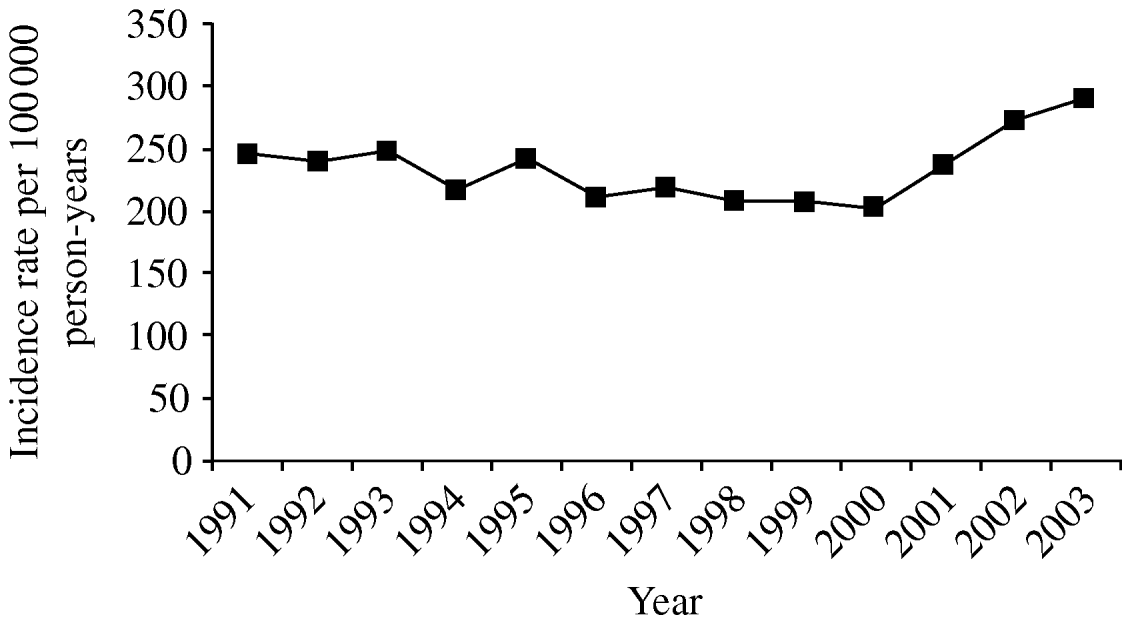
Fig. 1. Trends in pneumonia incidence, 1991–2003.
Incidence by age group and gender
The incidence of pneumonia was strongly related to age and two obvious peaks of incidence were present – the first in children aged <5 years where the incidence rate was 191/100 000 person-years (95% CI 184–198) and the second in people aged >60 years where the incidence rate was 666/100 000 person-years (95% CI 659–673). The incidence rate was lowest for people aged 20–24 years (IR 50/100 000 person-years, 95% CI 47–54).
The incidence of pneumonia was slightly higher in females compared to males (IRR 1·06, 95% CI 1·04–1·07). When adjusted for age, however, the incidence was lower in females (IRR 0·88, 95% CI 0·86–0·89). In general the association between pneumonia and age was similar in men and women, although in people aged >65 years the curve for men was shifted to the left by about 5 years (Fig. 2 a). In addition, there was also a slight peak in pneumonia incidence in women aged 30–39 years (Fig. 2 b) and the incidence rate ratio in comparison to men in the same age group was 1·14 (95% CI 1·07–1·21).
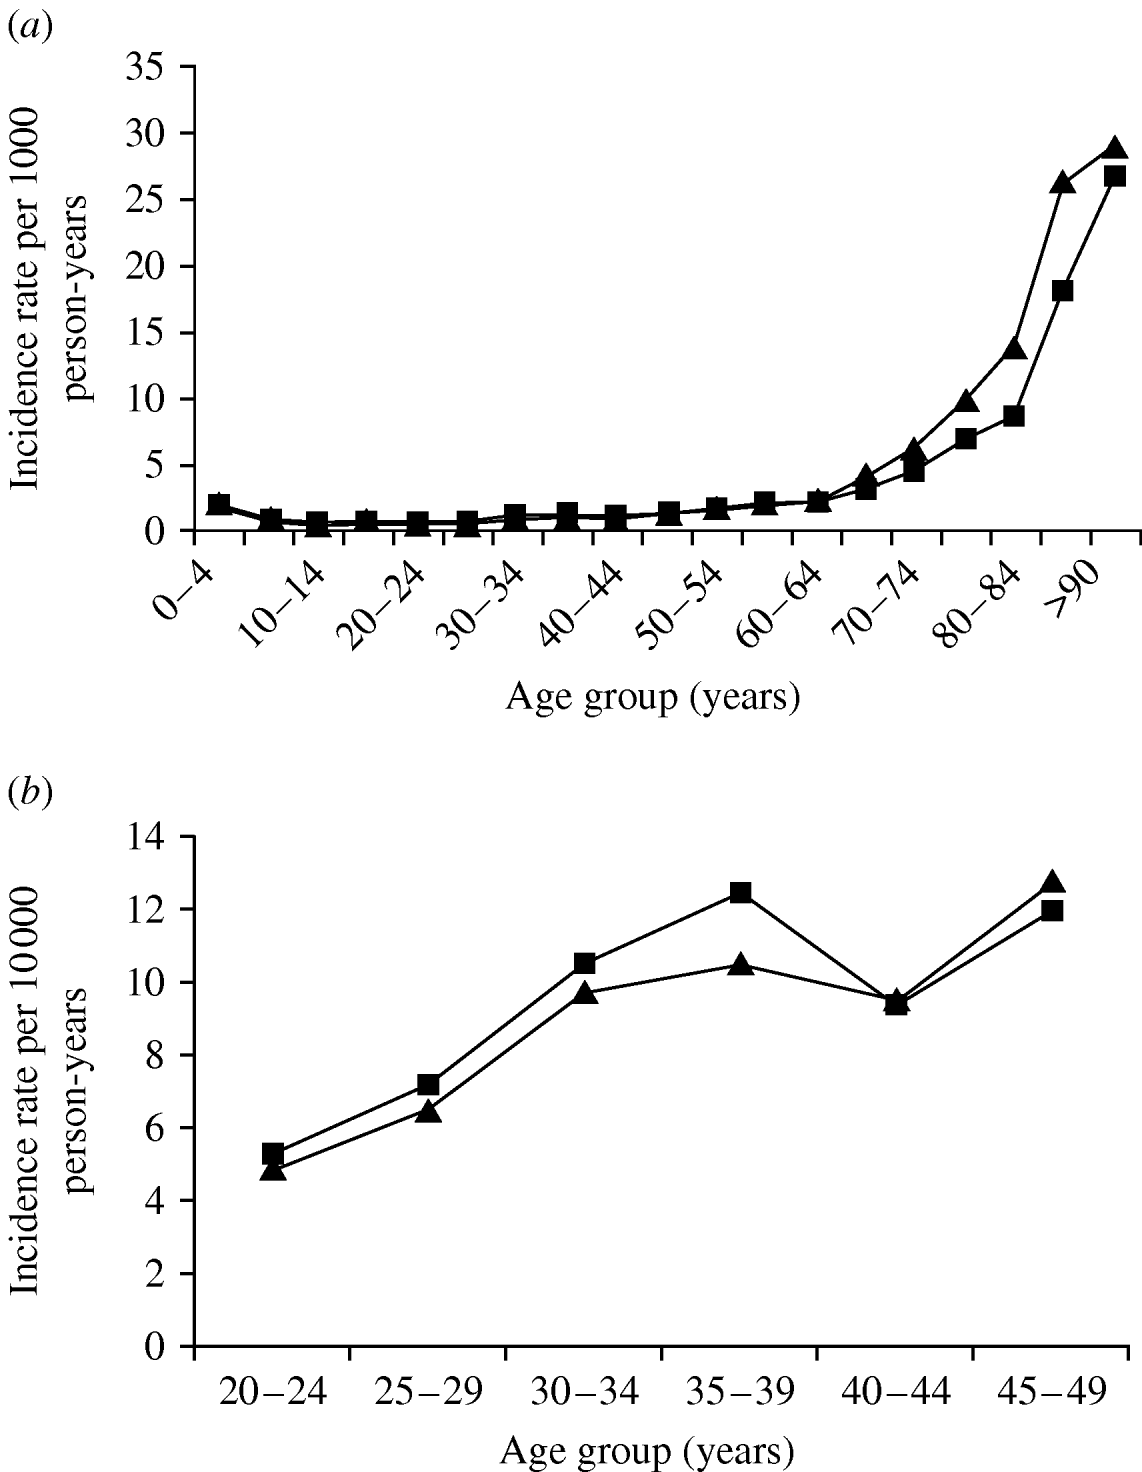
Fig. 2. Pneumonia incidence by gender and age group: (a) 1991–2003; (b) 20- to 49-year-olds. –▲–, Males; –■–, females.
Incidence by deprivation
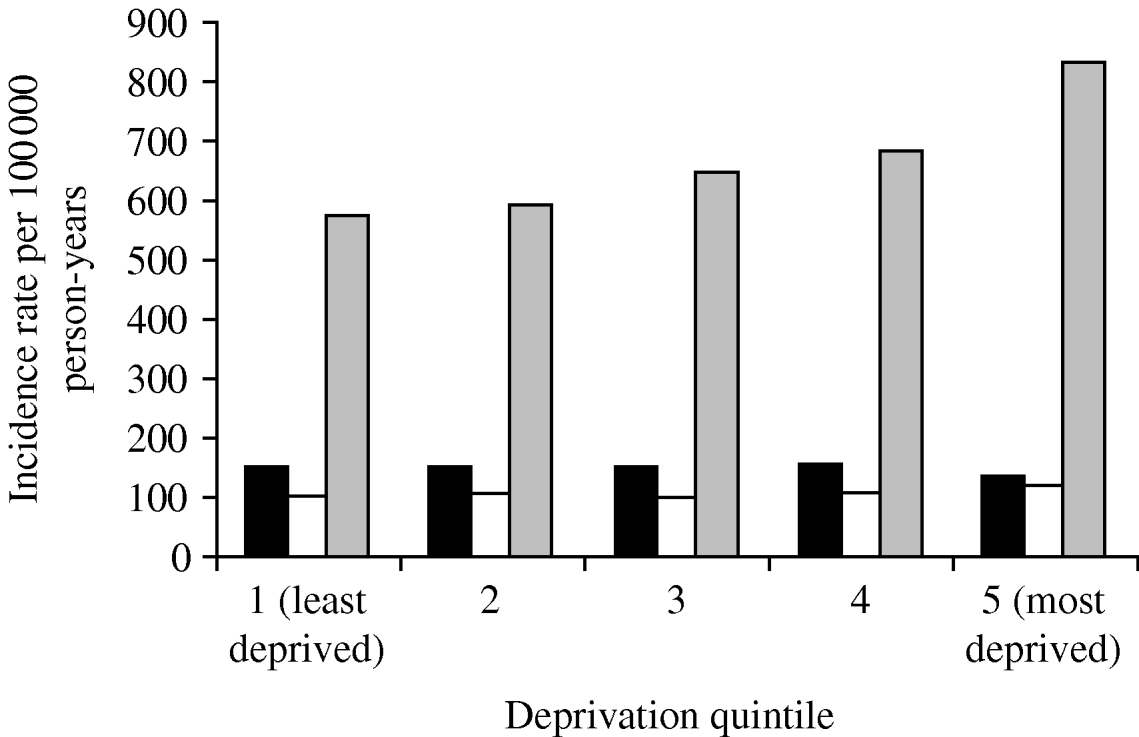
The incidence of pneumonia was associated with socioeconomic deprivation. The incidence in people in the most deprived group (Townsend score: quintile 5) was 277 100 000 person-years (95% CI 271–283) for the most deprived quintile and (IR 205/100 000 person-years, 95% CI 201–209) for the least deprived quintile. Even after taking into account age and gender effects, those in the most deprived quintile were nearly 30% more likely to contract pneumonia compared to those in the least deprived quintile (IRR 1·28, 95% CI 1·24–1·32) (Table 2). We found a significant interaction with age group but not with gender. In those aged >60 years, individuals in the most deprived quintile, almost 50% were more likely to contract pneumonia compared to those in the least deprived quintile (IRR 1·45, 95% CI 1·40–1·46). The statistical effect of the socioeconomic gradient became weaker in those aged 11–59 years (IRR 1·20, 95% CI 1·14–1·27). In children aged ⩽10 years, we did not observe any socioeconomic gradient (IRR 0·8, 95% CI 0·82–1·01) (Fig. 3).

Fig. 3. Pneumonia incidence by deprivation quintile and age group, 1991–2003. ■, 0–10 years; □, 11–59 years; ![]() , ⩾60 years.
, ⩾60 years.
Table 2. Age- and sex-adjusted pneumonia incidence rate ratios by deprivation quintile
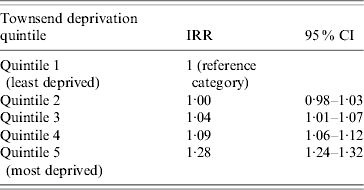
IRR, Incidence rate ratio; CI, confidence interval.
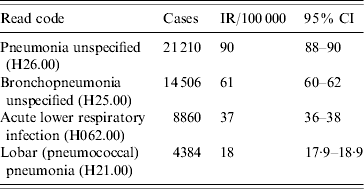
Individual Read codes
The four most frequent Read codes used by GPs for pneumonia were: pneumonia unspecified (H26.00), bronchopneumonia unspecified (H25.00), lobar pneumonia (H21.00) and acute lower respiratory infections (H062.00). Table 3 summarizes the incidence findings for these pneumonia Read codes individually and Figure 4 illustrates the incidence trends (1991–2003). There was a marked increase in the incidence of acute lower respiratory infections from the mid-1990s, and a decrease in the use of the pneumonia unspecified code at the same time. The incidence of the lobar pneumonia code was stable over time.
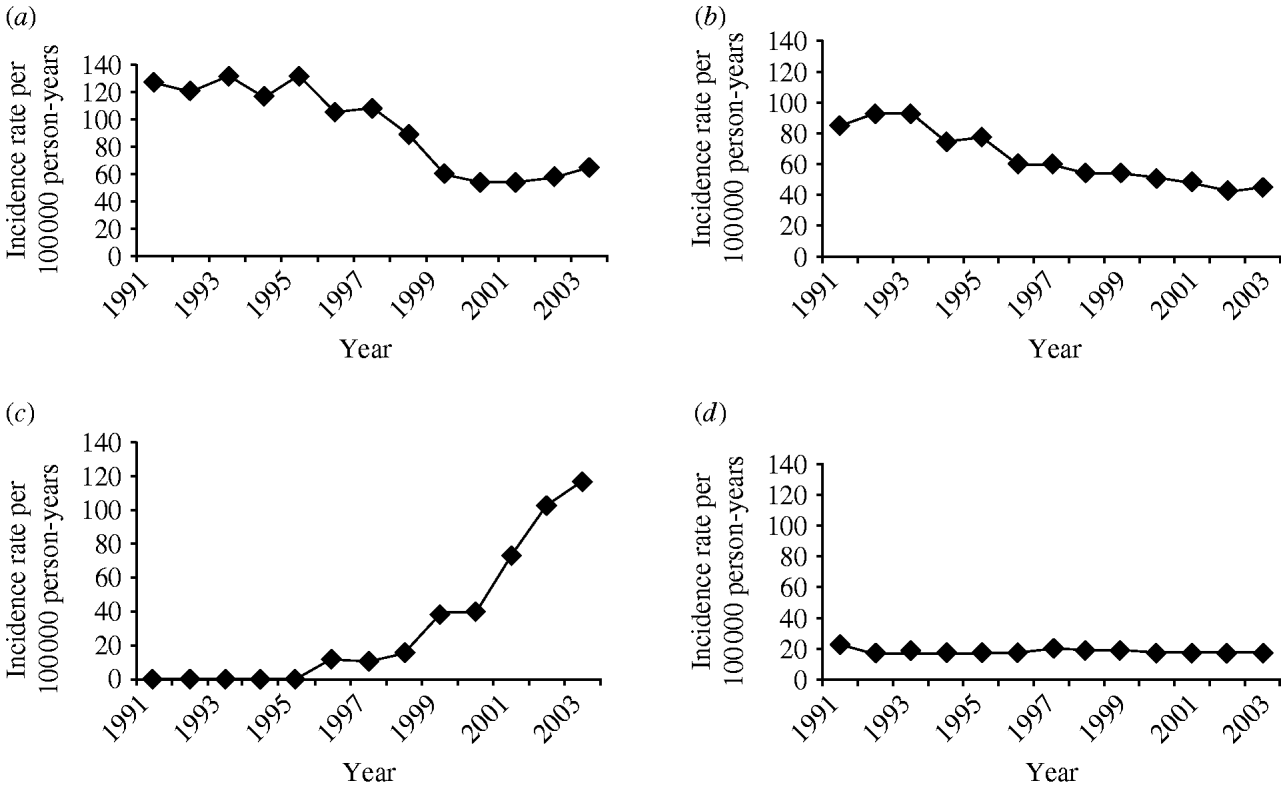
Fig. 4. Trends in pneumonia incidence for individual Read codes, 1991–2003. (a) Pneumonia unspecified; (b) bronchopneumonia unspecified; (c) acute lower respiratory infection; (d) lobar pneumonia.
Table 3. Incidence rate (IR) per 100 000 person-years for top four Read codes (1991–2003), UK general practice population
DISCUSSION
Summary of main findings
Our findings show that the incidence of pneumonia in the general population is currently 233/100 000 person-years and that this remained constant over the last decade. The incidence of pneumonia rises steeply with age in people aged >60 years, and the increase in incidence happens about 5 years earlier in men compared to women. Pneumonia is also common in children aged <5 years. We found evidence of an additional peak in pneumonia incidence in women of childbearing age. The incidence of pneumonia is strongly related to levels of deprivation, particularly in people aged >60 years.
Strengths and limitations of this study
This is the largest and most up-to-date study of pneumonia incidence in a UK general population-based cohort and with 56 332 pneumonia cases this study is almost fourfold greater than the previous largest incidence study (Table 1). The large amount of statistical power in this study has enabled us to derive precise estimates of incidence and to stratify our results by year, age group, gender and deprivation. For this reason we have been able to identify the increase in disease incidence present in women of childbearing age not previously identified. Since our study has used general practice data it is also likely that our findings are representative of the true incidence of pneumonia in the general population.
There are some potential limitations with our study which need discussion. There is potential for overestimation of pneumonia incidence in our study because we used all recorded pneumonia diagnoses. It is possible that a diagnosis may be recorded more than once if the patient re-consults for the same episode of illness. However 79% of our cases had a single record of pneumonia over 13 years so this effect cannot be large. We also conducted a post-hoc sensitivity analysis using varying assumptions of episode lengths (counting any recorded diagnoses within specified days of each other as part of a single episode of illness and therefore a ‘re-consult’. We considered varied episode lengths of 7 days, 15 days and 30 days). Incidence patterns and rates did not change significantly under varying assumptions. Pneumonia incidence (all ages) was 207/100 000 person-years (95% CI 205–209) when an episode length of 30 days was assumed. This changed only slightly with the assumption of a 7-day long episode to 219/100 000 person-years (95% CI 217–221). There is also the issue of the validity of our pneumonia diagnoses, which are based on GP-recorded diagnoses. We did not have information on X-ray findings in THIN in order to confirm our diagnoses, but chest infections are commonly seen in general practice and previous evidence suggests that GP diagnoses of pneumonia are reasonably accurate [Reference Macfarlane16–Reference Macfarlane18]. In addition, a previous validation study showed that codes from routine primary health-care databases in the United Kingdom are a valid tool for identification of pneumonia [Reference Hansell13]. Another concern was the consistency of coding practice over time and to investigate this we looked at the pattern of use of the four most frequently used pneumonia codes. Collectively these four Read codes accounted for 48 960 of the total 56 332 pneumonia cases in our study. Our results show that coding practices have changed over time with a dramatic increase in the use of acute lower respiratory infection from the mid-1990s. The probable explanation for this was a migration in the software coding system from the Oxford Medical Information Systems (OXMIS) codes (which could be mapped onto ICD-8 codes) to Read codes (which map onto ICD-9 codes) which occurred at this time. The OXMIS dictionary was much smaller than the Read dictionary and did not include a code for acute lower respiratory infection. From the mid-1990s when lower respiratory tract infection codes became available, patients presenting with pneumonia-like symptoms seem more likely to be coded as ‘acute lower respiratory infections’ rather than ‘unspecified pneumonia’. Interestingly, the incidence of ‘lobar pneumonia’ has remained stable over the time period of our study, perhaps because this diagnosis tends to reflect more severe cases and would be more likely to have chest X-rays. On the whole, despite the changes in coding practice, the overall pneumonia incidence has remained relatively stable over our study period.
We used an area-based deprivation index as it was not possible to access individual-level deprivation data. Area-based measures assume that individuals within a geographical unit are homogeneous in character and this may not be true. However, Townsend deprivation scores calculated at enumeration district level (about 200 households) have been shown to be good proxy measures for individual-level deprivation measures [Reference Adams, Ryan and White15]. We have calculated Townsend deprivation scores at output area level (about 150 households). Another possible limitation is that we have measured deprivation at a single point in time (using 2001 Census data) on the assumption that an individual would not be moving between deprivation quintiles over our 13-year study period.
Comparison with existing literature
Table 1 summarizes the pneumonia incidence data from different studies, all of which have used different populations and different methods to obtain cases and, therefore, not unexpectedly give differing results. Our findings are most similar to the Spanish studies and Nottingham study when considering similar age groups [Reference Almirall6, Reference Woodhead17, Reference Almirall19], and this is not surprising as the methods used were most similar to the ones used by us. However, our study findings are different to the American and Finnish studies, with our results showing lower incidence rates [Reference Foy, Conney and Allan4, Reference Jokinen5, Reference Houston, Silverstein and Suman20]. One possible explanation for this is that the Seattle study looked at rates of pneumonia during influenza epidemics and actually during non-epidemic periods their rates were similar to ours [Reference Foy, Conney and Allan4]. Interestingly the rates in the population aged >60 years from the Seattle study were smaller than ours, and this may be because the Seattle study used data from a prepaid medical care system that is largely composed of employed people and possibly a smaller but healthier over-60s population.
The studies from Finland and Minnesota have two important methodological differences as well. First, both included hospital diagnoses, autopsy diagnoses and diagnoses on death certificates as well as primary-care-diagnosed pneumonia cases [Reference Jokinen5, Reference Houston, Silverstein and Suman20]. This would result in higher case ascertainment thereby increasing incidence rates. Second, when considering hospital-based cases it is difficult to determine the catchment area and thereby, the denominator population precisely. Underestimating the catchment area could result in the higher rates found in these studies.
On the whole, all studies show similar incidence patterns in terms of age, with two age-related peaks for the <5 and >60 years age groups. We also found that the increase in pneumonia incidence by age occurred about 5 years earlier in men than in women. This is in keeping with gender patterns seen in life expectancy statistics [21]. However, our study showed different gender patterns to other studies which have all found a slightly higher overall incidence rate in males. On adjusting for age, however, the incidence was higher in males as expected. Further analysis by gender and age group showed an almost twofold rise in diagnoses of acute lower respiratory infections in females aged 30–39 years. This could be because of higher primary-care consultation rates in females resulting in increased ascertainment of milder pneumonia cases [Reference Kapur22–Reference Campbell and Roland24]. Alternatively, it is possible that women in this age group are exposed to a greater risk of chest infections from their children thereby resulting in an actual increase in chest infections among this group.
None of the other incidence studies looked at pneumonia incidence in relation to deprivation. In our study, pneumonia incidence increased with increasing levels of deprivation. This is consistent with other study findings that socioeconomic deprivation measured by the Townsend index is a significant predictor of hospital admissions from respiratory diseases [Reference Walters, Phupinyokul and Ayres25]. The presence of a socioeconomic gradient in the elderly with regard to respiratory disease has been debated [Reference Farr26–Reference Farr29]. One of our interesting findings was the interaction of deprivation with age and we observed a marked socioeconomic gradient in those aged >60 years. Further analysis showed that the gradient was primarily seen in the very elderly in the >80 years age group (post-hoc data analysis; results not presented).
Implications
Our study showed pneumonia incidence rate in the UK general practice population is currently 233/100 000 person-years. This is lower than that quoted in the British Thoracic Society guidelines [Reference Macfarlane and Boldy2], but still suggests that an average GP practice with 10 000 registered patients could expect about 23 cases of pneumonia in a year. Incidence rates remained fairly stable over our study period and no perceptible trends were noted. We observed a slight upward trend in incidence from 2000 to 2003 which may reflect changing in coding practices. Nevertheless, it would be worth monitoring future trends given recent evidence of increase in pneumonia hospital admissions in England [Reference Trotter30]. The pneumococcal vaccine for older people (>65 years) was introduced in a phased manner from August 2003, and since September 2006, the revised childhood immunization schedule came into effect, and includes a pneumococcal vaccine for infants at 2, 4 and 13 months [Reference Pebody31]. Our study provides methodology and baseline data which can be used to evaluate the impact of the pneumococcal vaccination policy on pneumonia incidence in the future. In addition, future research should investigate whether the pneumococcal vaccine for older people has had any impact on health inequalities and decreased the socioeconomic gradient observed for pneumonia incidence.
ACKNOWLEDGEMENTS
The authors thank the Epidemiology and Pharmacology Information Core for providing data from the THIN database. The study was funded by the British Lung Foundation.
DECLARATION OF INTEREST
None.


