Introduction
The measurement of crystal-orientation fabrics and textural parameters such as crystal size and crystal elongation is imperative in order to comprehend the chemical signals from ice cores as well as the dynamical behavior of ice sheets. Continuous detailed fabric analysis along an ice core, however, has not been performed so far because the fabric analysis by conventional methods with a universal stage (Reference LangwayLangway,1958) is such a time-consuming and laborious process. Although several attempts (Reference Morgan, Davis and WehrleMorgan and others, 1984; Reference Mori, Hondoh and HigashiMori and others, 1985; Reference LangeLange, 1988; Reference Langway, Shoji and AzumaLangway and others, 1988; Reference EickenEicken, 1993; Reference Anandakrishnan, FitzPatrick, Alley, Gow and MeeseAnandakrishnan and others, 1994) at more rapid and easier measurement of ice fabric have been made over the last few decades, up to now no suitable device for automatic individual crystal recognition and orientation determination has been developed.
The main objectives of this study are to develop an automatic ice-fabric analyzer and to obtain new measurements of ice fabric and texture, which can be applied to ice-core studies. In this paper a theory of automated determination of crystal size and orientation that is based on the optical method is described. The results of textural studies on an ice core using this device are presented elsewhere in this volume (Reference AzumaAzuma and others, 1999).
Method and Device
Theoretical basis of the extinction method
An individual crystal in a thin section of ice placed between a pair of crossed polaroids can be distinguished by its colour and brightness. The colour and brightness of each crystal depends on the ,-axis orientation of the crystal. When the crossed polaroids are rotated, the brightness of each crystal changes without a change of color. A minimum brightness for an individual crystal appears at every 90° interval during the polaroids rotation. This minimum-intensity position is called "extinction" and is used to determine the .-axis orientation by the conventional method (Reference LangwayLangway, 1958). Using a charge coupled device (CCD) camera linked to a personal computer (PC), we obtain four extinction angles for each individual crystal with respect to one camera position. Next we incline the camera and obtain another set of extinction angles with respect to the inclined camera position for the same crystal. With several sets of extinction angles, the c axis of individual crystals can be determined as follows.
As shown in Figure la, the ice thin section is placed between the crossed polaroids parallel to the horizontal plane. With respect to a CCD camera perpendicular to the thin section, the rectangular coordinate system XYZ is taken so that the X-Y plane coincides with the camera image plane and the Z axis coincides with the lens principal axis. Consider the c axis of a crystal as a unit vector. Its orientation is defined by azimuth (A1) and zenith angle (A2) as shown in Figure lb. Azimuth (A1) is the angle between the X axis and the projection of the crystal c axis on the X-Y plane. Zenith angle (A2) is the angle between the Z axis and the c axis. Take another coordinate system, X’Y’Z’ with respect to the inclined camera position. This coordinate system is obtained by rotating the X-Y plane a° on the Z axis to get XPYPZP and then rotating YPZP through ³° on the XP axis (Fig. lc). a and 7 are taken positive if rotated counterclockwise. Then a parallel transformation (u,v,w) of XPYPZP gives the system X’Y’Z’. The transformation between XYZ and X’Y’Z’ can be written

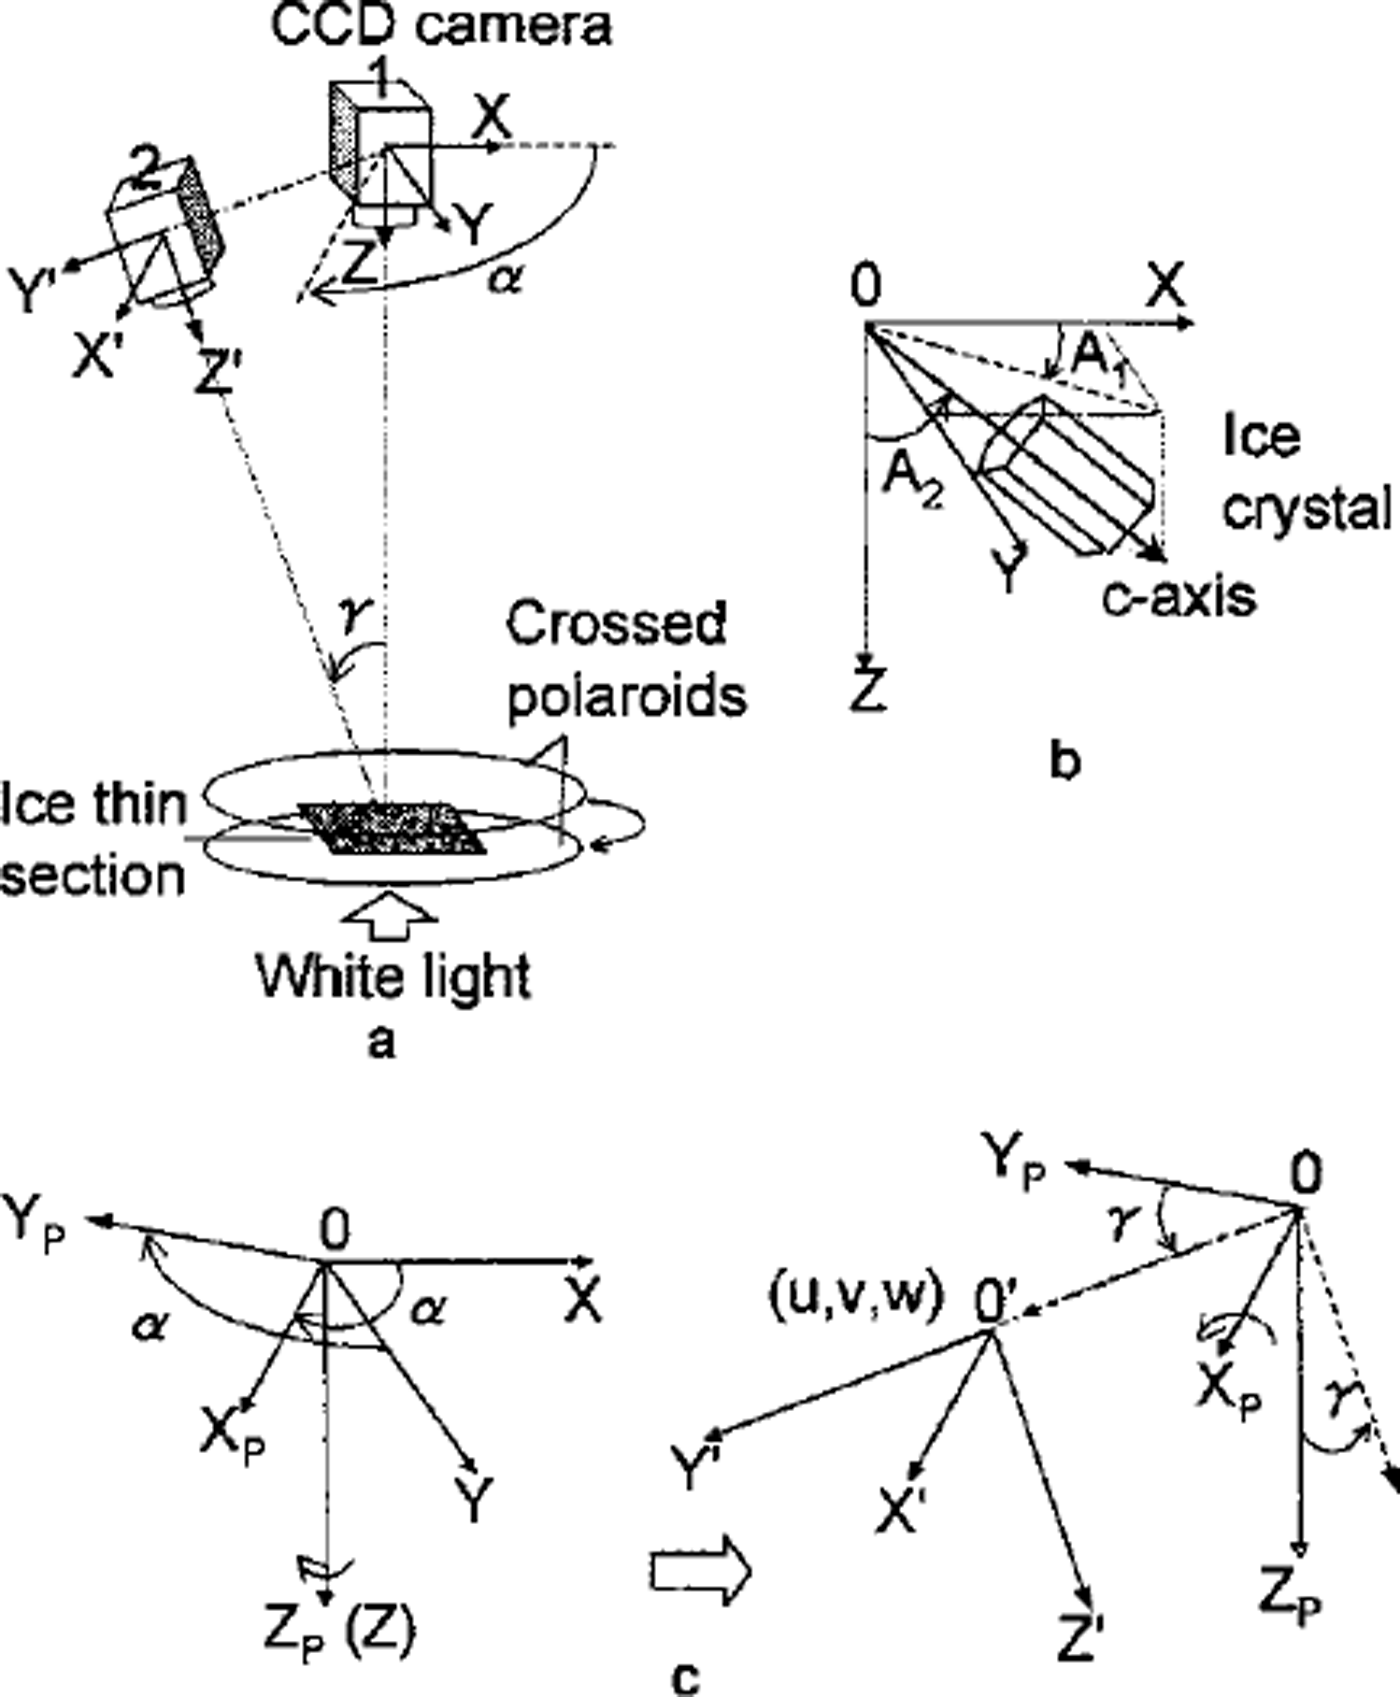
Fig 1. Definition of c-axis orientation and camera coordinates. (a) The coordinates of camera positions; (b) the azimuth and zenith angle of a c axis; ( c) the transformation of the different camera coordinates.
Hence, when we observe from the inclined camera a c axis with A, and A2 in the XYZ coordinates, the orientation of the c axis is given with A,’ and A2’ in the 0-XP’YP’ZP’ co-ordinates as

From Equation (2) we obtain

If we obtain several values of A,’ from several camera positions with different sets of a and 7, the values of A! and A2 can be determined theoretically by Equation (3). Note that the value of 7 for the calculation is not the actual inclination angle. It must be corrected for the refraction, which occurs when light passes between crystal and air. The refraction index of ice is n = 1.31, found from Snell’s law (Reference KambKamb, 1962):
where 7 is the angle of incidence with respect to the plane of the thin section, and 7’ is the angle of refraction in the ice. In this study, all calculations of the ,-axis orientation with the basic Equation (3) use the corrected inclination 7’.
At the initial position, the vibrating direction of the polarizer/analyzer is taken parallel to the X axis. Extinction is obtained when the vibrating direction of either the polarizer or the analyzer coincides with the c axis of individual crystals. Thus A, and A,’ can be written as

Here 9 and 9’ are the rotation angles of the polarizer/analyzer from the initial position and 1 is one of 0, 1, 2 or 3. Equation (3) becomes

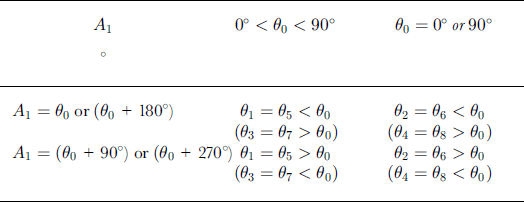
We use a least-mean-squares approximation method to calculate the extinction angle from the profile of gray-value data for individual crystals with respect to the rotation of the crossed polaroids at steps of 2°. Using eight inclined camera positions (Table 1), the value of 1 can be determined by comparison of the extinction angles (θ1 to θ8) as shown in Table 2. In Table 1, 90 is equivalent to 9 in Equation (6), and 91 to 98 are equivalent to 9’ in Equation (6). When 9 = 0° or 90°, Equation (6) cannot give a single solution of A,. We solve this problem by using the comparison shown in Table 3. In this case A, and A,’ become:

Table 1. Camera positions according to camera rotation a and inclination ϒ
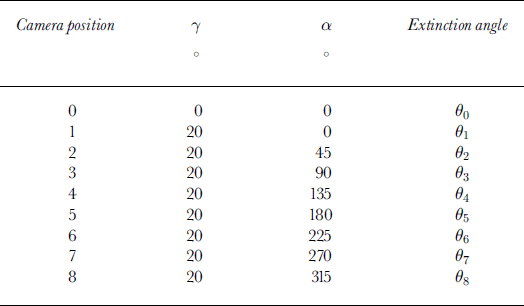
Table 2. Comparison of the extinction angles to determine the value of i in Equation (5)

Table 3. Comparison of the extinction angles to determine the value of i in Equation (5), if θ in Equation (5) is 0° or 90°

When the c axis lies on the X-Y plane (A2 = 90°), the difference between two extinction angles in Table 2 or 3 becomes zero. In this case, we can determine the .-axis orientation by using the condition presented in Table 4.
Table 4. Determination of the c-axis orientation normal to the vertical axis
The Automated Analysis System
Hardware
As shown in Figure 2, the hardware of the system consists of three sections: a measurement section, a control-box/interface and a PC. The measurement section is set up in a cold room. The device is controlled via a control-box/interface by the PC outside the cold room.
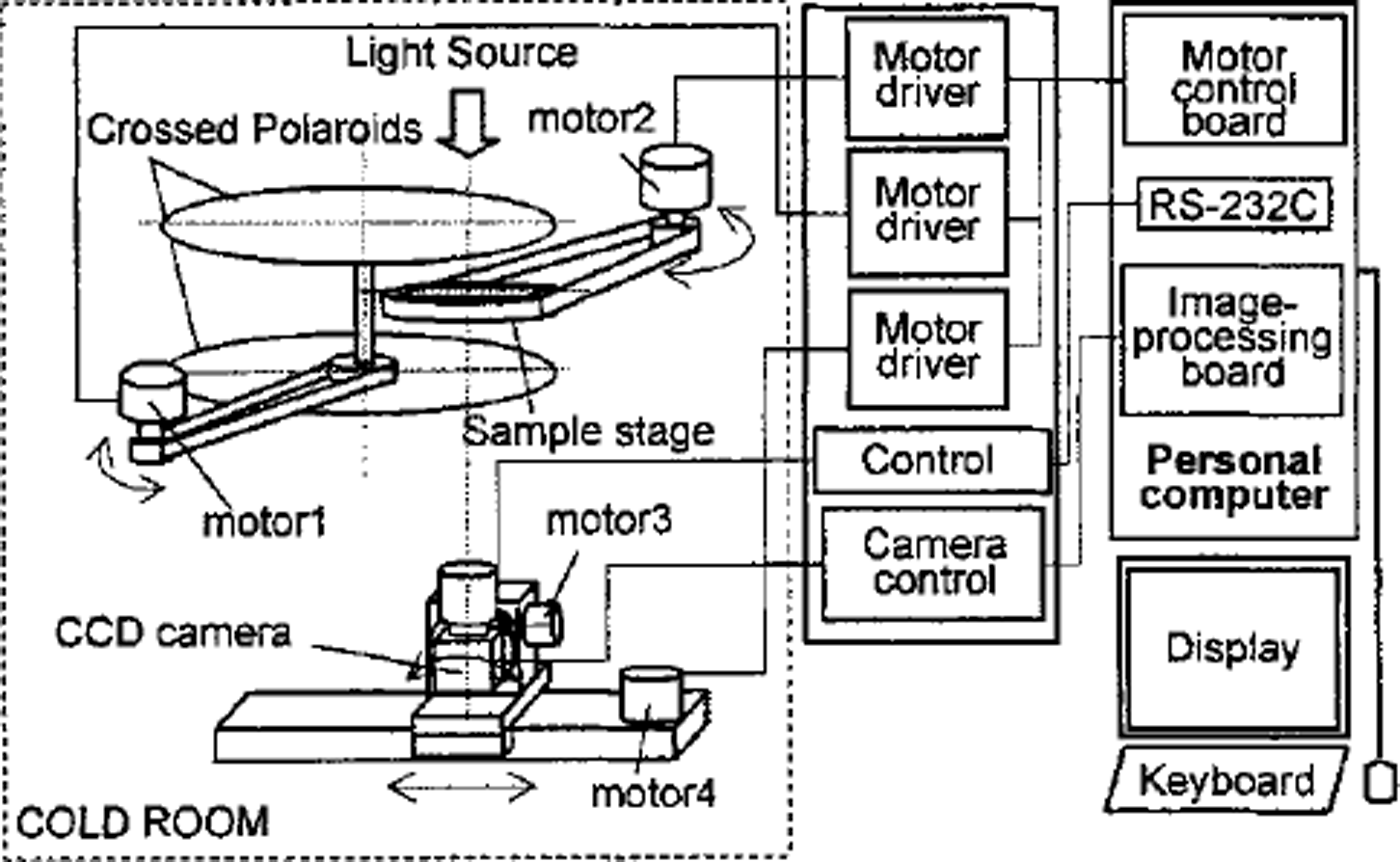
Fig. 2. Schematic diagram of automated system.
The measurement section consists of four major components: (1) a sample stage which can be rotated by a stepping motor, (2) a pair of crossed polaroids (transmissivity 0.0012%) which can be rotated by a stepping motor, (3) a CCD camera (Toshiba IK-C41MF) mounted on a stepping-motor-controlled rotation stage which is mounted on a stepping-motor-controlled slide stage, and (4) a homogeneous scattered-white-light source. The rotation of the sample stage produces the rotation angle a. The tilt angle 7 is produced by a combination of the rotation and the sliding of the CCD camera controlled by two stepping motors.
The control-box/interface comprises the motor drivers, camera control unit and power unit. A motor control board (HLS-PPD234W) and an image-processing card (Integral Technologies, FlashPointl28) are installed in the PC operated under Windows NT.
Software
In order to fulfil the automated procedures, a program performs the analysis. The program uses the functions of commercial image-processing software (Media Cybernetics: Image-Pro) to perform the image digitization and filtering operations and to measure several crystal textural parameters such as grain-size.
The procedure of the automated analysis program is shown in Figure 3a:
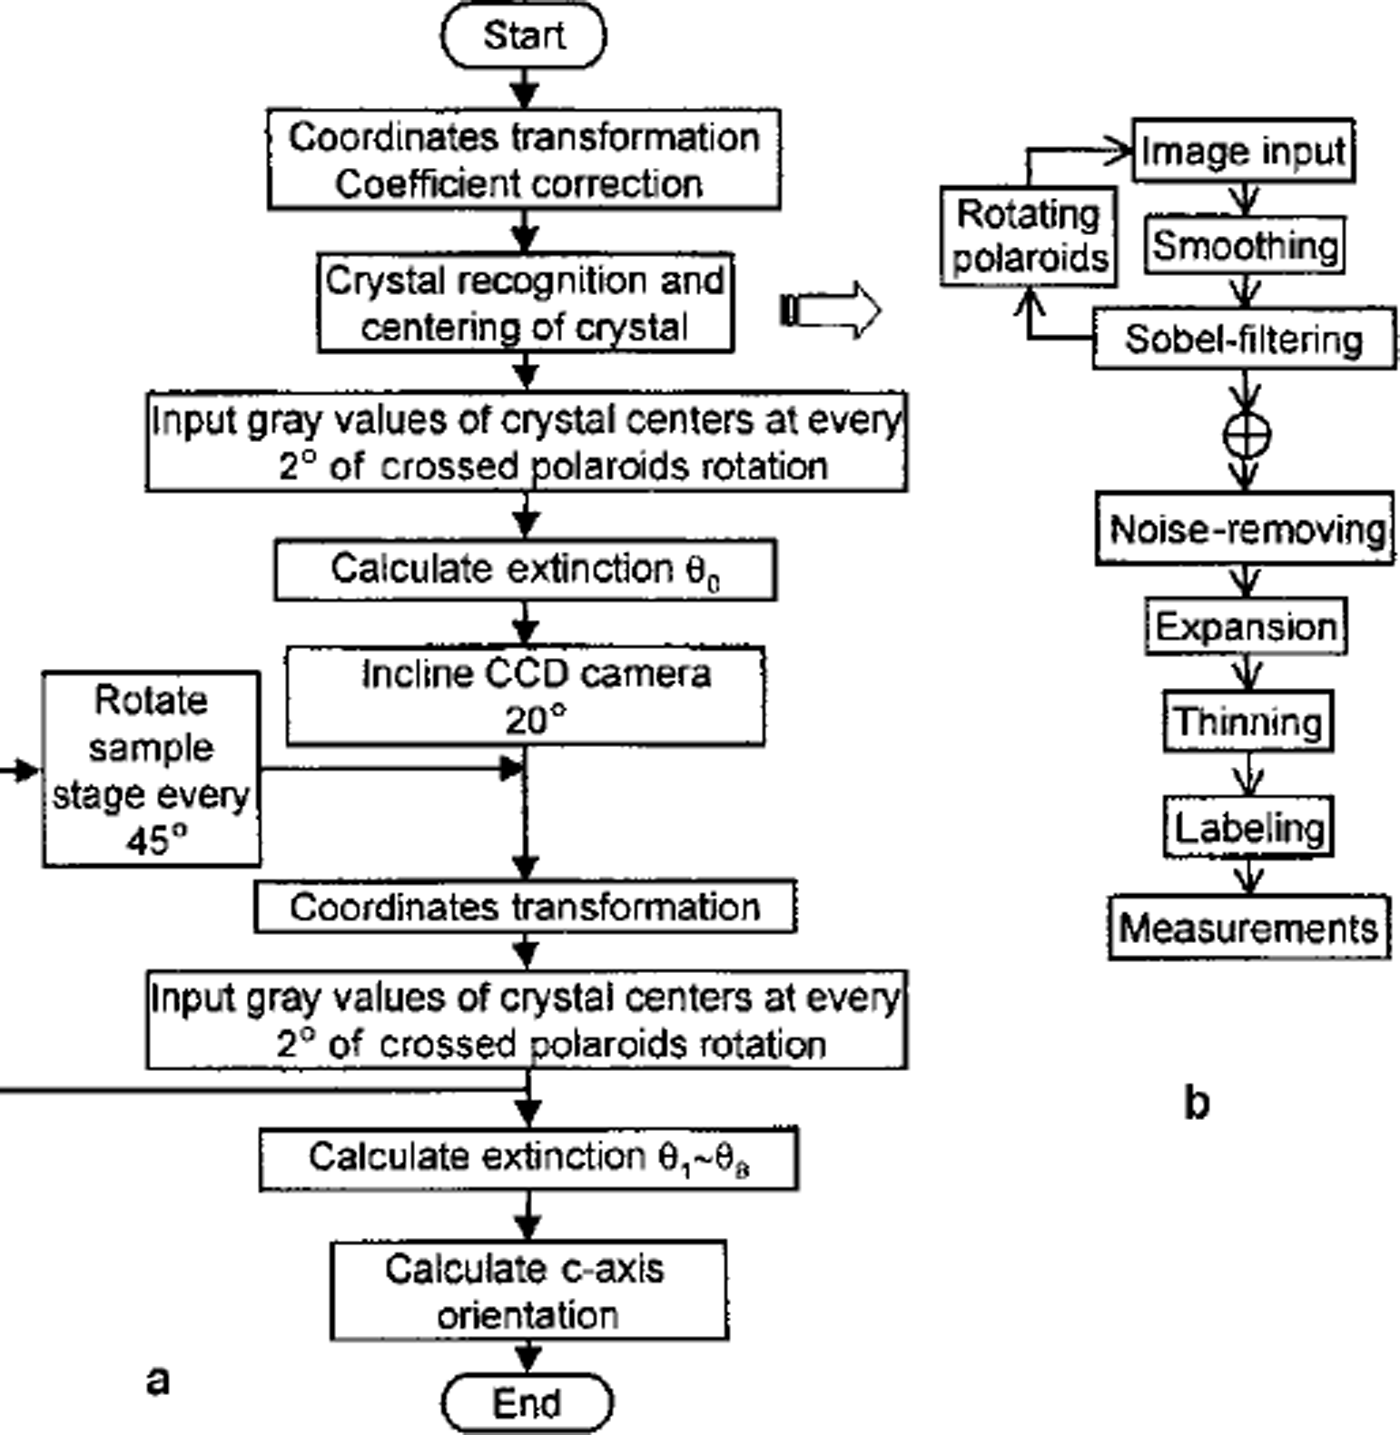
Fig. 3. Flow charts of (a) the automated fabric-analysis program and (b) the pre-processing to distinguish crystals.
Step 1:
To keep measuring the same crystal from different CCD camera observation positions, a coordinate transformation between the vertical observation position and each inclined camera position is executed. Coordinate transformation indexes are saved as calibration data files. Details are described below.
Step 2:
While the crossed polaroids are rotated every 5°, images of samples are taken at the vertical CCD camera observation position to recognize individual crystals and finally to measure the textural parameter according to the steps shown in Figure 3b.
Step 3:
While the crossed polaroids are rotated every 2°, the gray values of 3 x 3 pixels around the center of each crystal are measured at the vertical CCD camera observation position. The intensity data are saved as data files.
Step 4:
The CCD camera is inclined an angle of 20° and moved on the slide to keep taking the same field of view (35 mm diameter).
Step 5:
By using the coordinate transformation indexes obtained in step 1, coordinates of the centres of individual crystals at the inclined camera observation position are calculated.
Step 6:
The same as step 3: the gray values around the center of each crystal are measured at the inclined camera observation position.
Step 7:
The sample stage is rotated at 45° intervals, between two of which steps 5 and 6 are repeated.
Step 8:
The intensity data of each crystal are approximated to a six-term polynomial function with a least-squares error algorithm. The extinction angles of individual crystals are calculated at every CCD camera observation position by solving for the minimum of the functions over the range of 9 from 0° to 90°. Thus, for each crystal nine extinction angles, i.e. 9e0 to 9e8, are obtained.
Step 9:
The quadrantjudgement is carried out by using the nine extinction angles according to Table 2, 3 or 4 for each crystal. Then the azimuth and zenith of each crystal c axis are calculated.
The camera coordinate transformation is necessary in order to keep measuring the same grain at all camera positions. We consider that there are n positions indicated by (Xi,Yi) (i = 1 to n) in the O-XYZ coordinates. If we transform these positions into (Xi’,Yi’) in the 0-XP’YP’ZP’ coordinates, the positions (Xi’,Yi’) are given by the equation
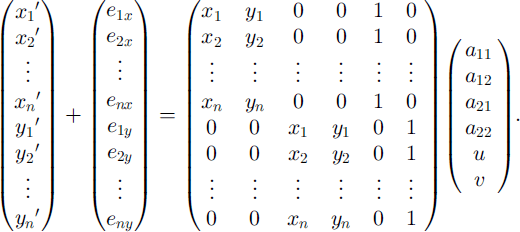
More generally,
where e is error and a is the transformation coefficient vector. We determine a by the least-mean-squares approximation method using the equation
If we take a large number of positions (i.e. large n), the error e becomes small, i.e. we can obtain a more accurate value for a. We therefore set a transparent sheet marked with 256 dots on the sample stage and input the coordinates of the dots at all camera positions in order to calculate the transformation coefficients. It was found that the accuracy of the transformation is better than 0.7 mm under the present magnification with 0.072 mm/pixel.
Results
Ice-core samples from Dome F, Antarctica, have been analyzed with this system. Vertical thin sections 10 cm long, 5 cm wide and 0.5 mm thick were prepared, as outlined by Reference LangwayLangway (1958). Detailed results are described elsewhere (Reference AzumaAzuma and other, 1999). In order to verify the automated method we also measured the ,-axis orientation fabrics of several thin sections manually by the universal stage method and compared the results with those measured automatically. Figure 4a and b show the measured ,-axis orientation data plotted on a Schmidt net by the automated method and the universal stage method, respectively. There are several cases in which the automatic method was unable to determine a ,-axis orientation:
-
(1) When the c axis is nearly parallel to the Z axis, the crystal remains dark while the crossed polaroids rotate at the camera position O. As a result, the extinction angle 90 cannot be determined exactly.
-
(2) If the crystal size is <0.5 mm, the accuracy of following the center of the crystal by coordinate transformation decreases. As a result, a wrong position in a neighboring crystal or on a grain boundary may be measured at different camera positions. Then Equation (6) gives no solution.
-
(3) When the value of i in Equation (6) determined by the set of even-number extinction angles (92,94, 96,98) is not in agreement with that determined by the set of odd-number extinction angles (91,93,95, 97), the ,-axis orientation cannot be determined. This may be due to noise when the gray value is measured.
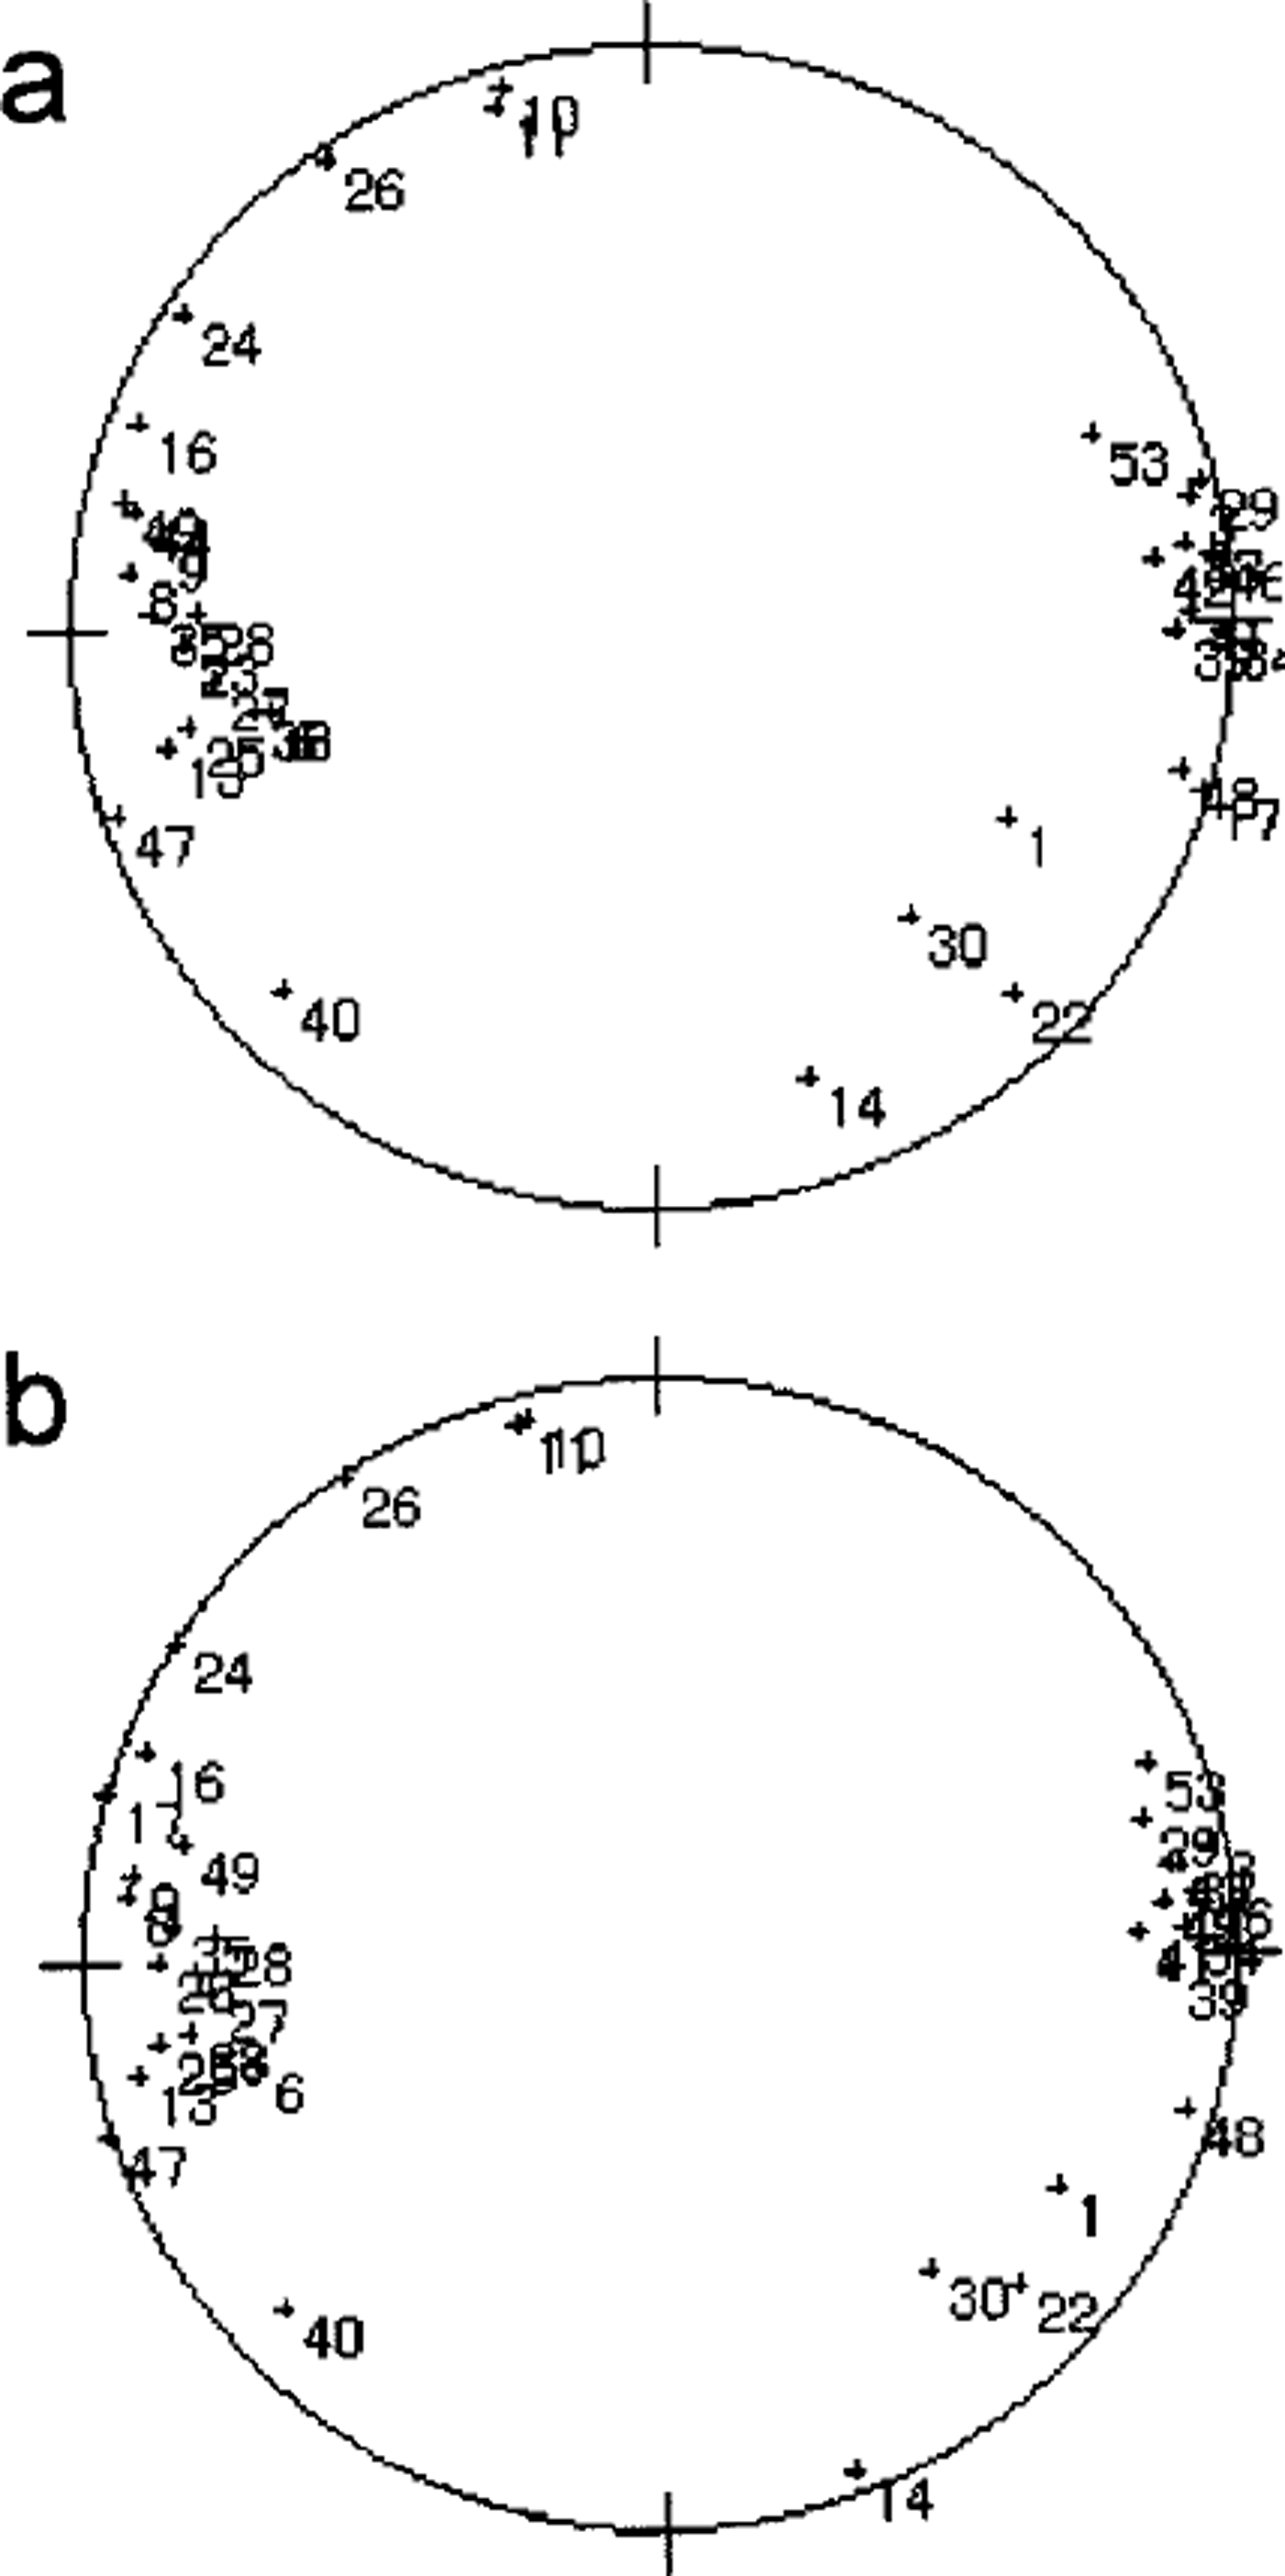
Fig. 4. Fabric diagrams on a vertical thin section from Dome Fuji ice core at 1800 m depth (a) by the automated method and (b) by the universal stage method. The number by each dot designates each crystal’s label number.
We have devised an algorithm to provide a null solution when the machine is faced with any of the above cases. Except where crystals fall into the above categories, the two fabric plots are in good agreement.
A sample of artificial ice with near-random .-axis orientations was measured by the automated system and with the universal stage. Figure 5 shows good agreement between the two fabric plots. To assess quantitatively the difference between the two measurement techniques, the angular difference between the ,-axis orientations measured with the automated system and those measured with the universal stage was calculated for every crystal in the two artificial ice samples. A histogram of the ,-axis misorientation angles is shown in Figure 6. It is seen that a misorientation angle of about 5° is predominant. The reason is discussed below.
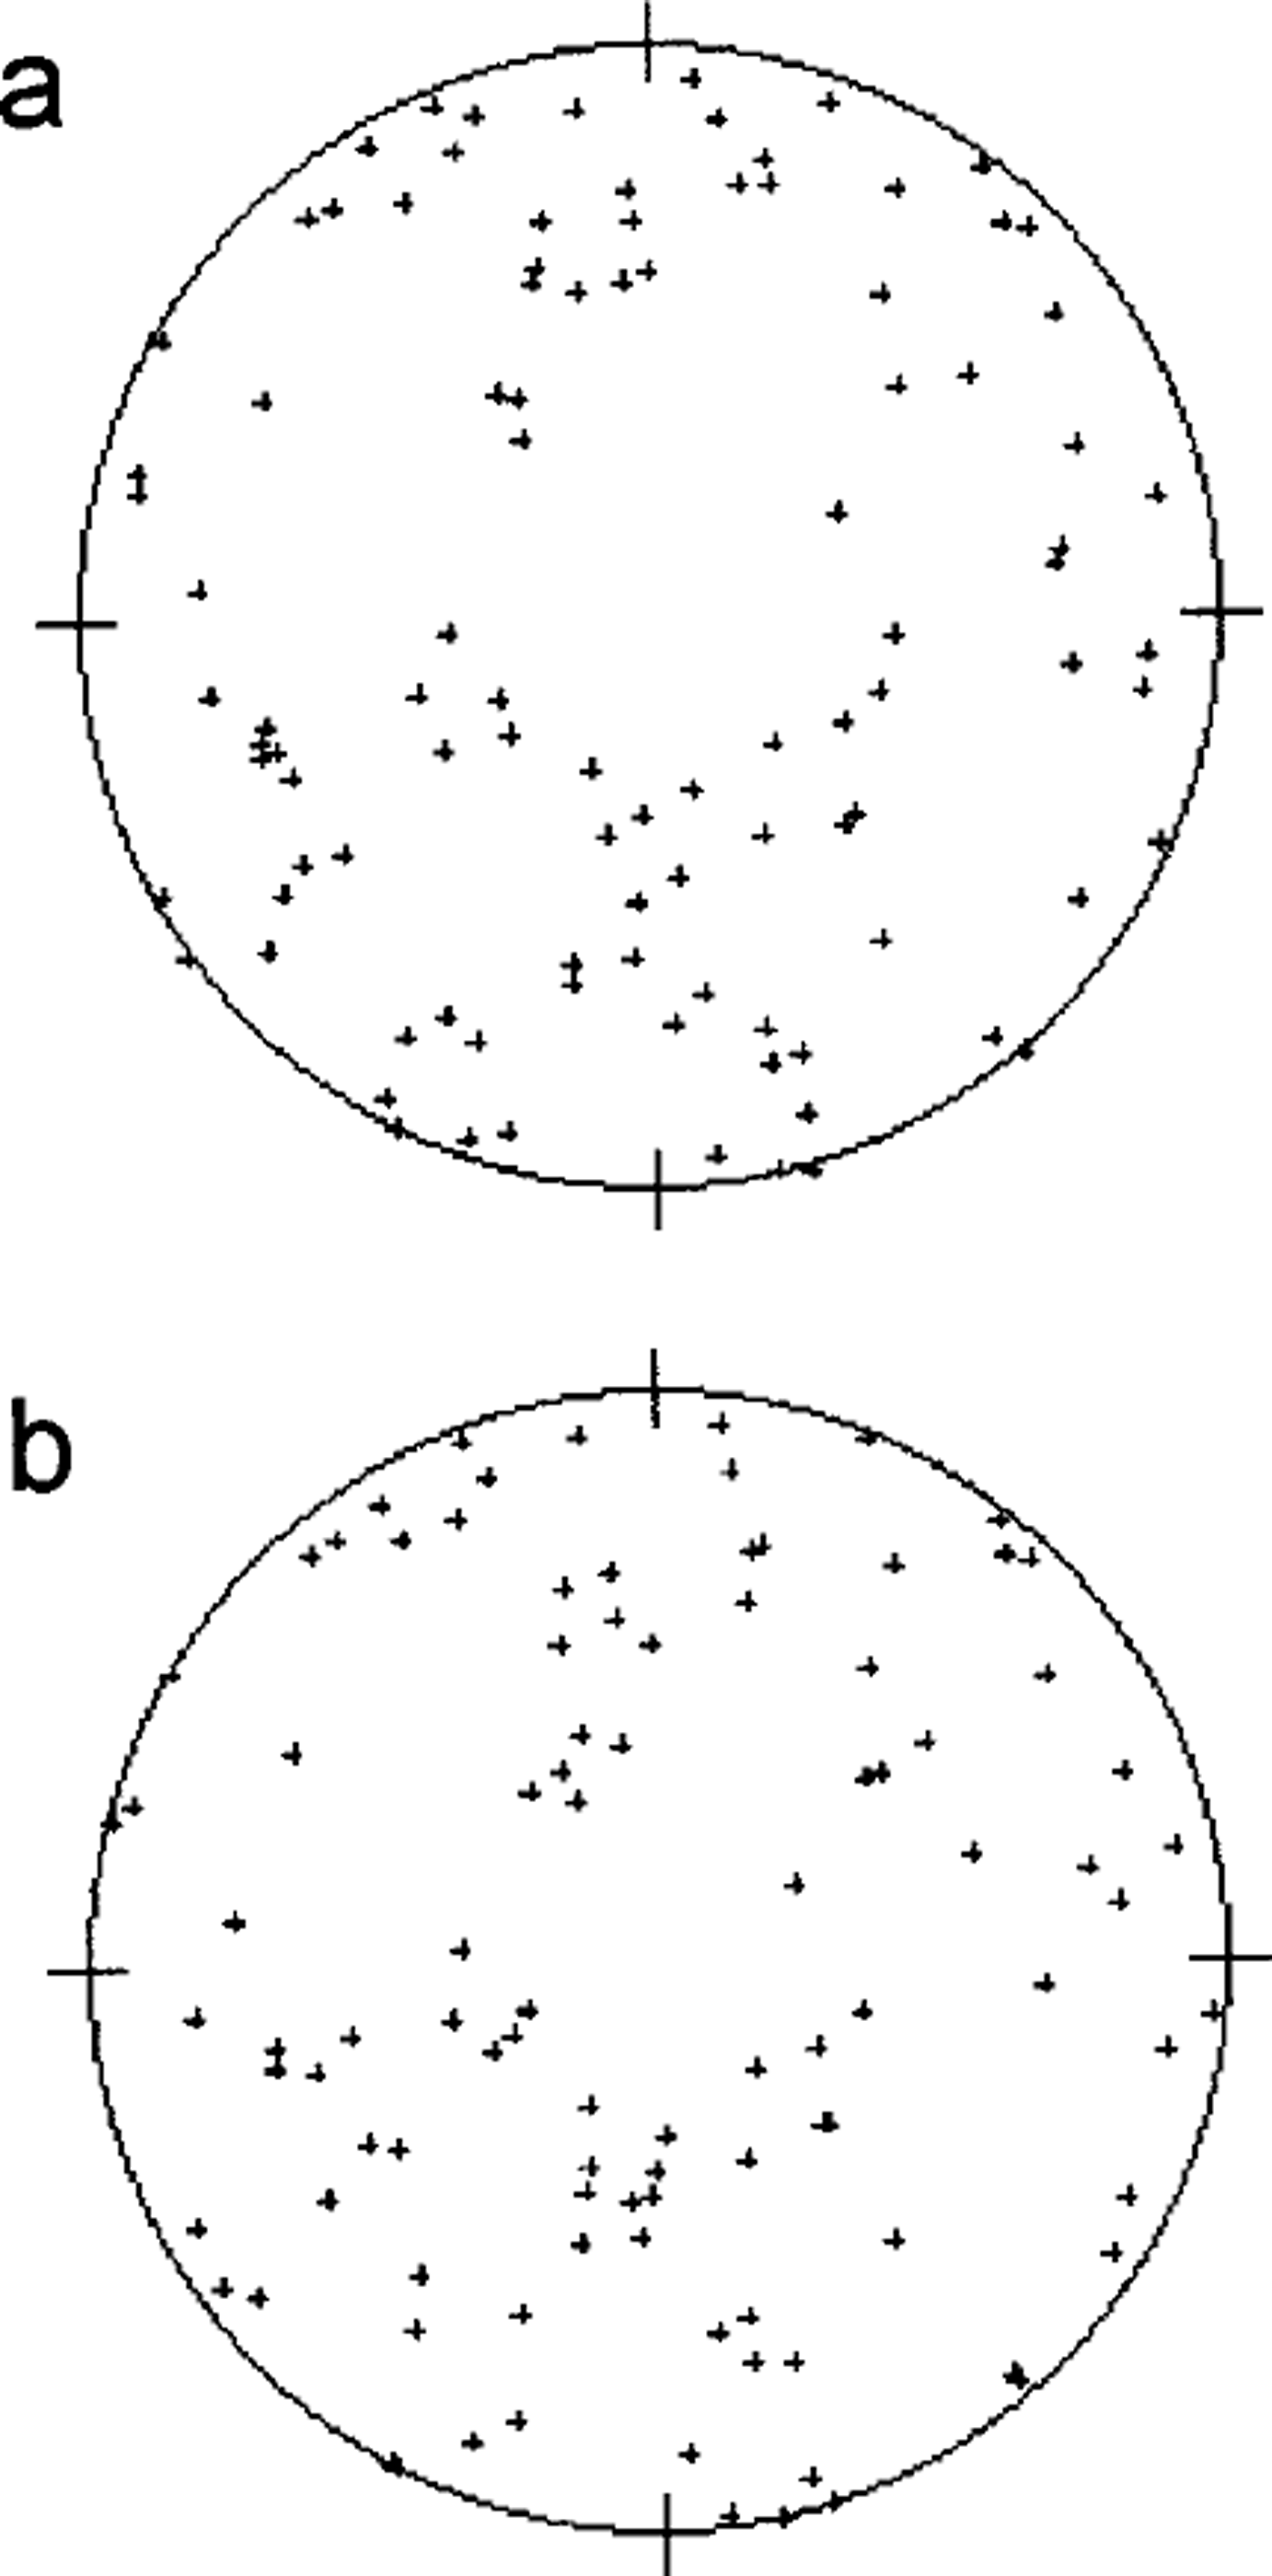
Fig. 5. Fabric diagrams on an artificial-ice thin section (a) by the automated method and (b) by the universal stage method.
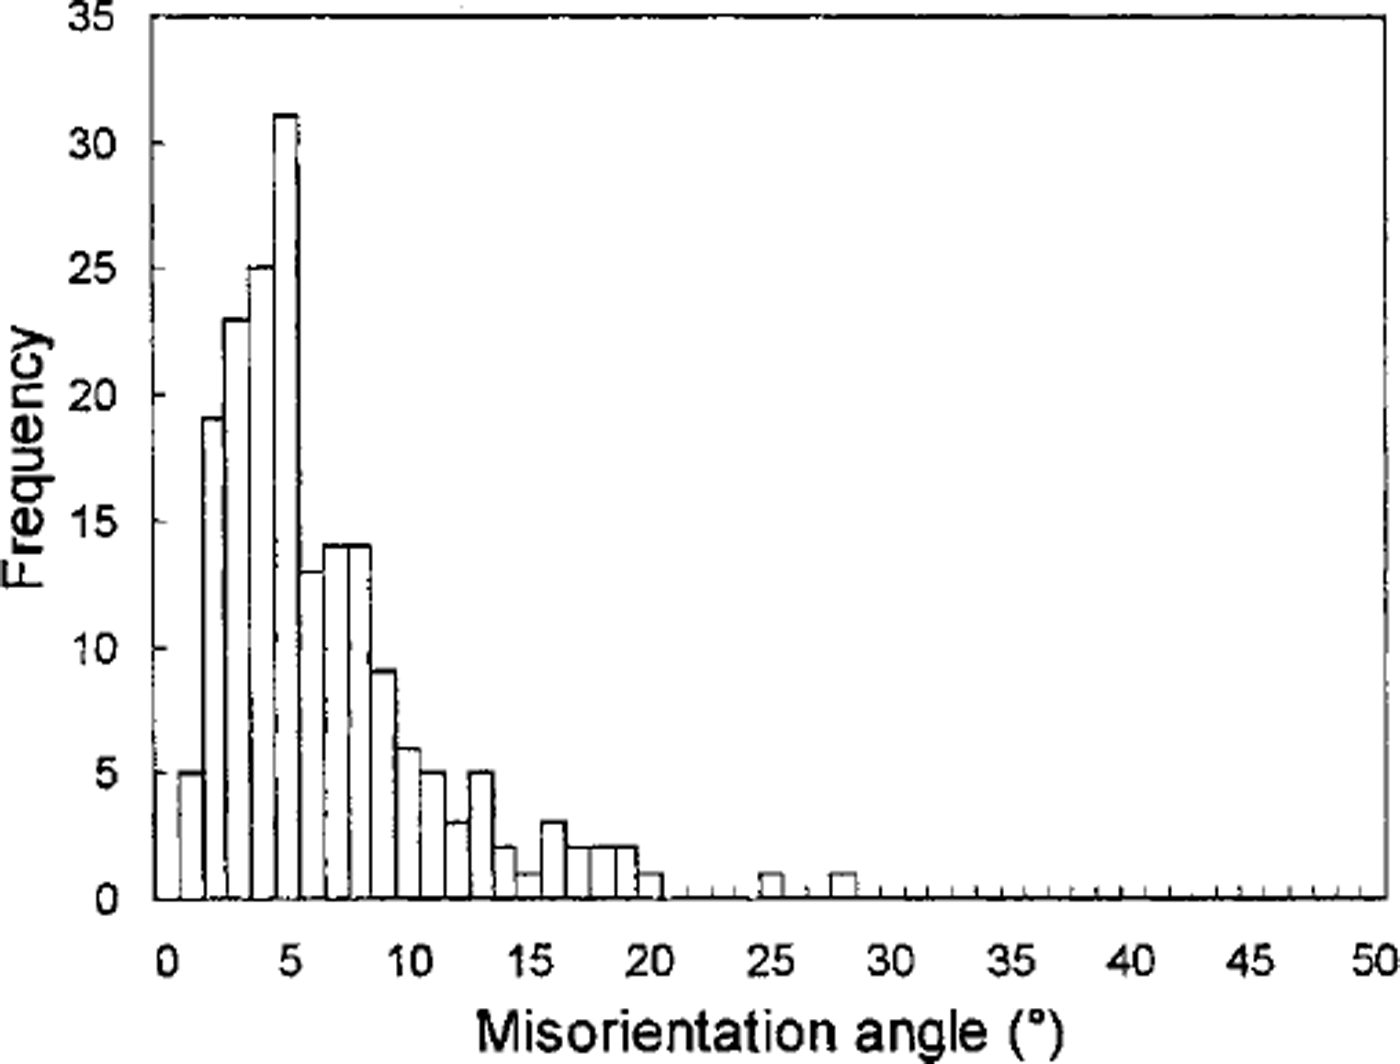
Fig. 6. Histogram of the misorientation angle between the c-axis orientations obtained by the automated method and by the universal stage method.
Accuracy of the c-Axis Orientation Measurement of the Automated System
One way of assessing the accuracy of the automated analysis is to investigate the reproducibility Five times, we measured the ,-axis orientations of 220 crystals within the two samples referred to above and calculated the resultant vector for each crystal, which is obtained by summing all five ,-axis unit vectors. The deviation angle from the orientation of the resultant vector was obtained for each ,-axis measurement. The histogram of the deviation angles is shown in Figure 7. It was found that the reproducibility is better than 1°.
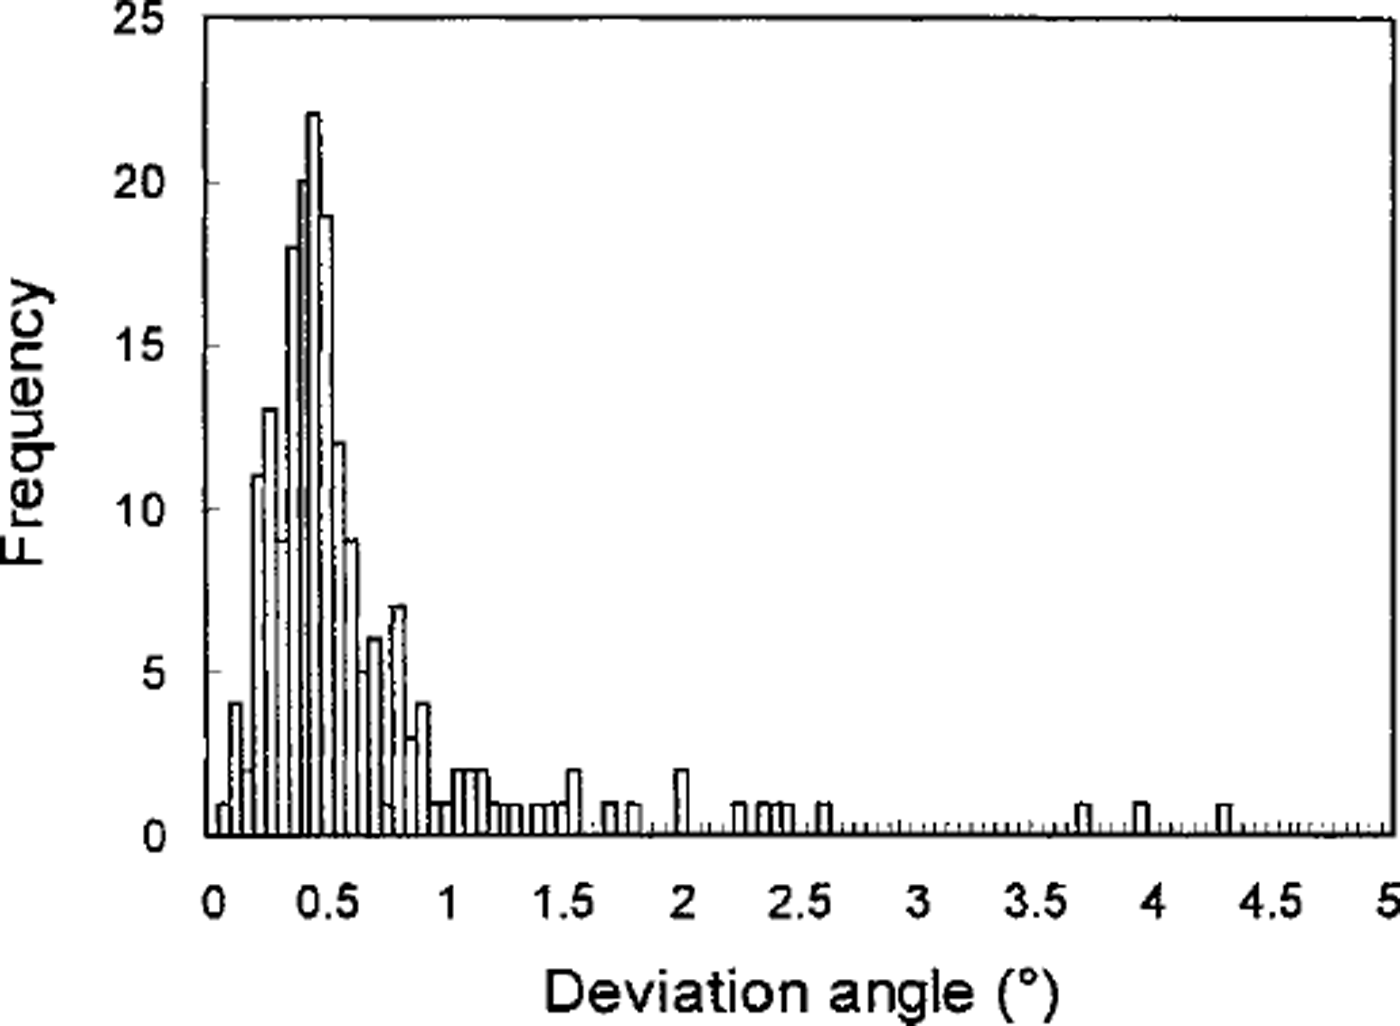
Fig. 7. Histogram of the reproducibility of the results by the automated method.
In addition, the accuracy of the automated system can be evaluated by the accuracy of each value of azimuth and tilt, because the ,-axis orientation is defined by azimuth and tilt. As stated above, the azimuth is determined from the extinction angle obtained by the vertically positioned camera. Therefore, the errors in azimuth measurement are the errors in the extinction-angle measurement, which mainly result from the fluctuation and instability of the crossed-po-laroids rotation motor, gray-value measurement, and approximate solution of the extinction angle from the gray-value data profile. The accuracy provided by the manufacturer for the motor rotation angle is within 0.05°. However, the fluctuation of the gray values caused by bubbles, noises and camera and light-source irregularity is difficult to estimate. Since we use the bisection method on the mean-square approximation curve of gray values to solve the minimum/maximum gray value, the extinction angle can be determined accurately without being affected by the fluctuation of the gray values. We cannot know all the inaccuracies of the above components contributing to errors in azimuth measurement. Further, the components are not independent of each other. As these errors can be considered as random, the estimate we obtain of total error by repeat measurements is empirical. In the reproducibility experiment, the standard deviation
![]() of the five azimuths for each crystal was calculated as 0.17°. Generally, we quote ±2s as the measurement error, i.e. a single measurement has a 95% probability of lying within ±2s of its average result. Thus, we can say the accuracy of the azimuth is ±0.34°.
of the five azimuths for each crystal was calculated as 0.17°. Generally, we quote ±2s as the measurement error, i.e. a single measurement has a 95% probability of lying within ±2s of its average result. Thus, we can say the accuracy of the azimuth is ±0.34°.
On the other hand, since the zenith is a computed quantity, we cannot use the same method to obtain the inaccuracy of the azimuth (extinction angle). The zenith A2 is a function of azimuth A1, azimuth A,’ observed from the inclined camera position, stage rotation a and camera inclination ³. That is,
The inaccuracy of A2 expressed as αA2 can be obtained by the root-sum-square formula
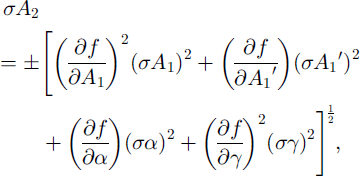
where σAx, σ A’1, σα and a1
are the errors in A1 , A’1 , α and ³, respectively. σA1
can be taken as ±2s
![]() obtained above. Similarly, σA’1
can be considered the same as the error in the extinction angle observed from the inclined camera position. As for σα, it comes from the error of the stage rotation motor provided by the manufacturer, i.e. ±0.05°. The error of camera inclination σ³ is due to the inaccuracy of the inclination motor, ±0.2°. Let us consider here only the case of a c axis which exists in the first quadrant (0° < A1 < 90°), because a similar result can be obtained in other quadrants. Using Equations (3), (11) and (12), we calculate the error σA2
of the zenith angle A2
with various sets of A! and A2.
Figure 8a and b are the calculated results using the A,’ value obtained by the inclined camera positions 1 and 3, respectively. Where camera position 1 is used, σA2
is <2° over the A, range smaller than 70°. Where camera position 3 is used, we can make σA2 <2° over the Ax
range larger than 20°. In other words, by choosing the most suitable inclined camera position to obtain A’1 we can reduce the error σA2
of the zenith angle A2
to within 2° for any range of Ax
and A2
obtained above. Similarly, σA’1
can be considered the same as the error in the extinction angle observed from the inclined camera position. As for σα, it comes from the error of the stage rotation motor provided by the manufacturer, i.e. ±0.05°. The error of camera inclination σ³ is due to the inaccuracy of the inclination motor, ±0.2°. Let us consider here only the case of a c axis which exists in the first quadrant (0° < A1 < 90°), because a similar result can be obtained in other quadrants. Using Equations (3), (11) and (12), we calculate the error σA2
of the zenith angle A2
with various sets of A! and A2.
Figure 8a and b are the calculated results using the A,’ value obtained by the inclined camera positions 1 and 3, respectively. Where camera position 1 is used, σA2
is <2° over the A, range smaller than 70°. Where camera position 3 is used, we can make σA2 <2° over the Ax
range larger than 20°. In other words, by choosing the most suitable inclined camera position to obtain A’1 we can reduce the error σA2
of the zenith angle A2
to within 2° for any range of Ax
and A2
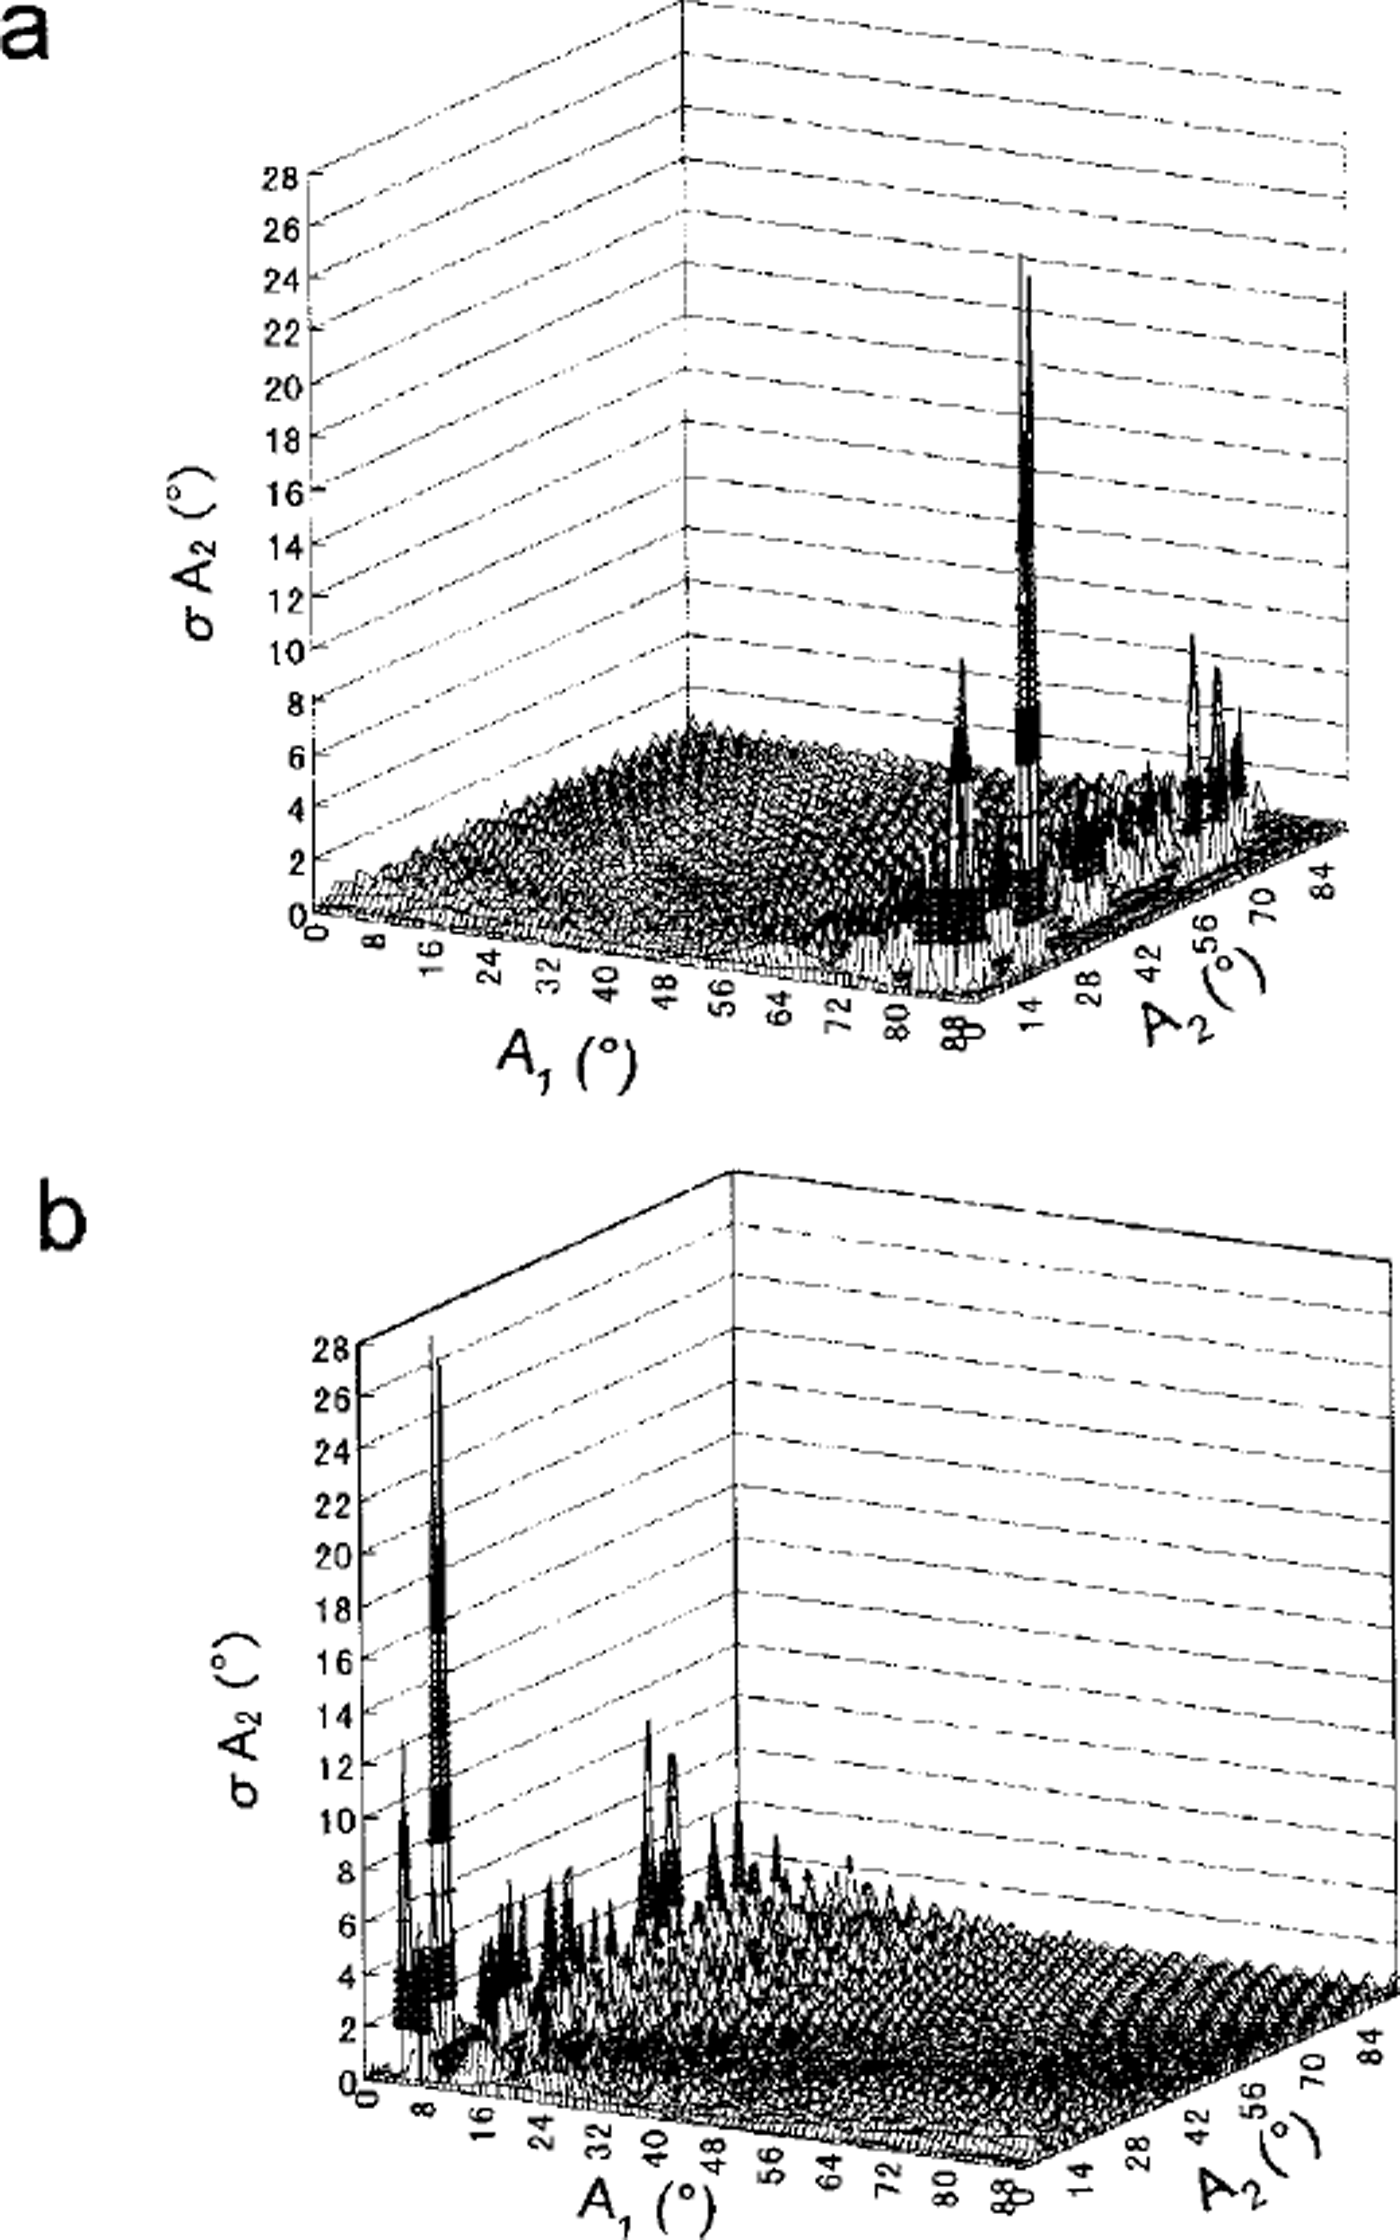
Fig. 8. Calculated errors σA2 using A1 obtained (a) by the inclined camera position 1, and ( b) by the inclined camera position 3.
Compared with the accuracy of the automatic device (σA1 ≤ ± 0.34° and σA2 ≤ ± 2°) stated above, the accuracy of the universal stage is considered to be ±5° (Reference LangwayLangway, 1958) However, the error in the universal stage method is related to the skill of the observer and would be much more than ±5° in some cases. This may account for the misorientation of 10° or 20° evident in Figure 6. In addition, reproducibility when using the universal stage is usually 1-2°, compared with < 1° for the automatic device. It is concluded that the automatic device is more accurate than the universal stage.
Visualization of Fabric and Textural Data
The automated fabric-analysis system can determine individual ,-axis orientations in a thin section rapidly, regardless of the number of crystals. Data are presented for individual crystal specifications (,-axis orientation, crystal size, aspect ratio and crystal-elongation direction) and for bulk thin-section data (Schmidt diagram, median inclination, mean crystal size and mean aspect ratio). In order to investigate regional characteristics of fabric and texture, we propose a method of visual presentations of the thin-section crystal image. The method is to "colorize" the image according to the data, i.e. pseudo-color the image. For example, the ,-axis orientation of each crystal is indicated by a pair of colors. The azimuth angle is given by one color hue that changes as shown in Figure 9a, while the zenith angle is given by the intensity of a color as shown in Figure 9b. The azimuth range (0-360°) is divided into the number of intervals specified (here the division is 5°), and each interval is assigned to a color. The color palette on the left corner represents the entire azimuth. Similarly in Figure 9b the zenith-angle range (0-90°) is divided into 90 intervals, and each interval is assigned a specified intensity of blue color. The crystal with darker tone shows the more parallel ,-axis alignment to the core axis. With this presentation we can see visually individual crystal orientations, local differences in crystal orientation and the relation between crystal shape and crystal orientation. Figure 9c-f show the local mean Schmidt factor, the local mean grain-size, the local mean aspect ratio and the local mean crystal-elongation direction. The local area is defined as an area in which ten crystals are included. In this figure the Schmidt factor is defined as
where 0 is the angle between each c axis and the core axis. Hence, Figure 9c indicates that the red color region can deform easily with respect to the axial compression, while the blue colour region is hard to deform. Aspect ratio is the ratio of the major axis to the minor axis of the ellipse equivalent to the crystal on the thin-section plane. The crystal-elongation direction is the angle between the core axis and the major axis of the ellipse equivalent to the crystal. The local mean Schmidt factor, the local mean grain-size, the local mean aspect ratio and the local mean crystal-elongation direction defined above are calculated over the area equivalent to ten times the mean crystal area and are plotted on a 10 × 10 pixel grid centered on the area. All pixels in a grid are then painted the same color. This software is installed in the present automated system.
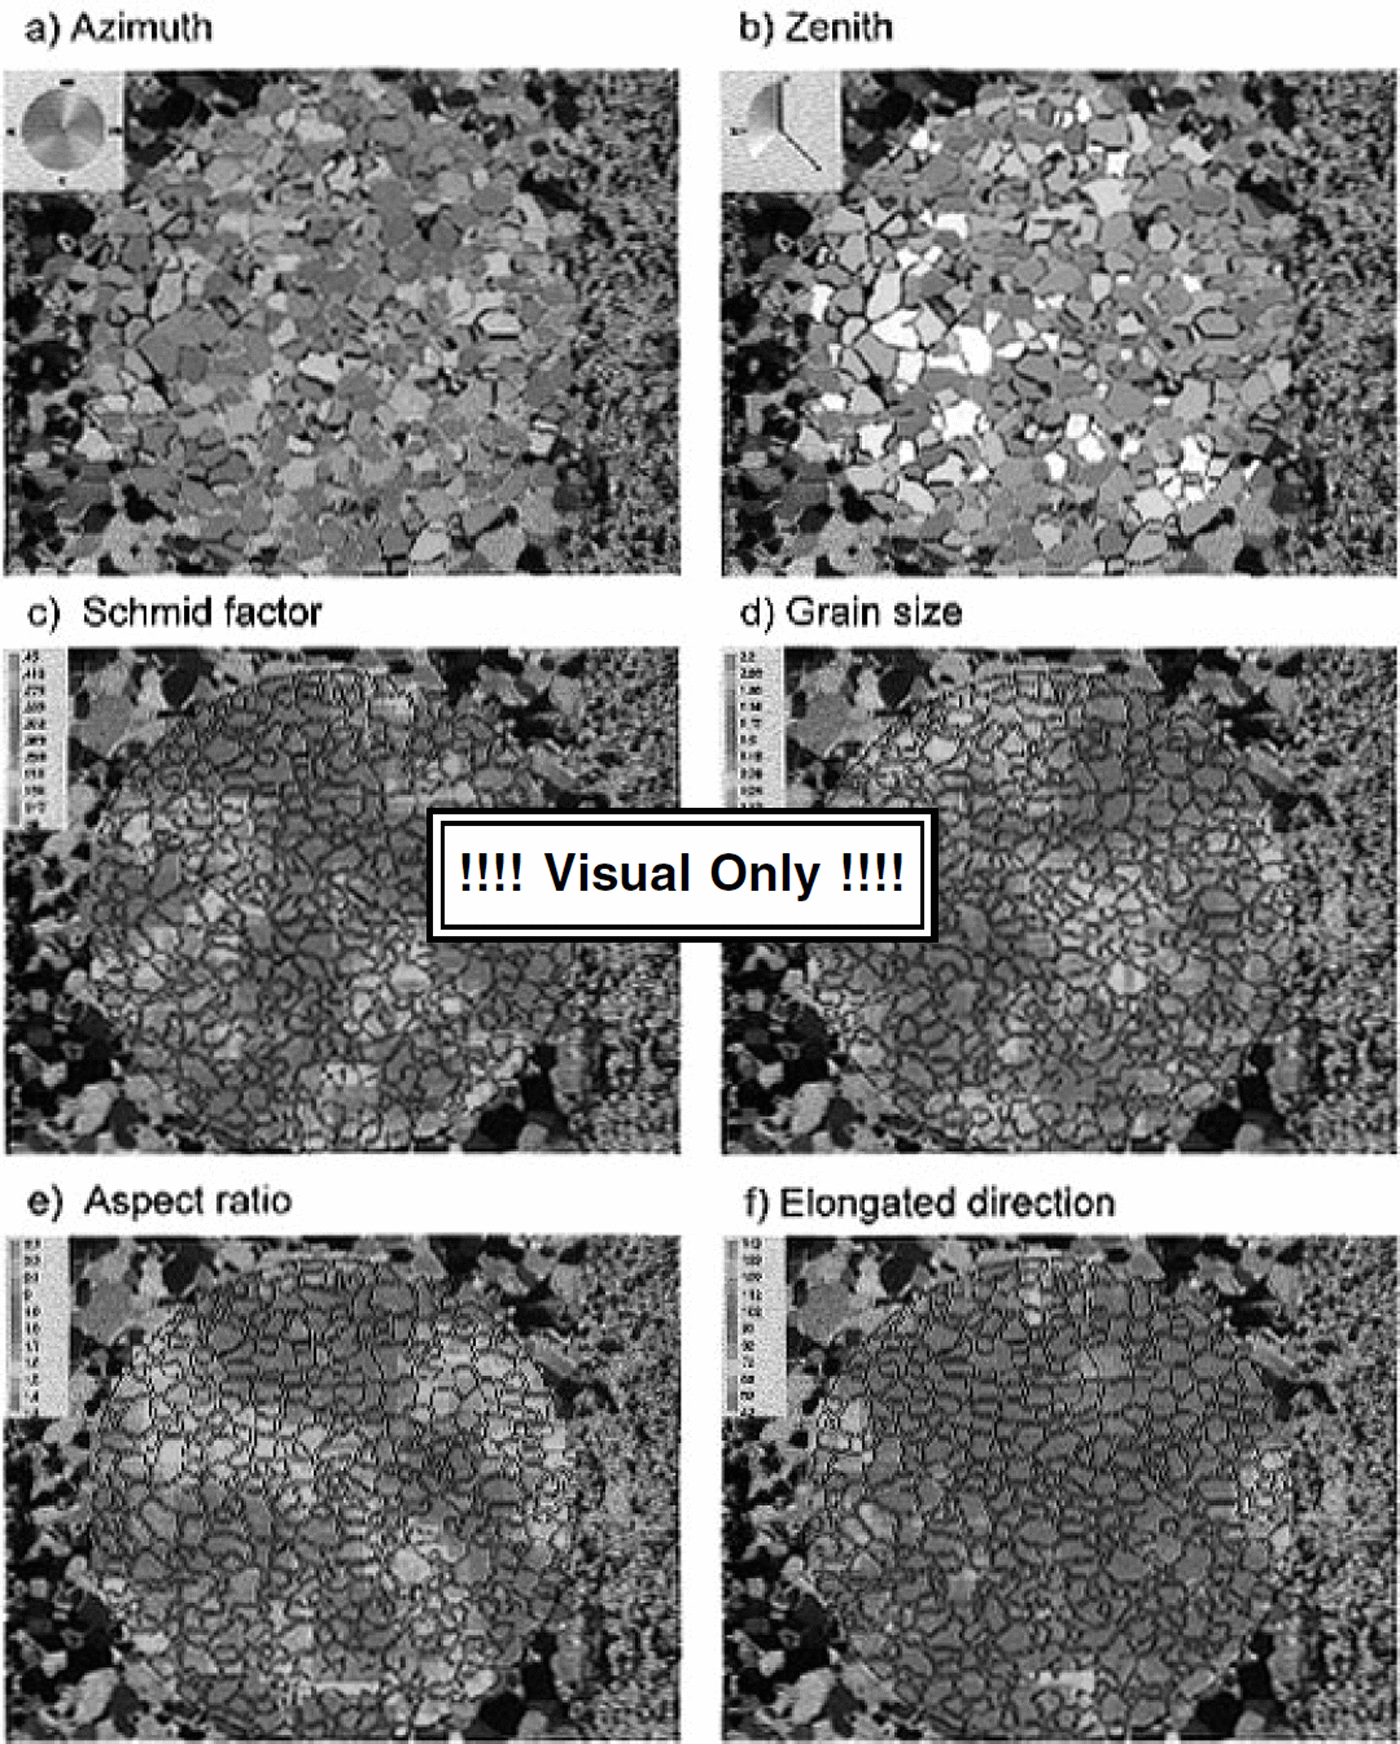
Fig. 9. Visual prsentation on the thin-sectiancrystalimage: (a) azimuth; (b) zenith angle; ( c) local mean Schmidt factor; (d) local mean grain-size; ( e) local mean aspect ratio; (f) local mean direction of crystal elongation.
Conclusion
An automatic ice-fabric analyzer using image-analysis techniques has been developed. This system enables us to measure rapidly not only ,-axis orientations of individual crystals but also individual crystal size/shape on a thin section. Fabric-accuracy analysis indicates that the automatic device is more accurate than the universal stage, with an error of A1 ≤ ± 0.34°, A2 ≤ ± 1° and reproducibility <1°. A disadvantage of this method is that if the c axis is near-parallel to the optical axis (Z axis) the ,-axis orientation cannot be determined exactly by this method (error <10°). Therefore, in the case of an ice-core sample in which most of the c axes align to the core axis, we need to avoid this condition by not taking horizontal (perpendicular to the core axis) thin sections.
Acknowledgements
An initial attempt to develop a new, rapid method of ice-fabric analysis upon which the present study is based was made by one of the authors (N.A.) at the Ice Gore Laboratory, State University of New York-Buffalo in 1986. The authors especially thank G. G. Langway, Jr and H. Shoji for giving N.A. this opportunity and for valuable discussions. We are indebted to Y. Maruhashi, H. Hara, H. Yamaguchi and T. Nakajima who helped to conduct experimental studies to develop this method. We are grateful to O. Watanabe, H. Narita, M. Nakawo, S. Fujita, T. Hondoh, K. Goto-Azuma, V. Morgan, T. H. Jacka, LiJun and an anonymous reviewer for helpful comments. This work was supported by a grant-in-aid for scientific research from the Ministry of Education, Culture and Science of Japan.


