


Introduction
Text processing effort, a crucial dimension of text difficulty or readability (Dale & Chall, Reference Dale and Chall1949), refers to the ease with which readers process a text. When it comes to learning a second language (L2), the level of difficulty of texts being studied is crucial because effective learning heavily relies on L2 input that is appropriately challenging (Krashen, Reference Krashen1987). Over the last decades, a large number of English readability formulas, say Flesch Reading Ease and New Dale–Chall formula, have been developed (Crossley et al., Reference Crossley, Skalicky and Dascalu2019; see also Benjamin, 2012, for a review), seeking to help educators, reading researchers, and language teaching material compilers assess texts that are “not too easy, not too difficult, but just right” for the prospective readers (McNamara et al., Reference McNamara, Graesser, McCarthy and Cai2014, p. 9).
Despite the potential benefits of using readability formulas to evaluate text difficulty for L2 learners, there are also problems associated with this approach. For instance, the majority of English readability formulas are created based on the perception of text comprehensibility by L1 users. Text difficulty, a multifaceted construct, involves the ease with which a text is comprehended and processed (Richards & Schmitt, Reference Richards and Schmitt2010). As a result, these formulas are generally not as effective in measuring the processing effort required for text reading, especially for L2 learners due to substantial differences in the learning experience of L1 and L2 (Crossley et al., Reference Crossley, Greenfield and McNamara2008; Nahatame, Reference Nahatame2021). Indeed, lexical sophistication, morphological regularity, and syntactic patterns have been found to differentially affect the processing of L1 and L2 texts (Goldschneider & DeKeyser, Reference Goldschneider and DeKeyser2001). This study is motivated by the fact that there are currently limited studies examining the extent to which linguistic complexity features can contribute to L2 processing effort. It is important to address this issue, as accurately evaluating the difficulty level of L2 texts is not possible without taking into account the performance of L2 learners in processing the text. In this study, we follow the broad definition of linguistic complexity (Housen & Simoens, Reference Housen and Simoens2016) and subsequently operationalize it at the lexical, syntactic, and discoursal levels (Kim, Crossley, & Kyle, Reference Kim, Crossley and Kyle2018; Kim, Crossley, & Skalicky, Reference Kim, Crossley and Skalicky2018; Lu, Reference Lu2011, Reference Lu2012). Hopefully, our observations can contribute to a better understanding of text difficulty in general, and to the development of more effective readability formulas for L2 learners in particular.
Background literature
Text difficulty and readability formulas
Text difficulty refers to the extent to which a group of readers understands a given piece of printed material, reads it at an optimal speed, and finds it interesting (Dale & Chall, Reference Dale and Chall1949). Viewed in this way, text difficulty is directly bound up with modes of texts, language comprehension and processing, readers’ characteristics, and interactions among these factors (DuBay, Reference DuBay2004). To capture these features, some classic readability formulas such as Flesch Reading Ease (Flesch, Reference Flesch1948), New Dale-Chall formula (Dale & Chall, Reference Dale and Chall1948), Automated Readability Index (Senter & Smith, Reference Senter and Smith1967), SMOG formula (McLaughlin, Reference McLaughlin1969), and Flesch–Kincaid Grade (Kincaid et al., Reference Kincaid, Fishburne, Rogers and Chissom1975) have been developed based either on L1 users’ scores of reading tests or on their perception of text comprehensibility. However, these formulas only incorporate surface-level linguistic features including word length (i.e., the number of syllables per word) or word familiarity and sentence length (i.e., the number of words per sentence) as predictor variables for text difficulty, without considering other crucial linguistic features such as distance between two related linguistic items in sentences or cohesive linkages that bear upon text processing and comprehension, thus lacking construct validity (Crossley et al., Reference Crossley, Greenfield and McNamara2008; Crossley et al., Reference Crossley, Skalicky and Dascalu2019). Variables and data source involved in these classic formulas can be found in Appendix 1 in the supplementary material online.
To remedy this issue, Crossley et al. (Reference Crossley, Greenfield and McNamara2008) incorporated lexical (word frequency), syntactic (sentence similarity captured by lexical coreferentiality), and cohesive (overlap of content words between adjacent sentences) features into their Coh-Metrix L2 Reading Index (CML2RI), finding that CML2RI outperformed classic formulas (i.e., Flesch Reading formulas and new Dale–Chall formula) in predicting Japanese students’ scores of English cloze tests. Likewise, by using cognitively inspired linguistic (lexical, syntactic, discoursal, and sentimental) indices to predict English users’ comparative judgment on text comprehensibility and reading speed, Crossley et al. (Reference Crossley, Skalicky and Dascalu2019) developed the Crowdsourced Algorithm of Reading Comprehension (CAREC), and the Crowdsourced Algorithm of Reading Speed (CARES), finding that both CAREC and CARES outperformed classic formulas in predicting Egnlsih-L1 text difficulty. The variables and data source involved in these three formulas can be found in Appendix 1 in the supplementary material online.
Despite significant advances in assessing text complexity, current English readability formulas may still have limitations in their validity, possibly because these formulas prioritize reflecting accuracy in text comprehension over ease of processing. Text difficulty is not a unitary construct, as it involves both text comprehension and processing. Efforts of text processing have seldom been explored in these formulas, except that CARES was designed based on the English users’ judgment on reading speed. However, such judgment is less capable of tapping into the processing effort involved in reading, as text processing is a dynamic process in which meaning decoding, syntactic parsing, and meaning construction are executed (Carroll, Reference Carroll2008; Crossley et al., Reference Crossley, Greenfield and McNamara2008; Just & Carpenter, Reference Just and Carpenter1987). The evaluation of text difficulty should therefore take this dynamic process into account.
Importantly, these formulas have been found to be less effective in evaluating the effort required for processing L2 texts. For instance, Nahatame (Reference Nahatame2021) examined how text difficulty, as assessed by these formulas, affected the processing effort of Japanese–English and Dutch–English L2 learners. The resulting readability scores were used to predict eye movements during text reading. The results showed that, although newer formulas (i.e., CML2RI, CARES, and CAREC), in some cases, outperformed classic ones (i.e., Flesch–Kincaid Grade, Flesch Reading Ease, New Dale–Chall) in predicting L2 fixation duration, regression, skipping, and saccade length, scores of these formulas could explain less than 7% of the variance in these measures. This made Nahatame conclude that it is impractical to use a single formula to predict text processing effort and it is more advisable to examine which linguistic complexity features, instead of holistic readability scores, could predict L2 processing effort in reading. Therefore, it is crucial to move beyond readability formulas that are solely based on reading comprehension and perception and instead delve into L2 learners’ real-time processing data to investigate text processing efforts.
With these inadequacies in mind, we attempted to examine English text difficulty by analyzing linguistic features that could reflect processing effort involved in L2 text reading. In what follows, we briefly review recent findings of processing effort in reading.
Text processing effort in reading: Eye-tracking evidence
Eye-tracking has been widely used in both L1 and L2 reading research because it resembles natural reading and can provide valuable information of cognitive processes involved in text processing (Godfroid, Reference Godfroid2019). Specifically, it helps distinguish both the when (temporal) and where (spatial) aspects in real-time reading. The former is related to how long readers fixate on a word and at what time they initiate a saccade in the uptake of linguistic information, whereas the latter is associated with which word as a target for fixation and skipping, and what saccade amplitude used to attain this target (Rayner, Reference Rayner1998; Siegelman et al., Reference Siegelman, Schroeder, Acartürk, Ahn, Alexeeva, Amenta, Bertram, Bonandrini, Brysbaert, Chernova, Fonseca, Dirix, Duyck, Fella, Frost, Gattei, Kalaitzi, Kwon, Lõo and Kuperman2022). Therefore, eye movements, have two prominent features: fixation and saccade. That is, in the reading process readers make rapid eye movements from one place to another (called saccades, typically about two degrees of visual angle) separated by clear pauses (called fixations, usually approximately 200–250 ms for skilled readers when reading English sentences; Castelhano & Rayner, Reference Castelhano, Rayner, Rayner, Shen, Bai and Yan2008). The readers’ backward saccades of eyes in reading are called regressions (Rayner, Reference Rayner1998).
Fixation duration and reading rate are associated with the when of reading, and skipping rate and saccade amplitude are linked to the where of reading. Regression rate can also be linked to where, as it may indicate a need for reanalysis. Based on the assumption that “fixation duration in one condition” and “saccades between fixations” can reflect the level of processing effort involved (Liversedge et al., Reference Liversedge, Paterson, Pickering and Underwood1998, pp. 58–60), and can also offer insights into a reader’s grammatical sensitivity, parsing preferences, and processing difficulty (Godfroid, Reference Godfroid2019), researchers have investigated how text difficulty could affect the eye movements of readers (e.g., Cop et al., Reference Cop, Drieghe and Duyck2015; Rayner et al., Reference Rayner, Chace, Slattery and Ashby2006). Processing effort has often been captured using mean fixation duration, regression rate, skipping rate, and mean saccade amplitude, and the following patterns have been observed.
First, L1 readers’ fixation duration, fixation counts, and regression rate are significantly related to their ratings on text difficulty (Rayner et al., Reference Rayner, Chace, Slattery and Ashby2006), and L2 learners’ reading times (i.e., fewer look-backs in Cop et al., Reference Cop, Drieghe and Duyck2015; Nahatame, Reference Nahatame2020; Sui et al., Reference Sui, Dirix, Woumans and Duyck2022) vary as a function of text difficulty. Second, cohesive devices such as connectives could minimize L1 readers’ fixation duration and regression rate (Zufferey et al., Reference Zufferey, Mak, Degand and Sanders2015), and causal relatedness between sentences could decrease their first-pass reading times (Torres et al., Reference Torres, Sena, Carmona, Moreira, Makse and Andrade2021). Third, when processing longer or low-frequency words in text, both L1 (Cop et al., Reference Cop, Drieghe and Duyck2015; Inhoff & Rayner, Reference Inhoff and Rayner1986; Reichle et al., Reference Reichle, Pollatsek, Fisher and Rayner1998) and L2 readers’ (i.e., Cop et al., Reference Cop, Drieghe and Duyck2015; Nahatame, Reference Nahatame2020; Sui et al., Reference Sui, Dirix, Woumans and Duyck2022) fixation duration and regression rate increase and their skipping rate decreases. Fourth, when processing complex syntactic structures such as antecedent-anaphor inconsistencies (Rayner et al., Reference Rayner, Chace, Slattery and Ashby2006) and ambiguous sentences (i.e., Frazier & Rayner, Reference Frazier and Rayner1982; Holmes & O’Regan, Reference Holmes and O’Regan1981), L1 readers’ fixation duration and regressions tend to increase.
These studies show that readers tend to spend more time (i.e., longer fixation duration, more regressions and low skipping rate) recognizing difficult linguistic patterns including sophisticated words, complex structures, and texts with fewer connectives and less semantic overlap across sentences in text reading (e.g., Cop et al., Reference Cop, Drieghe and Duyck2015; Holmes & O’Regan, Reference Holmes and O’Regan1981; Zufferey et al., Reference Zufferey, Mak, Degand and Sanders2015). We therefore anticipate that as linguistic complexity of reading materials increases, L2 reading rate, skipping rate, and mean saccade amplitude will decrease, whereas mean fixation duration and regression rate will increase. As there have been no comprehensive investigations conducted to assess how linguistic complexity affects text processing, the precise ramifications of linguistic complexity on L2 processing effort remain uncertain. In the next section, we briefly review recent advances in linguistic complexity research, which may help select legitimate linguistic features as predictor variables.
Research into linguistic complexity
Linguistic complexity exists in various language systems and has been often measured at the levels of lexical sophistication, syntactic complexity, and discoursal cohesion for written language (Bulté & Housen, Reference Bulté, Housen, Housen, Kuiken and Vedder2012; Kyle, Reference Kyle2016; Lu, Reference Lu2012; Read, Reference Read2000).
Lexical sophistication refers to the use of advanced or difficult words in a text (Laufer & Nation, Reference Laufer and Nation1995). The following measures are often used to capture this notion: range, frequency, psycholinguistic norms, and n-gram properties because of their importance in L2 learning and processing (Bulté & Housen, Reference Bulté, Housen, Housen, Kuiken and Vedder2012; Lu, Reference Lu2012; Kim & Crossley, Reference Kim, Crossley and Kyle2018; Kim et al., Reference Kim, Crossley and Kyle2018). In a reference corpus, word range estimates how widely words are used in different texts (Kyle et al., Reference Kyle, Crossley and Berger2018), and frequency measures how often words are used. Normally, low-frequency words and words used in restricted contexts are sophisticated (Ellis, Reference Ellis2002). Psycholinguistic norms include word meaningfulness, concreteness, imageability, familiarity, and age of acquisition/exposure (McNamara et al., Reference McNamara, Graesser, McCarthy and Cai2014). Meaningfulness refers to how easy a word can evoke semantic associations. It is difficult for L2 users to generate associations when processing words with low meaningfulness scores. Concreteness estimates how likely the referent of a word is perceptible (Kaushanskaya & Rechtzigel, Reference Kaushanskaya and Rechtzigel2012). It is harder to perceive the referents of abstract words than those of concrete ones. Familiarity reflects how commonly learners encounter a word. Age of acquisition/exposure refers to the age at which a word is learned (Kuperman et al., Reference Kuperman, Stadthagen–Gonzalez and Brysbaert2012). Less familiar words and later acquired words are generally considered sophisticated. N-gram properties have also been found to affect L2 processing (Ellis et al., Reference Ellis, Simpson-Vlach and Maynard2008). N-gram frequency measures how frequently an n-gram is used, whereas association estimates the degree to which words in an n-gram attract one another. L2 learners have been found to process high-frequency or strongly associated n-grams more quickly than low-frequency or weakly associated ones (Öksüz et al., Reference Öksüz, Brezina and Rebuschat2021).
Syntactic complexity refers to the elaboration and variation of syntactic structures (Kyle & Crossley, Reference Kyle and Crossley2018). Traditionally, it has been measured at the clause or T-unit level for the length of production unit, overall sentence complexity, coordination, subordination, and so on (Lu Reference Lu2011). Considering that these measures cannot capture the emergence of specific linguistic structures as L2 proficiency develops, usage-based approaches recommend to use fine-grained indices at the phrasal, clausal, and verb-argument levels to measure different types of phrases (e.g., adjectival modifiers per nominal; Biber et al., Reference Biber, Gray and Staples2016; Kyle & Crossley, Reference Kyle and Crossley2018), clauses (e.g., passive auxiliary verbs per clause), and the distance between syntactic components (e.g., dependents and governor; Liu et al., Reference Liu, Xu and Liang2017). It has been found that sentence processing is significantly influenced by syntactic complexity because syntactically complex structures require more cognitive resources in reading (Gibson, Reference Gibson1998; O’Grady, Reference O’Grady and Kidd2011).
Discoursal complexity has to do with cohesion, which is often realized by using cohesive devices. Such devices can help L2 readers disentangle information both within and across sentences, therefore playing important roles in determining text difficulty (Crossley et al., Reference Crossley, Skalicky and Dascalu2019; Halliday & Matthiessen, Reference Halliday and Hasan1976). For instance, the overlap of content words between paragraphs can assist readers in establishing connections among information (Crossley & McNamara, Reference Crossley, McNamara, Carlson, Hoelscher and Shipley2011), and the overlap of content words between sentences can help meaning construction and therefore enhance reading speed (Rashotte & Torgesen, Reference Rashotte and Torgesen1985). Cohesion exists at the local, global, and overall text levels (Crossley et al., Reference Crossley, Kyle and McNamara2016). Local cohesion is linkages between structures within a paragraph (i.e., word overlap across adjacent sentences), global cohesion is linkages between paragraphs (i.e., word overlap in adjacent paragraphs), and overall text cohesion is the use of cohesive linkages across the text (i.e., word repetition in the text).
Research questions
In view of the gap identified above in text processing research, as well as the advantage of eye tracking that can reflect authentic reading process, we intended to use reading rate (words per minute), mean fixation duration, regression rate, skipping rate, and mean saccade amplitude (number of letters) as proxies for processing effort, as they have been found to be closely related to overall text difficulty (Cop et al., Reference Cop, Drieghe and Duyck2015; Liversedge et al., Reference Liversedge, Paterson, Pickering and Underwood1998; Nahatame, Reference Nahatame2021; Rayner, Reference Rayner1998). The following research questions were addressed.
RQ1. To what degree can lexical, syntactic, and discoursal complexity features explain processing effort captured by L2 learners’ reading rate, mean fixation duration, regression rate, skipping rate, and mean saccade amplitude?
RQ2. Can lexical, syntactic, and discoursal complexity features identified for RQ1 outperform readability formulas (Flesch Reading formulas, Automated Readability Index, Simple Measure of Gobbledygook Formula, New Dale–Chall Formula, CML2RI, CAREC, and CARES) in predicting processing effort captured by L2 learners’ reading rate, mean fixation duration, regression rate, skipping rate, and mean saccade amplitude?
In Study 1, we first analyzed the Dutch–English L2 learners’ eye-movement patterns from Ghent Eye-tracking Corpus (GECO; Cop et al., Reference Cop, Drieghe and Duyck2015) and then calculated the variances in the eye-movement measures explained by the linguistic complexity indices (RQ1). Second, we compared the variances in the eye-movement measures explained by the linguistic indices identified for RQ1 and those explained by the readability formulas (RQ2).
As our approach to exploring RQ1 was data driven and bottom up, it may be sensitive to the sample used, so we sought to evaluate whether the findings from Study 1 could be applied more broadly. Study 2 sought to test this issue by using L2 eye movements in the Multilingual Eye-Movements Corpus (MECO; Siegelman et al., Reference Siegelman, Schroeder, Acartürk, Ahn, Alexeeva, Amenta, Bertram, Bonandrini, Brysbaert, Chernova, Fonseca, Dirix, Duyck, Fella, Frost, Gattei, Kalaitzi, Kwon, Lõo and Kuperman2022).
RQ3. Can the pattern observed for RQs 1 and 2 be observed when applied to new data sets?
Study 1: Modeling L2 processing effort
Eye-tracking corpus
The L2-section of GECO (GECO-L2) was selected. GECO-L2 contained eye-movement data of 19 Dutch–English L2 undergraduates in Ghent University. The participants were asked to read the novel The Mysterious Affair at Styles (56,000 words) in four sessions of an hour and a half. All participants took language proficiency tests (a spelling test, the LexTALE, and a lexical decision task). Based on the LexTALE norms (Lemhöfer & Broersma, Reference Lemhöfer and Broersma2012), two participants were lower intermediate L2 learners, 10 participants were upper intermediate learners, and seven participants were advanced learners. During the experiment, they read the novel silently while the eye tracker recorded their eye movements. Eighteen participants read Chapters 1 to 4 in Session 1, Chapters 5 to 7 in Session 2, Chapters 8 to 10 in Session 3, and Chapter 11 to 13 in Session 4. They read half of the novel in Dutch and the other half in English in a counterbalanced order. One participant read only the first half of the novel in English in Session 1 to 2. The 10 L2 readers read 2,754 Dutch sentences and 2,449 English sentences for the first part of the novel in total, whereas the nine L2 readers read 2,852 English sentences and 2,436 Dutch sentences for the first part of the novel in total. Eye movements for 54,364 English words (5,012 types) were finally collected.
To analyze L2 readers’ eye-movement patterns of each text unit in the first half of the novel, we initially generated text snippets (see Figure 1) based on how they were presented during the experiment. Each trial consisted of one text snippet, and all the measurements were combined for each trial. The data of L2 readers were aggregated into 272 text snippets (M = 90.66 words, SD = 18.29) per participant, with 2,720 observations in total. Second, considering that the participants were Dutch–English L2 undergraduates who were at the same English proficiency level and that Nahatame (Reference Nahatame2021) found the significant effect of L2 proficiency (i.e., L2 proficiency and text readability scores as predictor variables) on their eye-movement measures (fixation duration, saccade amplitude, skipping rates, regression rates as outcome variables) when reading these snippets, we averaged the values of each eye-movement measures across all L2 readers for each text snippet, respectively. It should be emphasized that the five eye-movement measures selected were normalized indices (as ratios or means), which were less likely to be affected by text length, and this was confirmed by the results of correlation analyses of the eye-movement indices with number of words in each snippet (rs < .056, p > .09). Third, we calculated lexical, syntactic, and discoursal complexity indices for each snippet. Descriptive statistics of text snippets and eye-movement measures are presented in Table 1.

Figure 1. A sample text snippet.
Table 1. Descriptive statistics of text snippets and eye-movement measures in GECO-L2

Note. SD = standard deviation; CI = confidential interval.
Computing linguistic complexity measures
Lexical sophistication indices
The Tool for Automatic Analysis of Lexical Sophistication (TAALES, Kyle et al., Reference Kyle, Crossley and Berger2018) was used to compute lexical sophistication indices. First, word range and frequency based on the fiction section of the Corpus of Contemporary American English (COCA; Davies, Reference Davies2010) were calculated given that our snippets were from a novel. Specifically, the mean frequency scores and mean range scores for all words (AWs), content words (CWs), and functional words (FWs) of each snippet were used. Second, scores of word meaningfulness, familiarity, imageability, and concreteness based on the MRC Psycholinguistic Database (Coltheart, Reference Coltheart1981) were retrieved. Third, age-of-acquisition (AoA) scores for words based on Kuperman et al. (Reference Kuperman, Stadthagen–Gonzalez and Brysbaert2012) were calculated. A text with high scores of these indices reflects that this text contains more familiar, imaginable, concrete, meaningful words, and words acquired at a later age. Fourth, the frequency and association strength of bi- and trigrams were computed.
Global syntactic complexity indices
We employed the Tool for Automatic Analysis of Syntactic Sophistication and Complexity (TAASSC; Kyle, Reference Kyle2016) to calculate syntactic indices of phrasal complexity (complex nominals per clause), and length of linguistic units (mean length of sentence/clause; see Lu, Reference Lu2011, for details). Then, we used the Stanford Dependency Parser (Chen & Manning, Reference Chen, Manning and Marton2014) to compute the dependency distance of each sentence in every snippet. Dependency distance has been assumed to be a reliable index for measuring cognitive resources used in sentence processing (see Liu et al., Reference Liu, Xu and Liang2017, for specific examples). The mean dependency distance (MDD) of sentences can be obtained via the following equation:
 $$ \mathrm{MDD}=\frac{1}{n-1}\sum \limits_{i=1}^n{\mathrm{DD}}_i, $$
where n is the number of words in the sentence and DD i is the dependency distance of the i-th syntactic link of the sentence (Liu, Reference Liu2007). In principle, the larger MDD in a text, the more processing effort L2 readers should put in reading this text.
Fine-grained syntactic complexity indices
We used TAASSC to calculate nominal and clausal indices. For nominal phrases, TAASSC computed the average number of dependents per each phrase type (e.g., nominal subjects, nominal complement, direct object, indirect object, and prepositional object) and the number of specific dependents (e.g., adjective modifiers, verbal modifiers, nouns as modifiers, relative clause modifiers, determiners, adverbial modifiers, conjunction “and,” and conjunction “or”) and in the noun phrases, and the average number of specific dependent types in specific types of noun phrases (e.g., verbal modifiers per passive nominal subject). For clausal indices, TAASSC distinguished specific indices regarding the average number of structures per clause and general indices regrading clausal complexity. To determine the specific indices, TAASSC used the number of direct dependents per clause as a measure of clause length. This was done to prevent structures consisting of multiple words (such as phrases) from being given more importance than those containing only one word. TAASSC then counted each type of specific structure (e.g., dependent clauses or complex nominals) separately. To calculate the general indices, TAASSC tallied the total number of dependents per clause by calculating both the average number of dependents per clause and the standard deviation of the number of dependents per clause.
Discoursal complexity indices
We used the Tool for the Automatic Analysis of Cohesion (TAACO, Crossley et al., Reference Crossley, Kyle and McNamara2016) to compute indices of cohesion for each text. To be specific, semantic overlap across adjacent sentences and across adjacent paragraphs, lexical overlap across adjacent sentences and across paragraphs, and various types of connectives were taken into consideration. In addition to these local, global, and overall text cohesive indices, TAACO also computed the givenness of information via reporting pronoun density (i.e., number of pronouns divided by the number of words in a text), and repeated content lemmas (i.e., number of repeated content lemmas divided by the number of words in a text).
Computing readability scores
We employed the Automatic Readability Tool for English (Choi & Crossley, Reference Choi and Crossley2020) to calculate readability scores (Flesch Reading formulas, Automated Readability Index, New Dale–Chall, SMOG, CML2RI, CAREC, CARES) for each snippet as baselines for model comparison.
Data analysis
Partial least square regression (PLS-R) modeling was used to fit the eye-movement data because our sample size of text snippets was relatively small (n = 272) and the number of x-variables (linguistic indices) was large (up to 70), and most importantly some of the x-variables were multicollinear (r >.80). PLS-R modeling can effectively solve the issues that stepwise linear regressions cannot handle (Abdi, Reference Abdi2010) by clustering various predictor variables (x-variables) into latent components. Then, the latent components of x-variables are used to predict the outcome variable so as to maximize the covariance between them.
The PLS-R modeling was carried out via the mdatools package (Kucheryavskiy, Reference Kucheryavskiy2020) in R (R Core Team, 2021). First, in order to “turn the bounded eye-tracking measure into an unbounded, continuous variable” (Godfroid, Reference Godfroid2019, p. 275), both skipping rate and regression rate were transformed into empirical logits. Second, PLS components of the original linguistic indices were used to explain a significant amount of variation in both the linguistic indices as x-variables and the eye-movement indices as y-variables. Third, a linear regression model was set up with the PLS components as predictors to fit the eye-movement measures. To build a model that contained an ideal number of components that could validly fit the data, we removed unimportant and noisy linguistic indices (Mehmood et al., Reference Mehmood, Liland, Snipen and Sæbø2012). The determination of PLS components was based on variable importance in projection (VIP), which is an estimation of the contribution of each x-variable to the model (Wold et al., Reference Wold, Johansson, Cocchi and Kubinyi1993). VIP scores > 1 are considered important (Eriksson et al., Reference Eriksson, Byrne, Johansson, Trygg and Vikström2013). Fourth, a tenfold cross validation was employed to identify the optimal number of PLS components. Criteria including regression coefficients and VIP scores are commonly used to select predictors (Mehmood et al., Reference Mehmood, Liland, Snipen and Sæbø2012). The R codes and data are available at https://osf.io/t78yc/.
Results
Modeling reading rate
The correlation analyses yielded 46 linguistic indices that were significantly correlated with reading rate (see Appendix 2 in the supplementary material online). These indices were treated as x-variables incorporated in the PSL-R model. The top two lexical, syntactic, and discoursal indices correlated with reading rate are presented in Table 2. Our findings indicated that the Dutch–English L2 learners had a high reading rate (M = 341.95 words per minute) than did the English L1 readers for fiction (262 words per minute, as reported by Brysbaert, Reference Brysbaert2019). This suggested that the book used in our study contained a significant amount of redundant information, such as repeated names and phrases. A similar high reading rate was also reported for the Chinese version of GECO in a study by Sui et al. (Reference Sui, Dirix, Woumans and Duyck2022).
Table 2. Top two lexical, syntactic, and discoursal indices correlated with reading rate
Note. RRate=reading rate. 95% CI of correlations were based on 1,000 bootstrap samples.
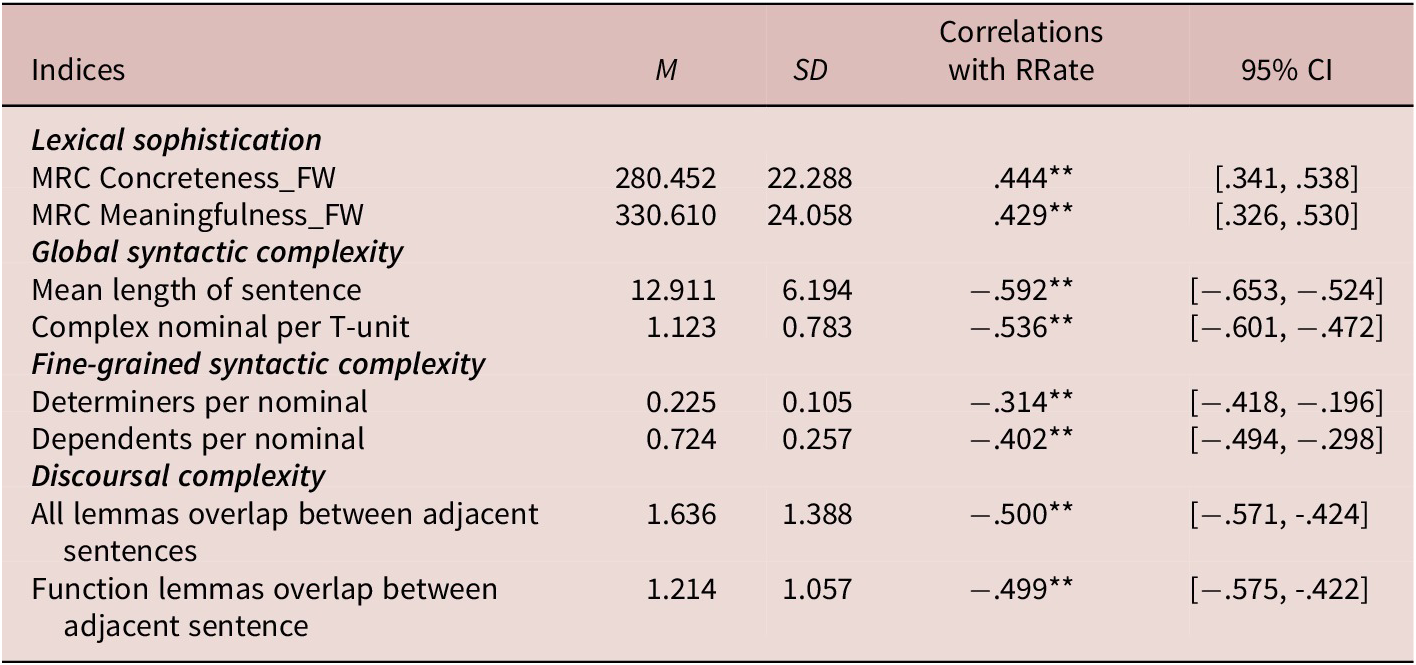
The results of the tenfold cross validation indicate that the PLS-R model that contained only one component of 10 linguistic indices was parsimonious. The linguistic indices retained were able to account for 33.6% of the variance in the x-data matrix and 37.1% of the variance in the y-vector (see Appendix 2 in the supplementary material online). We examined regression coefficients, VIP scores, t-values and the related 95% CI (see Table 3 and Figure 2), finding that the meaningfulness of functional words had the highest positive coefficient, whereas mean length of sentence and complex nominal per T-unit had the highest negative coefficients. The effects of the other seven indices associated with clause length, complex nominals, and lexical overlap between sentences on reading rate were also significant.
Table 3. Linguistic features retained in the PLS-R model for reading rate

Note. Coeffs = coefficients.

Figure 2. Variable importance in projection (VIP) scores and regression coefficient of linguistic complexity indices: Reading rate. A = MRC Meaningfulness_FW; B = mean length of sentence; C = mean length of clause; D = complex nominals per T-unit; E = complex nominals per clause; F = all lemmas overlap between adjacent sentences; G = all lemmas overlap between binary adjacent sentence; H = function lemmas overlap between adjacent sentences; I = function lemmas overlap between binary adjacent sentences; J = noun and pronoun lemmas overlap between adjacent sentences.
Modeling mean fixation duration
The results of the correlation analyses showed that 61 linguistic indices were significantly correlated with the Dutch–English L2 readers’ mean fixation duration (MFD; see Appendix 3 in the supplementary material online). The top two lexical, syntactic, and discoursal indices that were significantly correlated with MFD are presented in Table 4.
Table 4. Top two correlated lexical, syntactic, and discoursal indices with MFD

Note. MFD = mean fixation duration; CW = content words; COCA = Corpus of Contemporary American English. The values for 95% CI of correlations were based on 1,000 bootstrap samples. **p < .01.
The results of tenfold cross validation indicated that the inclusion of other components made the model overfit the data, so we treat the model that contained only one component of 12 linguistic indices as being parsimonious (see Table 5). The model could collectively account for 27.9% of the variance in the x-data matrix and 20.8% of the variance in the y-vector (see Appendix 3 in the supplementary material online). The VIP scores and regression coefficients are graphically presented in Figure 3. To further explore the contribution of these 12 linguistic indices to the prediction of MFD, we examined regression coefficients together with t values and the related 95% CIs. The results indicated that although each of the analyzed indices had a relatively minor effect on MFD, Kuperman’s Age of Acquisition for content words and the Age of English index with a threshold above 40 had the most significant positive coefficients. On the other hand, COCA fiction range for content words, COCA fiction log-frequency of content words, and repeated content lemmas had the most negative coefficients. The contribution of other linguistic indices, such as mean length of sentence, complex nominals per clause, and mean length of clause, to MFD fell somewhere in between.
Table 5. Linguistic features retained the PLS-R model for mean fixation duration

Note. Coeffs= coefficients; CW= content words.

Figure 3. Variable importance in projection (VIP) scores and regression coefficient of linguistic complexity indices: Mean fixation duration. A = MRC_Concreteness_CW; B = Kuperman AoA for all words; C = Kuperman AoA for content words; D = COCA fiction Range for content words; E = COCA fiction log frequency of content words; F = AoE index above threshold 40; G = mean length of sentence; H = mean length of clause; I = Complex nominals per clause; J = Lemma overlap between adjacent sentences; K = repeated content lemmas; L= nominal subjects per clause.
Modeling regression rate
The correlation analyses yielded 45 indices significantly correlated with regression rate (RR) (see Appendix 4 in the supplementary material online). These indices were treated as x-variables included in the PSL-R model for RR. The top two lexical, syntactic, and discoursal indices that were significantly correlated with RR are presented in Table 6.
Table 6. Top two lexical, syntactic, and discoursal indices correlated with RR

Note. COCA= Corpus of Contemporary American English; RR= regression rate. The values for 95% CI of correlations were based on 1,000 bootstrap samples. *p < .05, **p < .01.
The results of the tenfold cross validation showed that the PLS-R model incorporating only one component was the best fit. The VIP cores and regression coefficients are graphically presented in Figure 4. The eight linguistic indices retained in the model (see Table 7) were able to account for 29.2% of the variance in the x-data matrix and 15% of the variance in the y-vector (see Appendix 4 in the supplementary material online). COCA fiction range of all words and COCA fiction log-frequency of all words had the highest positive effects, whereas word length and Kuperman AoA scores of function words had the highest negative effects. The effects of nouns as a nominal dependent per nominal, COCA fiction range of content words, COCA fiction log-frequency of content words, and COCA fiction bigram log-frequency were lying in between.

Figure 4. Variable importance in projection (VIP) scores and regression coefficient of linguistic complexity indices: Regression rate. A = word length; B = Kuperman AoA_FW; C = COCA fiction range_AW; D = COCA fiction Frequency_Log_AW; E = COCA fiction frequency_log_CW; F = COCA fiction range_CW; G = COCA fiction bigram frequency_log; H = nouns as a nominal dependent per nominal.
Table 7. Linguistic features retained in the PLS-R model for regression rates

Note. Coeffs = coefficients; AW = all words; FW = functional words; CW = content words; COCA = Corpus of Contemporary American English.
Modeling skipping rate
Eighteen indices were significantly correlated with the Dutch–English L2 learners’ skipping rate (SR; see Appendix 5 in the supplementary material online) and were incorporated into the PSL-R model. The top two lexical, syntactic, and discoursal indices correlated with SR are presented in Table 8.
Table 8. Top two correlated lexical, syntactic, and discoursal indices with SR

Note. SR = skipping rates. The values for 95% CI of correlations were based on 1,000 bootstrap samples. *p < .05, **p < .01.
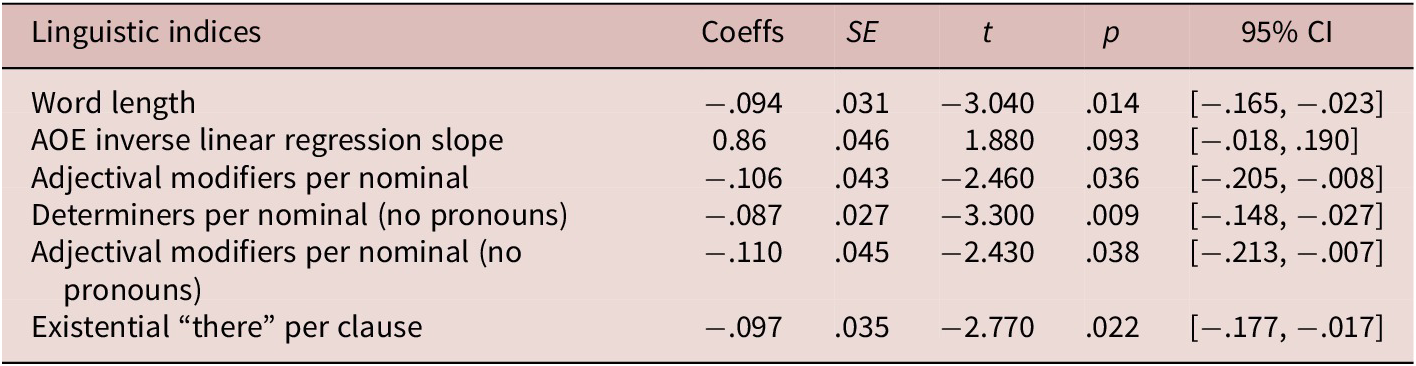
The results of the tenfold cross validation suggested that the PLS-R model containing only one component was the best fit. The VIP cores and regression coefficients are graphically presented in Figure 5. The linguistic indices retained in the model (see Table 9) collectively explained 17% of the variance in the x-data matrix and 14.1% of the variance in the y-vector (see Appendix 5 in the supplementary material online). The relative contribution of these indices showed that existential “there” per clause, adjectival modifiers per nominal, and adjectival modifiers per nominal (no pronouns), among the five linguistic indices, were the most important variables that could predict the Dutch–English L2 learner’ skipping rate.

Figure 5. Variable importance in projection (VIP) scores and regression coefficient of linguistic complexity indices: skipping rates. A = word length; B = AOE inverse linear regression slope; C = adjectival modifiers per nominal; D = determiners per nominal (no pronouns); E = adjectival modifiers per nominal (no pronouns); F = existential “there” per clause.
Table 9. Linguistic features retained in the PLS-R model for skipping rates
Note. Coeffs = coefficients.
Modeling mean saccade amplitude
The correlation analysis yielded 33 linguistic indices that were significantly correlated with the participants’ mean saccade amplitude (MSA; see Appendix 6 in the supplementary material online). They were included into the PSL-R model for MSA. The top two lexical, syntactic, and discoursal indices correlated with MSA are presented in Table 10.
Table 10. Top two lexical, syntactic, and discoursal indices correlated with MSA

Notes: MSA = mean saccade amplitude. The values for 95% CI of correlations were based on 1,000 bootstrap samples. *p < .05, **p < .01.
The results of the tenfold cross validation indicated that the PLS-R model containing only one component was parsimonious. The VIP scores and regression coefficients are graphically presented in Figure 6. The seven linguistic indices of the first component (see Table 11) could explain 33% of the variance in the x-data matrix and 11% of the variance in the y-vector (see Appendix 6 in the supplementary material online). These findings demonstrated that the predictability of linguistic indices in the current study over the mean saccade amplitude was weak. A further scrutiny of the coefficients, t values, and 95% CI revealed that COCA fiction bigram frequency and overlap of content lemmas between adjacent sentences had the highest positive coefficient. Four indices regarding the overlap of content lemmas and the overlap of noun and pronoun lemmas contributed the PLS-R model for MSA. However, the effect of dependents per object of the preposition (no pronouns, standard deviation) was not significant.

Figure 6. Variable importance in projection (VIP) scores and regression coefficient of linguistic complexity indices: Mean saccade amplitude. A = COCA fiction bigram frequency; B = dependents per object of the preposition (no pronouns, standard deviation); C = adjacent sentence overlap all lemmas; D = sentence overlap content lemmas; E = adjacent sentence overlap content lemmas (sentence normed); F = binary adjacent sentence overlap content lemmas; G = adjacent sentence overlap noun and pronoun lemmas (sentence normed).
Table 11. Linguistic features retained in the PLS-R model for mean saccade amplitude

Note. SD = standard deviation; Coeffs = coefficients.
Comparing PLS-R models with readability formulas
We compared the predictive ability of the PLS-R models for GECO eye-movement measures and eight readability formulas (Flesch Reading Ease, Flesch–Kincaid Grade, Automated Readability Index, new Dale–Chall, SMOG, CAREC, CARES, and CML2RI). The results indicated that our PLS-R models could respectively explain 37, 22, 15, 14, and 11% of the variance in reading rate, mean fixation duration, regression rate, skipping rate, and mean saccade amplitude. However, the variance in these eye-movement measures explained by the readability formulas was even lower. Only 20%–33% of the variance in reading rate was explained by Flesch Reading Ease, Flesch–Kincaid Grade, Automated Readability Index, and SMOG (see Table 12). These results support our argument that it is advantageous to use multiple linguistic complexity features rather than relying on overall readability scores to predict L2 processing effort as reflected in eye-movement patterns during reading.
Table 12. Variance in GECO eye-movement measures explained by PLS-R models versus readability formulas

Note. FRE = Flesch Reading Ease; FKG = Flesch–Kincaid Grade; ARI = Automated Readability Index; SMOG = Simple Measure of Gobbledygook Formula; NDC = New Dale–Chall Formula; CML2RI = Coh-Metrix L2 Reading Index; CAREC = Crowdsourced Algorithm of Reading. Speed; RRate = reading rate; MFD = mean fixation duration; MSA = mean saccade amplitude; RR = regression rate; SR= skipping rate.
Study 2: Testing PLS-R models with new eye-movement data
Eye-tracking corpus
We examined whether the PLS-R models’ superiority over the readability formulas was also evident in a new data set consisting of the eye-movement patterns from MECO (Siegelman et al., Reference Siegelman, Schroeder, Acartürk, Ahn, Alexeeva, Amenta, Bertram, Bonandrini, Brysbaert, Chernova, Fonseca, Dirix, Duyck, Fella, Frost, Gattei, Kalaitzi, Kwon, Lõo and Kuperman2022). To ensure that the Dutch–English L2 readers were comparable to those in the GECO data set in terms of their English proficiency and learning experience, we selected 47 students from Ghent University who were tested on the same eye-tracking equipment. The MECO readers were asked to read 12 Wikipedia-type English paragraphs of historical figures, events, and social or natural phenomena (M = 137.75 words, SD = 25.34). For each participant, we aggregated the original eye-movement data of each paragraph. The descriptive statistics of the eye-movement measures are presented in Table 13.
Table 13. Descriptive data of the Dutch–English L2 learners’ eye movements in MECO

Data analysis
First, the linguistic variables in the PLS-R models used in Study 1 and text readability scores of the 12 texts in MECO were computed (see Appendix 8 in the supplementary material online for the descriptive statistics). Second, these linguistic variables in the PLS-R models used in Study 1 were respectively regressed against the 47 Dutch–English L2 readers’ reading rate, mean fixation duration, mean saccade amplitude, regression rate, and skipping rate in MECO. Third, the values for variance in the eye-movement measures explained by the readability formulas were calculated by squaring the Pearson correlation between the eye-movement measures and readability scores. The R code and data are available at https://osf.io/t78yc/.
Results
Compared with the results obtained from the GECO data set, the predictive ability of our PLS-R variables on the new MECO data set fell sharply. Specifically, they could account for only 7, 16, 4, 8, and 13% of the variance in reading rate, mean fixation duration, mean saccade amplitude, regression rate, and skipping rate, respectively (Table 14). Nevertheless, these models outperformed the eight readability formulas in predicting L2 processing effort based on MECO data. Overall, these findings indicate that the linguistic features identified in this study can be potentially used to predict L2 text processing effort.
Table 14. Variance in MECO eye-movement measures explained by PLS-R models versus readability formulas
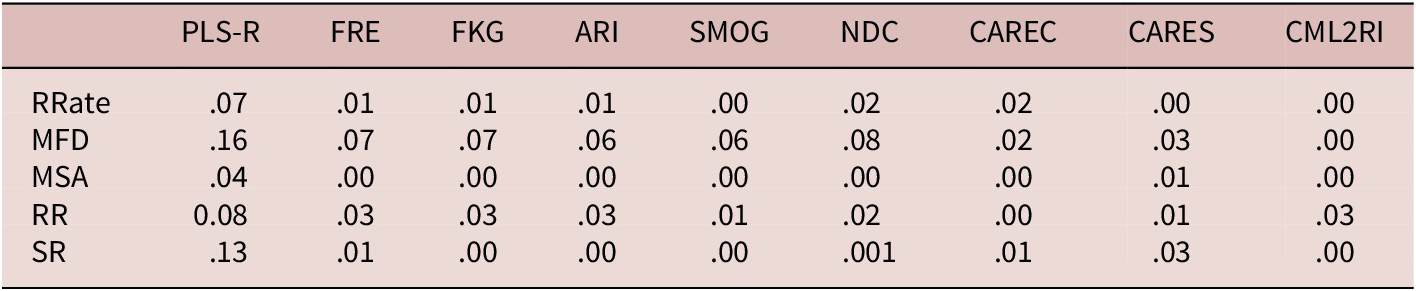
Note. FRE = Flesch Reading Ease; FKG = Flesch–Kincaid Grade; ARI = Automated Readability Index; SMOG = Simple Measure of Gobbledygook Formula; NDC = New Dale–Chall Formula; CML2RI = Coh-Metrix L2 Reading Index; CAREC = Crowdsourced Algorithm of Reading. Speed; RRate = reading rate; MFD = mean fixation duration; MSA = mean saccade amplitude; RR = regression rate; SR= skipping rate.
Discussion
This study examined the extent to which linguistic complexity features could contribute to processing effort in L2 reading. The processing effort was captured by L2 reading rate, mean fixation duration, regression rate, skipping rate, and mean saccade amplitude, which have been found to measure global text difficulty (Castelhano & Rayner, Reference Castelhano, Rayner, Rayner, Shen, Bai and Yan2008; Cop et al., Reference Cop, Drieghe and Duyck2015; Rayner et al., Reference Rayner, Chace, Slattery and Ashby2006). Results indicated that the one-component PLS-R models could explain 11%–37% of the variance in GECO eye-movement measures, and their predictability shrunk in MECO eye-movement measures, with 4%–16% of the variance being explained. Overall, the effects of lexical, syntactic, and discoursal complexity indices on L2 readers’ eye-movement performance were relatively weak, particularly for mean saccade amplitude, even though our linguistic indices were chosen by considering the recent advances in L2 development, processing, and discourse comprehension. Nevertheless, the linguistic indices identified in our PLS-R models significantly outperformed the eight readability formulas in predicting L2 processing effort. In relation to our three RQs, these findings are discussed as follows.
Contribution of linguistic complexity to processing effort
RQ1 investigated the degree to which lexical, syntactic, and discourse complexity features could forecast processing effort, which was measured based on reading rate, fixation duration, regression rate, skipping rate, and saccade amplitude. As for reading rate, we discovered that texts with a higher number of functional words and greater meaningfulness were read at a quicker pace. However, texts with longer sentences and clauses, more complex nominals, and more repetition of word forms between consecutive sentences were read more slowly. The reason for this is that words with high levels of meaningfulness allow readers to generate more semantic connections (Coltheart, Reference Coltheart1981; McNamara et al., Reference McNamara, Graesser, McCarthy and Cai2014), which can accelerate the process of constructing meaning during reading. Conversely, longer sentences and clauses that consist of more individual elements require greater cognitive resources for processing, as explained by O’Grady (Reference O’Grady and Kidd2011). These observations are in line with existing findings that a text containing more sophisticated words and complex structures would require readers to spend more time comprehending textual information (Cop et al., Reference Cop, Drieghe and Duyck2015; Nahatame, Reference Nahatame2020; Sui et al., Reference Sui, Dirix, Woumans and Duyck2022; Torres et al., Reference Torres, Sena, Carmona, Moreira, Makse and Andrade2021). In contrast to the finding that content word overlap between sentences can aid reading speed (Rashotte & Torgesen, Reference Rashotte and Torgesen1985), our research revealed that this factor had negative correlations with reading rates in both GECO and MECO (See Appendix 8 for correlations). One possible explanation for this result is that the texts we used were excerpts from a detective novel, and academic texts in which words conveying similar meanings were employed to enhance the coherence of the intricate plots or expositions. When reading these excerpts, readers may have needed to focus more on these cohesive devices to grasp the complexity of the plots or expositions.
As for mean fixation duration, word range, frequency, age of acquisition/exposure, and word concreteness were significant factors, with absolute coefficients ranging from .047 to .067. First, fixation duration increased when readers encountered texts containing more sophisticated words such as those that are acquired or exposed to later in life, abstract, of low frequency, and used in more restricted contexts. This agrees with previous findings that language users tend to spend more time processing or comprehending words with such features (e.g., Juhasz & Rayner, Reference Juhasz and Rayner2006; Rayner & Duffy, Reference Rayner and Duffy1986). Second, three syntactic indices (sentence/clause length, and complex nominals per clause) were significant predictors. This indicates that fixation duration tended to increase with longer sentences and clauses, as well as with the use of complex nominals in the text. Nahatame (Reference Nahatame2021) also reported that Flesch–Kincaid Grade scores based on sentence length and word length could significantly predict the duration of eye fixations in L2 reading. Complex nominals typically take the form of a noun followed by modifiers, such as adjectives, adjective clauses, or prepositional phrases, and they usually appear before the main verb in a sentence (Cooper, Reference Cooper1976; Lu, Reference Lu2011). When processed, this left-embeddedness often requires more cognitive effort (Gibson, Reference Gibson1998; Just & Carpenter, Reference Just and Carpenter1999). This may explain why fixation duration tended to increase when complex nominals were present in a sentence. Third, repeated content lemmas led to shorter fixation duration. This is because word repetition made it easier for L2 readers to establish semantic connections, leading to gains in reading speed (Douglas, Reference Douglas and Hudelson1981; Rashotte & Torgesen, Reference Rashotte and Torgesen1985). However, lemma overlaps between adjacent sentences led to longer fixation duration, possibly because the semantic connections between these words were more complex and required more cognitive effort to process, thus leading to longer fixation duration.
As for regression rate, two lexical indices (word length, Kuperman AoA scores for functional words) and one syntactic index (nouns as a nominal dependent per nominal) were the most significant variables, indicating that the more sophisticated words captured by word length and AoA ratings and nouns as modifiers in nominals in the text, the less likely for L2 readers to look back on the preceding sentences. It is possible that L2 readers spent more time processing sophisticated words and complex nominals, as indicated by longer fixation durations, which in turn reduced the likelihood of them looking back to reread these words or phrases. We also found that less sophisticated words, such as high-frequency words or words occurring in more diverse contexts, were positively associated with regression rate. One potential explanation for this is that L2 readers spent less time initially reading these high-frequency words but tended to look back to identify the exact meaning of these words, which are often polysemous (Crossley et al., Reference Crossley, Salsbury and McNamara2010).
As for skipping rate, the effect of word length was significant—that is, it was less likely for readers to skip over words containing more syllables or letters. Likewise, the more complex the nominal phrases (adjectival modifiers or determiners per nominal), the less likely for the readers to skip them during reading. Note that the existential “there” often fills the subject position in a sentence and introduces new information that has not been mentioned before (Biber et al., Reference Biber, Johansson, Leech, Conrad and Finegan1999). The integration of new information with old information through this construction often requires more cognitive resources, which may result in a decrease in skipping rate among L2 readers.
As for saccade amplitude, bigram frequency and the overlap of word lemmas between adjacent sentences were positive predictors. It has been observed that L2 learner process high-frequency n-grams more quickly than low-frequency ones (Öksüz et al., Reference Öksüz, Brezina and Rebuschat2021), largely because the first word of a high-frequency bigram primes the second word. This processing advantage could induce longer saccades during reading. The overlap of content words across adjacent sentences, a local cohesive strategy as discussed above, could help L2 readers connect ideas or infer the semantic relationship between two sentences (Halliday & Hasan, Reference Halliday and Hasan1976) and could therefore maximize the length of saccade in reading.
Variance in processing effort explained: PLS-R models versus readability formulas
RQ2 is concerned with the capacity of our PLS-R models and readability formulas in the prediction of the eye-movement measures. Our findings indicated that the PLS-R models outperformed the eight readability formulas in predicting L2 processing effort. The superiority of these PLS-R models may be due to their ability to capture more nuanced linguistic features and their incorporation of machine learning techniques, which allowed for more accurate predictions. These observations echo Nahatame’s (Reference Nahatame2021) opinion that it is hard to use a single holistic readability score to predict L2 processing effort involved in reading. In principle, text reading is a dynamic process involving meaning decoding, syntactic parsing, and meaning construction, which are mainly accomplished at the lexical, syntactic, semantic, and discoursal levels (Just & Carpenter, Reference Just and Carpenter1987). It can be challenging for readers to evaluate these specific processes through subjective judgment alone. Therefore, when measuring text difficulty, it is important to consider linguistic indices that reflect processing effort—that is, the accessibility of text to readers (Fulcher, Reference Fulcher1997) or the ease with which texts can be read and understood (Dale & Chall, Reference Dale and Chall1949; Richards & Schmitt, Reference Richards and Schmitt2010).
It is important to acknowledge that the explanatory power of the regression models varied greatly for outcome measure in GECO, from 11% to 37%. Remember that fixation duration and reading rate are associated with the temporal aspect of reading, whereas skipping rate, regression rate, and saccade amplitude are linked to the spatial aspect of reading (Godfroid, Reference Godfroid2019). Perhaps, L2 reader’s grammatical sensitivity, parsing preferences, and processing difficulty may be differentially associated with the processing load involved in the temporal and spatial aspects during reading (Rayner et al., Reference Rayner, Chace, Slattery and Ashby2006). Another potential reason for this variation is that text processing involves not only linguistic complexity features but also other variables such as the style of the text, readers’ L2 proficiency, prior knowledge and interest, the content of the reading material, and interactions among them (DuBay, Reference DuBay2004). These variables play important roles in the process of text reading.
Generalizability of PLS-R variables
The predictive power of our PLS-R variables decreased when applied to the MECO data. Possible reasons for the different results in two studies could be attributed to the influence of different genres of texts and sample size on the analysis. First, the language used in a novel and an expository text may vary considerably, with different sets of vocabulary and syntax patterns. In Study 1, the snippets were all taken from a single novel, which might have limited the range of language use and made the results less generalizable to other genres. For example, adjectives and nouns used to describe characters in a novel might be repeated frequently, whereas the language used in expository texts in Study 2 could be more specialized to academic contexts. This difference in language use could have weakened the predictive power of the five PLS-R models, especially those that relied on linguistic indices derived from COCA fiction. Apart from this, as one of the reviewers pointed out, the PLS-R approach we used was data driven, which means that the composition of the components may vary in different corpora. As a result, the ranking of R 2 values for the outcome measures differed across the two corpora (GECO: reading rate > fixation duration > regression rate > skipping rate > saccade amplitude; MECO: fixation duration > skipping rate > regression rate > reading rate > saccade amplitude). Second, the small sample size of texts (n = 12) in Study 2 also limited the predictive power of our PLS-R models. Theoretically, the predictability of these models should become more robust when sample size becomes larger. This is worthy of exploration in future studies.
Shared and unique linguistic features across eye-movement measures
Although the effects of linguistic indices on the Dutch–English L2 learners’ eye movements were comparatively small, the following patterns are clear (see Figure 7). First, fixation duration and regression rate could be significantly predicted by AoA scores, word frequency and range, and word length. Second, fixation duration, regression rate, and skipping rate could be significantly predicted by word length and complex nominals. Third, fixation duration, reading rate, and mean saccade amplitude could be significantly predicted by the overlap of word lemmas. Fourth, fixation duration and reading rate could be significantly predicted by complex nominals and MRC word norms. Fifth, repeated content lemmas were uniquely responsible for explaining fixation duration, and bigram frequency could uniquely predict saccade amplitude.

Figure 7. Linguistic complexity and eye-movement behavior in L2 text reading.
Implications for research and practice
This study provided useful insight into future L2 research into effects of linguistic complexity on text processing. First, even though only a small amount of the processing effort variance was accounted for by linguistic features, our PLS-R models produced potentially encouraging findings. Therefore, we suggest that researchers should consider the influence of the linguistic complexity indices identified in this study when selecting reading materials for moment-to-moment text reading experiments. Second, we found that the most oft-used text readability formulas were not that reliable to explain L2 processing efforts during text reading. This points to the possibility that more attention should be devoted to exploring linguistic complexity and text difficulty by considering the authentic reading process and linguistic features closely associated with the cognitive process of reading such as meaning decoding, syntactic parsing, and meaning construction. To this end, it is recommended that researchers use the linguistic complexity indices identified in our PLS-R models and the linguistic measures generated by the latest natural language processing tools to develop text readability formulas that can evaluate the appropriate level of difficulty for L2 learners.
Our findings are also beneficial in some applied aspects. First, L2 instructors and text book compilers should be aware of linguistic complexity indices including word range and frequency, word length, complex nominals, sentence length, verb–argument associations, and overlap or repetition of content words across adjacent sentences as barometers of overall text difficulty when selecting or adapting candidate texts for the prospective L2 learners. To achieve this, educators are expected to use less sophisticated words, avoid complex nominals, and increase the use of similar words in adjacent sentences so that the target text becomes more accessible to L2 learners. Second, because the linguistic complexity indices involved in the PLS-R models are mainly related to lexical sophistication (word length, range, frequency, age of acquisition/exposure, bigram frequency, and psycholinguistic norms including meaningfulness and concreteness) and syntactic complexity (sentence/clause length, complex nominals), we suggest that teachers should focus on teaching sophisticated words, complex nominals, and other linguistic features during L2 reading instruction. This will help alleviate processing difficulties and support L2 learners in comprehending and processing the text more effectively.
Conclusion
We examined the contribution of linguistic complexity to processing efforts involved in text reading by the Dutch–English L2 learners. The processing effort was operationalized as reading rate, fixation duration, regression rate, skipping rate, and saccade amplitude, which have also been found to measure overall text difficulty. In Study 1, the PLS-R models yielded that linguistic-complexity features could explain 11%–37% of the variance in the five eye-movement measures from GECO. Importantly, these models outperformed eight readability formulas in explaining L2 processing effort. Study 2 found that, although the predictability of the PLS-R components decreased, merely accounting for 4%–16% of the variance in the eye-movement measures from MECO, their advantage over the readability formulas still existed. Based on these observations, we argue that the evaluation of text difficulty should take into consideration L2 learners’ text processing effort in reading together with the recent findings based on L2 learners’ perception on text difficulty (e.g., Crossley et al., Reference Crossley, Greenfield and McNamara2008; Greenfield, Reference Greenfield1999).
However, our study had limitations. First, in our PLS-R modeling the relationship between linguistic complexity and processing effort was linear. However, this relationship is sometimes mediated by various factors such as L2 proficiency and genre (i.e., results in Study 2). Second, our data analyses were based only on the Dutch–English L2 learners’ eye movements in reading a novel and L2 expository texts from two corpora, so caution should be exercised in generalizing these findings to other genres of texts and L2 learners with various L1 backgrounds. Third, we only targeted the role of linguistic complexity, which explained a small portion of variance in the processing effort. Online language processing is a very complex process, often influenced by various factors such as L2 learners’ working memory capacity (Szmalec et al., Reference Szmalec, Brysbaert, Duyck, Altarriba and Isurin2012), familiarity with the reading materials, etc. Fourth, reading accuracy is an important factor that may influence text comprehension and processing. We did not incorporate these because no related data were recorded in GECO. These important issues necessitate more research in this line of inquiry. Despite these imperfections, our study was a useful attempt to explore what makes a text difficult for L2 learners from the perspective of text processing and what we found is potentially useful to develop reliable models to assess L2 text difficulty.
Acknowledgements
We wish to express our gratitude to Luke Plonsky, Jegerski Jill, and four anonymous reviewers for their excellent suggestions in revising this manuscript. This research was supported by a grant from the National Social Science Foundation of China awarded to Xiaopeng Zhang (Award Reference: 20BYY084).
Data availability statement
The experiments in this article earned Open Data and Open Materials badges for transparent practices. The materials and data are available at https://www.iris-database.org/details/VYS2g-9nF7U (data)
https://doi.org/10.6084/m9.figshare.1482031 (Study 1)
https://osf.io/q9h43/ (Study 2)
Supplementary material
The supplementary material for this article can be found at http://doi.org/10.1017/S0272263123000438.


