


One of the most important economic decisions older Americans must make is when to claim their Social Security retirement benefits. While optimal claiming ages vary depending on individual preferences, mortality risk, and health and economic circumstances, there is broad agreement that some people claim too early – resulting in permanently reduced monthly payments. For most, claiming too early results in a reduction in the expected present value of benefits (Shoven and Slavov, Reference Shoven and Slavov2014), and for some, it can be shown that it is a suboptimal choice (Bronshtein et al., Reference Bronshtein, Scott, Shoven and Slavov2016). People are expected to make this decision in a context where the information presented to them is complex and uses terminology that is difficult to understand and may implicitly nudge toward certain choices. In this paper, we study the impact of changing the following three-worded terms: Early Eligibility Age, Full Retirement Age, and Delayed Retirement Credits, for alternative terms that are simpler and may have different implicit nudges (Minimum Benefit Age, Standard Benefit Age, and Maximum Benefit Age).
The traditional approach to addressing this problem is to give people more information through educational materials about the implications of the timing of the claiming decision. As Chan and Stevens (Reference Chan and Stevens2003) note, well-informed individuals may be more receptive to financial incentives than ill-informed individuals. Earlier studies document sizable impacts of providing more information or training in various policy areas, including education, financial planning, and tax and welfare policy.Footnote 1
Concerning Social Security retirement benefits, large-scale dissemination campaigns have indeed succeeded in influencing household decision-making in the past. Mastrobuoni (Reference Mastrobuoni2011) found that people who received their mailed Social Security Statement improved their understanding of the Social Security system, while Cook et al. (Reference Cook, Jacobs and Kim2010) showed the Statement induced more knowledge and confidence in Social Security in recipients compared to those who did not receive it. Liebman and Luttmer (Reference Liebman and Luttmer2015) found that providing older workers with a two-page leaflet containing essential Social Security information increased labor force participation. However, the high cost of maintaining population-level programs and the need to keep administrative expenses manageable make it difficult for agencies to maintain costly information programs. For example, to reduce costs, the Social Security Statement is no longer mailed yearly to all workers, despite evidence it improves Social Security literacy (Smith and Couch, Reference Smith and Couch2014).
An alternative approach is to use insights from behavioral economics that acknowledge that people often make suboptimal decisions even when they have access to all the information they need. The increasing prominence of behavioral economics has led policymakers and practitioners to incorporate ‘nudges’ into policies and programs – small changes that effectively direct people toward improved choices but are ‘soft’ enough to allow people to make their own decisions. Examples of these nudges abound in health, education, environment, taxation, and other areas. In consumer financial behavior, successful examples include automatic enrollment in retirement savings accounts (Madrian and Shea, Reference Madrian and Shea2001; Benartzi and Thaler, Reference Benartzi and Thaler2013) and reminders via text message to increase savings (Karlan et al., Reference Karlan, McConnell, Mullainathan and Zinman2016). One way to nudge decision-making is by making the relevant information more salient or ‘framed’ in a manner that corrects existing biases. Looking specifically at Social Security benefits, studies that have successfully taken this approach include Brown et al. (Reference Brown, Kapteyn and Mitchell2016). They show that a framing treatment that moves away from the often-used ‘break-even analysis’ can lead to decisions to delay claiming.
This study proposes a ‘lighter touch’ approach by providing no new material or further information. Instead, we intervene by simply renaming a few critical terms in existing information to make it clearer and eliminate implicit nudges against delayed claiming. Specifically, we examine the impact of changing the terminology that the Social Security Administration (SSA) uses for the ages at which people can claim retirement benefits. A set of alternative terms, designed to be more transparent and eliminate inappropriate anchoring at earlier claiming ages, was selected based on an initial qualitative study (Filus and Rabinovich, Reference Filus and Rabinovich2015) and consultations with SSA staff. We set the terms Minimum Benefit Age, Standard Benefit Age, and Maximum Benefit Age as an alternative to Early Eligibility Age, Full Retirement Age, and Delayed Retirement Credits. We hypothesized that terms that are clearer and implicitly convey the reduction of benefits resulting from early claiming ages would improve understanding of the trade-offs between claiming at different ages. We further hypothesized this would allow people to make more informed decisions and delay claiming for some.
We evaluate the impact of the alternative terminology on knowledge and claiming and retirement age intentionsFootnote 2 through an online experiment conducted on a representative sample of non-retired Americans in the Understanding America Study (UAS) panel.Footnote 3 We provide panelists information relevant to the claiming decision that is identical across treatment and control groups, except that the information given to those in the treatment group uses the alternative terminology while that presented to the control group uses the current terminology.
Our results suggest that the choice of terminology has significant consequences. Respondents exposed to the alternative terminology performed better in tests measuring their understanding of the information than those exposed to the current terminology. They also spent less time (about 5% less) reading the information. In addition, intended claiming and retirement ages were higher among the treated by an average of two and a half months than in the control group. Furthermore, they were more likely to recommend later claiming ages when presented with characters in standardized vignettes.
Because it is a panel, the UAS allows us to link the data from our experiment with other surveys that respondents have taken, including a set of core surveys that all panelists are invited to take every two years. We study the heterogeneity of effects by interacting treatment status with baseline measures of financial and Social Security literacy and cognitive ability, and indicators of socioeconomic status such as education, income, and wealth. We find that our experimental effects are heterogeneous and are particularly strong for individuals with low levels of financial literacy.
Most of our participants answered a survey on Social Security literacy after our experiment, enabling us to track the persistence of the treatment effects on both knowledge and claiming intentions. We find that respondents exposed to the alternative terms were still statistically significantly more knowledgeable months later and find suggestive evidence that they also continued to expect to claim later. The difference in knowledge between treatment and control groups is almost unchanged in the posterior survey, while the difference in intended claiming age is smaller though still positive.
We conclude that choosing terminology carefully is crucial. We cannot know whether the effects on intended claiming ages would translate to effects on actual claiming behavior if the proposed terminology was adopted widely. However, changing the terminology used in information about the trade-offs in claiming ages may lead to better decision-making on claiming and retirement decisions, particularly for those with low levels of financial literacy. Section 1 describes the claiming terminology and the qualitative findings that motivated our study. Section 2 describes the experiment, Section 3 reports the results, and Section 4 concludes.
1. Claiming terminology
Currently, the SSA refers to the earliest possible time when individuals can claim retirement benefits as the Early Eligibility Age (EEA) – age 62 – and when they become eligible for unreduced benefits as the Full Retirement Age (FRA), which varies by birth year.Footnote 4 Individuals can also earn extra benefits – Delayed Retirement Credits (DRCs) – if they wait to claim beyond their FRA up to age 70. Claiming after age 70 does not result in additional increases in the benefit amount.
In the qualitative formative stage of this study, Filus and Rabinovich (Reference Filus and Rabinovich2015) found that many people are confused by the terms used by SSA. Also, the word ‘early’ in EEA highlights the attractive aspect of claiming at this age (namely, receiving benefits earlier) but does not make the permanent reduction in benefits associated with it salient. The words ‘full’ and ‘retirement’ in FRA invite misinterpretation: the first is by suggesting FRA is the age at which one receives the maximum entitlement. The second implies that FRA is the moment at which one stops or should stop working in order to claim. Finally, the concept of DRCs baffled participants, as they were both unfamiliar with it and unable to work out any of its critical implications from the term alone.
Based on these initial qualitative findings, we hypothesized that the existing terminology encourages earlier claiming by anchoring recipients at their Full Retirement Age rather than the age at which benefits are maximized (70), which is not named – and, hence, not salient. A potentially helpful approach would thus be to revise the existing terms to increase knowledge, reduce confusion, and increase confidence, ultimately leading to a reduction in the proportion of recipients claiming before or at their FRA and an increase in the proportion of recipients claiming at age 70.
We developed the alternative terms shown in Table 1.
Table 1. Terminology

We expected the selected terms to be clearer. However, clarity is not the only difference between the current and the alternative terms. A feature of the latter is that they highlight the benefit amounts with the words: ‘minimum’ and ‘maximum’, whereas two of the current terms emphasize the temporal dimension with the words ‘early’ and ‘delayed’. The alternative terminology also drops the connection to retirement present in the current FRA term. In our opinion, it was important to drop that connection because it makes it seem to people that claiming and retirement go hand in hand when it is actually possible to claim benefits before or after retirement. It is also worth noting that the alternative MaxBA refers to a specific age point, whereas the term it replaces, DRC, refers to the increase in benefit that accrues over a range of years. The MaxBA term reflects a concept of final benefit level, while the DRC incorporates a concept of marginal benefit changes.
We evaluate the impacts of the new terminology. Our design does not allow us to pinpoint which feature of the change (the clarity, the focus on relative benefit amounts, or the drop of the connection to retirement) is responsible for the effects.
We were interested in studying not only whether the terminology has significant effects but also whether these effects vary depending on the way we present the information. It could be that using clearer terms is more impactful when the information presentation is dry or complicated and less critical when the information is presented clearly and engagingly. For this reason, we cross-randomized two different presentations of the information treatment, resulting in a 2 × 2 experimental design that allows us to analyze the heterogeneity of treatment effects by treatment condition.
2. The experiment
To evaluate the impact of these alternative terms, we designed a survey with an embedded experiment for the UAS, a probability sample of the US population. The UAS has more than 6,000 participants answering surveys on various topics.Footnote 5
A beneficial aspect of using the UAS as the setting for the experiment is that panelists had answered previous surveys where they had been asked about their intention to retire and claim Social Security benefits and tested on their knowledge of Social Security Programs (Yoong et al., Reference Yoong, Rabinovich and Htay Wah2015). Other surveys had measured their levels of financial literacy, cognitive ability, income, and wealth levels (Alattar et al., Reference Alattar, Messel and Rogofsky2018). We used baseline information from the respondents to construct illustrative estimates of their future Social Security benefits.
We provided all respondents with the same information about the claiming rules for Social Security but randomized the terminology. Individuals in the treatment group received information that described the treatment using the alternative terminology, and those in the control group received similar information screens but using the current terminology. The treatment and control versions were identical, except for minor phrasing adjustments to accommodate the corresponding terms.
We conducted a further orthogonal randomization, where respondents were assigned to receive the information in one of two conditions. Information condition 1 presented information with language and format modeled after the SSA website. Information condition 2 used language and a design modeled after material in the non-profit organization American Association of Retired Persons (AARP) and the Consumer Financial Protection Bureau (CFPB) websites and a graph illustrating the trade-off between increased monthly payments and early claiming.
Assignment to one of the two information conditions was orthogonal to the assignment of the primary treatment (current or alternative terms). Considering this further randomization, we end up with four groups: two treatment groups that receive information using the alternative terms (in either of the two information conditions) and two control groups receiving information using the current terminology (in either of the two conditions).
Figure 1 shows the information screen with control (panel A) and treatment (panel B) wording as seen by respondents assigned to the first information condition. The information screens for those in the control and treatment groups are similar except for the terminology and minor phrasing adjustments to accommodate the corresponding terms.Footnote 6

Figure 1. Information screens (condition 1). (A) Current terminology (control group). (B) Alternative terminology (treatment group).
Information condition 2 consists of two screens. The first screen gives a text-based description of the trade-off between claiming ages. The second screen shows a graphical illustration of the relationship between claiming ages and monthly benefits.
Figure 2 shows the versions of the screens for the information condition 2: panel A shows the screens for the control group, and panel B shows the corresponding ones for the treatment group.

Figure 2. Information screens (condition 2). (A) Current terminology (control group). (B) Alternative terminology (treatment group).
The goal was to make the screens as similar as possible across treatment groups and ensure no differences in the information content. However, due to the grammatical adjustments necessary to accommodate the different terms, the screens using the alternative terms are slightly shorter. Information condition 1 contains 262 words in the control group version (current terminology) and 247 in the treatment group version. Information condition 2 has 165 words in the control group version and 160 in the treatment group version.
After respondents were exposed to their assigned information screens, they were asked to indicate the age at which they would claim Social Security retirement benefits and the age at which they would retire. Next, respondents were asked questions to assess their knowledge of various aspects of the Social Security retirement program. The survey then included a set of three vignette-based questions. The vignettes aimed to obtain additional insights into respondents' behavioral responses to their assigned treatment and enable comparisons across respondents by soliciting hypothetical claiming ages based on standardized profiles. Each consisted of a short text describing a character at or approaching EEA deciding when to claim Social Security retirement benefits. The first vignette describes a 62-year-old man in good health, earning $2,300 per month, who would make close to that amount if he stopped working and claimed Social Security retirement benefits at that point. The character in the second vignette is a 61-year-old woman in charge of a teenage granddaughter, earning $3,500 per month and eligible for $2,000 in monthly benefits if claimed as soon as she becomes eligible. The character in the third vignette has higher earnings than the first two and has saved in a 401(k) plan. Finally, respondents were directly asked about their preferences concerning the terms. The complete questionnaire appears in online Appendix 1.
Our analysis also uses data collected from the first and second waves of ‘What Do People Know About Social Security’, WDPK-w1 and WDPK-w2 from now on, a comprehensive survey on retirement and SSA-program literacy in the UAS (Yoong et al., Reference Yoong, Rabinovich and Htay Wah2015).Footnote 7 The WDPK surveys explore Social Security literacy and its association with retirement planning. These surveys are among a set of core surveys that UAS panel members complete every two years, allowing the examination of changes over time. Eighty-nine percent of our respondents had answered the WDPK before the experiment. Seventy-two percent of our study participants had completed the second round of the survey after our study by the time of analysis. Hence, we have a baseline for 89% of the sample and a follow-up for 72%. We purposefully designed a subset of the questions in the experiment to be similar to those in the WDPK surveys, thus capturing the same concepts and allowing us to use posterior rounds of the WDPK to examine whether treatment effects on knowledge persist over time. We use our participants' responses to questions about intentions to claim Social Security retirement benefits in WDPK-w1 as the baseline measure for claiming intentions and the responses to the same question in WDPK-w2 to assess any persistence of treatment effects on that variable.
3. Main results
Out of 4,200 invited individuals, we obtained a sample size of 3,458 – a response rate of 82.3%. Table 2 shows the demographic characteristics of individuals in the treatment and control groups. The control group (current terms) had 1,678 respondents, of whom 826 were in information condition 1, and 852 were in information condition 2. The treatment group (alternative terms) had 1,727 respondents, of whom 838 were in condition 1, and 889 were in condition 2. Overall, the randomization worked well. There were no statistically significant differences between control and treatment groups at the 5% level regarding gender, age, and other demographic characteristics or labor force status. Moreover, all variables in Table 2 cannot jointly predict assignment to the alternative terms group (p-value 0.89).
Table 2. Demographic characteristics
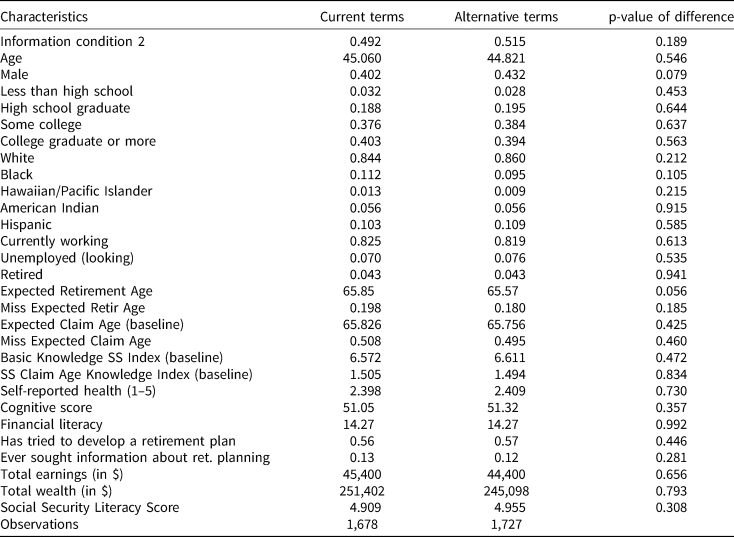
Unweighted means. p-value of test that all baseline variables jointly predict treatment status = 0.89.
The baseline levels on the variables most related to the experiment's outcomes are particularly important: knowledge about Social Security claiming ages and intended retirement and claiming ages. The WDPK-w1 produced two knowledge indices, one about general literacy on Social Security, Basic Knowledge SS Index, and one more precisely aligned with the information we present that focuses on knowledge about claiming ages, SS Claim Age Knowledge Index. Our sample is relatively well balanced on these knowledge indices, with the alternative terms group slightly over-performing in the basic index and slightly underperforming in the ages index. The alternative terms group also has a somewhat lower baseline intended claiming age, but the difference is not statistically significant, and a slightly lower baseline expected retirement age, which is marginally significant. Though it is not surprising to see one such difference among the 26 variables tested, this difference could matter because expected retirement and claiming ages are strongly positively correlated. Baseline expected retirement and claiming ages at baseline predict post-intervention outcomes. Hence, this unbalance would mean we were less likely to find positive effects of the alternative terms, ceteris paribus. The combined differences in claiming and retirement ages at baseline and in the knowledge index about claiming ages hence suggest a slight negative bias against findings that support our central hypothesis.
3.1 Effects on knowledge
We show that the alternative terminology is related to an increased understanding of Social Security rules and lower time spent on the information screens. Respondents in the treatment group spent less time reading the information but learned more from the information presented. Panel A of Figure 3 shows the cumulative distribution of the scores in the quiz about the information shown: those in the treatment group answered more questions correctly (the p-value for the Wilcoxon test of the differences across the two groups = 0.008).

Figure 3. Cumulative distribution functions of knowledge score and time spent reading information screens. (A) Correct answers to knowledge questions. (B) Seconds spent on information screens.
Note: Panel A shows the cumulative distribution function for the number of test questions answered correctly. p-value for the Wilcoxon test for equality of distribution equals 0.008, N = 3,405. The average number of correct answers was 5.8 in the treatment and 5.6 in the control group. Panel B shows the cumulative distribution function for the number of seconds respondents spend on the information screens. p-value for the Kolmogorov–Smirnov test for equality of distribution equals 0.046, N = 3,219.
Panel B shows the Cumulative Distribution Function (CDF) for the number of seconds respondents spent on the information screens. Respondents in the treatment group spent less time on the information screens than those in the control group (40 s vs. 42.5 s; p-value of the difference = 0.03). This difference is likely explained, at least partly, by the lower word count in the alternative terms' version of the information screens. As described in Section 2, the alternative terminology versions of the information screens have 15 fewer words (6.1%) under information condition 1 and 5 fewer words (3%) under information condition 2.Footnote 8
Column 1 of Table 3 compares how respondents fared in quizzes about the Social Security rules across the treatment and control groups. The first estimated coefficient in the table corresponds to a regression where the dependent variable is the fraction of questions answered correctly on the treatment dummy, alternative terms, an indicator that equals one for respondents assigned to the information using the alternative terms. It yielded a statistically significant coefficient of 0.019 (p-value = 0.008), implying that those exposed to the alternative terms were about two percentage points more likely to answer any given question correctly. On average, respondents got 75% of those questions correct, so assigning a respondent to the alternative terms increases the number of correct responses by 3%.
Table 3. Impacts of terminology on Social Security knowledge

Each row represents a separate regression equation. The dependent variables of interest are whether a question was answered correctly (or, in the case of the first row, the fraction of correct answers). The independent variable is the treatment status dummy (a dummy for alternative terms treatment). Models include baseline levels of Social Security as controls (pre-experiment).
The remaining rows show the results of running separate regressions where the dependent variable is a dummy indicating a correct answer to the question. The coefficients can be interpreted as the incremental change in the probability of getting a correct answer for that question given exposure to the alternative terms. In particular, treated respondents were more likely to correctly identify whether benefits are affected by claiming age (second row in Table 3, coefficient = 0.023); whether benefits must be claimed at retirement (fourth row, coefficient = 0.024); the earliest age for receiving retirement benefits (seventh row, coefficient = 0.022, statistically insignificant); and correctly answer and a vignette question about claiming at age 68 (ninth row, coefficient = 0.050). Reassuringly, there was no effect on whether benefits are adjusted for inflation (third row), which serves as a falsification check as it is unrelated to the terminology and the information we provided. The overall effect on knowledge was similar across genders.
3.2 Effects on claiming and retirement intentions
Our focus turns to effects on intended claiming ages. Given the obvious practical difficulties in studying the impact of information and framing on actual claiming behavior, researchers have instead used survey responses to questions about intended or intended claiming (Liebman and Luttmer, Reference Liebman and Luttmer2012; Brown et al., Reference Brown, Kapteyn and Mitchell2016). Online Appendix 2 analyzes whether intended claiming ages are likely to be good proxies for actual claiming ages. There, we first compare how the distribution of intended claiming ages (pre-intervention) compares with actual claiming ages in the population. We cannot compare intended and actual claiming ages accurately because the data correspond to different cohorts. However, we show that the ‘intended’ and ‘actual’ distributions have some similarities, such as the peaks at 62 and between 65 and the full retirement age, but also some significant differences, such as a higher frequency of age 70 among intended claiming. We also show that intended claiming ages correlate significantly with the variables that we know should be related to actual claiming (such as subjective life expectancy and spousal age differences) and with the variables that other research has established as significant determinants of actual claiming age (such as self-reported health). However, this analysis does not imply that the results we find for intended claiming age will necessarily translate to effects on actual claiming ages.
We now analyze the differences in post-intervention intended claiming ages across treatment groups. Panel A of Figure 4 shows the cumulative distribution function of intended claiming ages. Overall, respondents in the control group intend to claim at earlier ages than those in the treatment group. The figure depicts a pattern in which the treatment shifts some respondents who would have otherwise claimed at ages 62–64 toward claiming at 65. The cumulative probability is almost identical at 65. Then, the gaps in the CDFs widen between ages 66 and 69, suggesting that the alternative terms push some who would have claimed between 66 and 69 toward claiming at 70.

Figure 4. The effect of the alternative terminology on intended claiming age. (A) CDF of intended claiming age. (B) Proportion of responses across age groups.
Note: Panel A shows the cumulative distribution function for intended claiming ages by treatment status. p-value for the Wilcoxon test for equality of distribution equals 0.16, N = 3,405. Panel B shows the proportion of respondents across treatments in the 62–64, 65, 66–69, and 70 claiming age groups. The black bars show the distribution for those assigned to the alternative terms condition, and the gray bars show the distribution for those assigned to the current terms condition. The range plots show 95% confidence intervals of the difference across the two groups. p-value of differences equal 0.13, 0.41, 0.04, and 0.01, respectively, N = 3,405.
Panel B illustrates this by showing the proportion claiming at four intervals: between 62 and 64 (close to the earliest eligibility); at age 65; between 66 and 69 (which includes the full retirement age); and at 70. The proportion in the earliest claiming ages is higher among the current terms group than in the alternative terms group (19% vs. 17%, p-value of difference = 0.13). In comparison, the proportion claiming in the latest age group is higher under the alternative terms (25% vs. 21%, p-value = 0.02).
Table 4 shows the results of regressing the intended claiming age on the treatment dummy and a set of control variables. The model without controls in the first column indicates that the alternative terminology increased claiming ages by 0.145 years. To further improve precision and to account for the higher level of the expected retirement age in the control group at baseline, we also controlled for intended claiming and retirement ages pre-intervention, using the linked data from WDPK-w1.Footnote 9 This raised the coefficient's magnitude and accuracy (the standard error dropped from 0.09 to 0.08). The coefficient in this model, shown in column 4, is statistically significant at the 5% level (p-value = 0.016).
Table 4. Impacts of terminology on expected claiming age

Standard errors in parentheses.
***p < 0.01, **p < 0.05, *p < 0.1.
The independent variable is the age at which the respondent plans to claim Social Security retirement benefits. The omitted indicator for race is ‘Asian/Native American/Pacific Islander or other’.
a Missing baseline claiming is a dummy variable indicating that the observation for expected claiming age at baseline is missing.
b Missing retirement claiming is a dummy variable indicating that expected claiming age at baseline is missing.
c In addition to the controls shown, columns four to six include education variables (16 dummies indicating highest grade achieved, from less than 1st grade to doctoral degree), yearly household income (16 indicators, from ‘less than 5,000’ to ‘150,000 or more’).
The coefficient of 0.19 represents an increase in the average claiming age of 2.3 months. The corresponding coefficient for men only is higher (0.27) and more than double the magnitude of the one for women (0.12). Results from specifications with alternative sets of controls do not differ qualitatively (see Table A.3.1 in online Appendix 3).
On average, as shown in Table 5, individuals presented with the alternative terms also chose later retirement ages (the relationship is stronger for men). The magnitude of the coefficient is somewhat larger than in the regressions of claiming ages. However, standard errors are also larger; thus, coefficients are only marginally significant or insignificant in the overall sample. The larger standard error is explained by the fact that the retirement age has a more extensive range since people may choose to retire at any age rather than at the narrower interval of 62–70 for claiming age.
Table 5. Impacts of terminology on expected retirement age

a Independent variable is the age at which respondent plans to retire.
b Indicator for difference between expected retirement and claiming age takes the value of 1 if expected claiming age = retirement age and 0 if expected claiming age ≠ retirement age.
c Difference between expected retirement and claiming age (expected retirement age – expected claiming age).
d Indicator for respondent selecting the age that corresponds to their Full Retirement Age based on their birth year (66 or 67). Controls include baseline retirement and claiming age, demographic controls (age, gender, race, ethnicity, and highest education achieved), and other controls (labor force status and household income). Standard errors in parentheses. ***p < 0.01, **p < 0.05, *p < 0.1.
One may have expected the effect on retirement age to be lower than on claiming age because the information treatment was specifically about claiming ages. We consider two possible explanations for the larger point estimate. First, it may be an artifact of the larger standard error (i.e., the true effect is closer to zero). Indeed, there is considerable overlap in the confidence intervals of the claiming and retirement age coefficients. Second, being randomized to the alternative terminology improved the understanding of the fact that retirement and claiming need not happen at the same time. Those assigned to the alternative terms were more likely to correctly answer the true or false question of ‘Benefits have to be claimed at retirement’ (see Table 3). Hence, the alternative terminology may have led some people to not increase their intended claiming age but to increase their retirement age. Indeed, we find that assignment to alternative terms is negatively related to an indicator variable for the respondent choosing the same age for claiming age and retirement age and positively associated with the difference between retirement age and claiming age. These results, shown in the second panel of Table 5, are small and not statistically significant but could have contributed to the higher point estimate for expected retirement age.
The alternative terminology could affect the likelihood of choosing salient ages for the intended claiming age. As discussed in the introduction, the current terminology makes the temporal dimension more salient for age 62 (‘early eligibility’) and makes the FRA salient by connecting it with retirement. On the other hand, the alternative terminology makes age 70 more salient by highlighting it as the age where the monthly benefit is ‘maximum’. In panel C, we present the result of models that estimate whether the alternative terminology changed the likelihood of choosing each of these salient ages. The alternative terms led to a lower likelihood of expecting to claim at age 62 and at the respondents' FRA (calculated based on the respondent's age), though these coefficients are statistically insignificant. On the other hand, those in the alternative terms group were more likely to claim at age 70.
When presented with the characters in the standardized vignettes, respondents in the treatment condition also recommended later claiming ages (see Table 6). For two of the three vignettes, there was a statistically significant difference between the treatment and control arms. The effects are of a similar magnitude as those on the respondents' own planned claiming age. On average, respondents in the alternative terms condition recommended claiming 0.17 years (about two months) later than those exposed to the current terms.
Table 6. Impacts of terminology on recommended claiming age to fictional characters

Standard errors in parentheses.
***p < 0.01, **p < 0.05, *p < 0.1.
The dependent variable is the age at which vignette characters should claim Social Security benefits. Regressions include baseline retirement and age, the expected retirement age before the respondent received the information treatment, demographic controls (age, gender, race, ethnicity, and highest education achieved), and other controls (labor force status dummies and household income).
3.3 Heterogeneity
As described in Section 2, two information conditions were cross-randomized with the terminology (Figures 1 and 2). To understand whether the impact of the terminology differed across the two information conditions, we estimated models where the outcome variable was regressed against an indicator of assignment to the alternative terms, a variable indicating assignment to the second information condition), and the interaction of the two.
Panel A of Table 7 shows the results when the outcome is intended claiming age. Being randomized to information condition 2 was associated with an increase in intended claiming age, but the coefficient is small and statistically insignificant. The insignificant coefficient for the interaction of alternative terms and information condition 2 shows that the effect of the terminology was not significantly different across the two information conditions. The point estimate would suggest that the terminology impact was larger in the second condition (0.250) than in the first condition (0.124).
Table 7. Heterogeneity of the terminology impacts on expected claiming age

The independent variable is age at which the respondent plans to claim Social Security retirement benefits. In panel A, the independent variables are alternative terms, a dummy for being assigned to information condition 1, and the interaction of alternative terms and information condition 1. In panel B, the independent variables are alternative terms, a background variable measured at some point prior to the experiment, and an interaction between the background variable and alternative terms. The background variables are demeaned and standardized. Sample sizes differ across columns depending on the availability of the background variables. In all cases, the background variable is demeaned and standardized to facilitate comparison across columns. All regressions also include the following control variables: baseline retirement, missing baseline retirement, demographics, education, and labor force status dummies. Means and standard deviations are unweighted. Standard errors in parentheses. ***p < 0.01, **p < 0.05, *p < 0.1.
Online Appendix 3 shows the results of estimating this exact model for two additional outcome variables: average correct responses to the knowledge test and recommended claiming age for the vignette characters. We find that the effect of the alternative terminology was not significantly different across the two information conditions, neither on knowledge nor on the recommended claiming ages for the vignette characters (Table A.3.2).
We could expect the treatment effects to vary across different groups of people. First, as shown in Shoven and Slavov (Reference Shoven and Slavov2014), delaying claiming increases the expected present value of benefits for individuals and couples with specific characteristics (given by age, marital status, and whether there are one or two earners in the household). Primary earners in married couples have the most to gain (Sass et al., Reference Sass, Sun and Webb2013). The effect of the treatment on claiming age could also depend on whether the individual will face liquidity constraints, as many claimants face (Goda et al., Reference Goda, Ramnath, Shoven and Slavov2018). On the other hand, the same and different characteristics may affect the insurance value of the annuitized income. For instance, increasing the monthly benefit may be more important for those without other sources of retirement income. Perhaps more importantly, given the nature of our experiment, clarifying the terminology may be more critical for those with low levels of literacy and cognition and hence face more difficulties in understanding information that uses unclear terminology.
We linked our data with earlier UAS surveys with information on variables that capture financial literacy, previously assessed measures of Social Security knowledge, cognitive ability, years of education, and household wealth. All the data we used for the interactions came from surveys fielded before this experiment.Footnote 10 We estimated regression models of intended claiming age that include interactions between treatment and each of these variables and several controls.
Panel B of Table 7 shows the results of estimating these models. To facilitate comparisons, we demeaned and standardized the variables that we interact with alternative terms. Although the interactions are not always statistically significant, the coefficients are negative in all cases. This points to larger effects of the alternative terms among those with low financial literacy, Social Security knowledge, cognitive ability, and educational attainment and those who live in households with little household wealth.
To illustrate the magnitude of the interaction effect, we take the example of financial literacy. For a respondent with a financial literacy score one standard deviation below the mean, the effect of being assigned to the alternative terminology would be 0.369 (0.205 + 0.164) of a year. In contrast, the effect would be only 0.041 for someone with a financial literacy score one standard deviation above the mean.
We also estimated the effect of the intervention on other demographic characteristics. As shown above in Tables 4 and 5, the impact of the intervention on claiming age was stronger for men than for women. However, there were no significant gender differences in the recommendations to vignette characters.Footnote 11 We also find that the impact of the intervention is positive for all age groups, though it is strongest in middle age.Footnote 12 We did not find significant differences by marital status.
3.4 Persistence of treatment effects
We linked our data to the WDPK-w2 survey, which covers some of our survey's same knowledge test items and includes a variable that measures claiming intentions. WDPK-w2 was administered to individual respondents on a date that depended on their time of enrollment to the UAS, between 1 and 510 days after the experiment (with a median of 228 days). Table A.3.3 in the online Appendix shows that the treatment and control groups remain balanced on ex-ante background characteristics.
We first discuss the persistence of the knowledge effects. Column 2 of Table 3 shows the effects of being assigned to the alternative terms group on average test scores and the individual knowledge questions. The results are remarkably consistent. The effect on test scores was 0.16, only 0.03 points smaller than when using the contemporaneous survey, and the effect is still statistically significant at the 5% level. Rows 2–5 and 7–9 show the results for test items that are comparable to the ones analyzed in subsection A. Most coefficients are similar in magnitude, particularly those in rows 2, 8, and 9, which are also statistically significant at the 10% or 5% levels.
The WDPK-w2 survey also elicits intended claiming ages. However, unlike our survey, respondents who have not claimed Social Security benefits are asked whether they know the age when they will claim their benefits. Only if they respond ‘yes’ are they asked about their intended claiming age. This differs from our experiment survey, where all respondents are asked for their best estimate even if they do not know when they will claim. We also treat the first question (whether the respondent knows when she will claim benefits) as an outcome variable to analyze whether the treatment led to higher knowledge and claiming plans.
Table 8 presents the results using these data. The dependent variable in the first column is an indicator of the respondent stating that she does not know when she will claim. For the entire sample (first panel), the point estimate implies that being assigned to the alternative terms results in a three-percentage point increase in the probability that the individual knows when she will claim. The second and third panels show the results separately by gender. There is a marginally statistically significant effect for female respondents, implying that women in the treatment group become (and remain) four percentage points more likely to know when they will claim. The fourth and fifth panels break up the sample by those above and below the median in financial literacy. Results show a larger point estimate for those with lower financial literacy.
Table 8. Impact of terminology on claiming intentions on posterior surveys

Models under the balanced sample are regressions where the dependent variable is in differences. The ‘balanced panel sample’ includes only observations with a response to the claiming age intentions in both a prior and posterior survey. Each row represents separate regression equations. The independent variable is the treatment status dummy (a dummy for alternative terms treatment). Models include baseline levels of Social Security claiming and retirement intentions as controls (pre-experiment). ***p < 0.01, **p < 0.05, *p < 0.1.
The WDPK survey also asks married respondents whether they know if their spouses will claim Social Security and, if so, when they will claim. Column 2 shows the results using this variable as the dependent one. Among female respondents, being exposed to the alternative terms was related to a higher likelihood of knowing when their spouses will claim. A possible interpretation of this result is that increased understanding from the alternative terms heightened married women's interest and subsequent learning of their spouses' claiming intentions but not for men, possibly due to the larger proportion of couples where the men have the higher Social Security earnings record.
While increased knowledge of claiming age is consistent with our finding that the alternative terms lead to improved learning, it also makes it more challenging to study the effect on intended claiming age in the posterior survey, as it implies the sample of respondents with a missing dependent variable is affected by treatment status. To account for that selection issue, we estimate these regressions in differences. Among the sample for whom we have both a ‘claiming age’ from the pre and post surveys (WDPK-w1 and WDPK-w2), we regress the difference in claiming age (the ‘post-treatment’ value minus the ‘baseline’ value) against the treatment indicator.
The main reason for estimating this model is to assess how the effect on claiming age has persisted. However, in addition to the time elapsed since the treatment, there are differences in the regression specification and sample selection to the results presented in Table 4. Hence, to be able to make direct comparisons and attribute any discrepancies to the passage of time, we added a column to Table 8 which uses the claiming age dependent variable from the experimental survey as in Table 4 but runs the regressions in differences and excludes respondents who do not have a claiming age answer in all three surveys (i.e., it excludes observations for panelists who did not answer the claiming age question in either of the WDPK surveys). In this way, the model is comparable to that using the posterior measure.
Column 3 presents the results with the contemporaneous measure. The coefficient is 0.198, which, not surprisingly, is very similar to the result from the fourth column of Table 4. Using the posterior measure halves the coefficient to 0.100, which becomes statistically insignificant. This suggests at least some decay of the impact of the terminology on claiming age. The persistence of the effects among the groups where the impacts had been most substantial is particularly of interest. As seen in the second to last panel, the effect of the alternative terminology among those with low levels of financial literacy remains statistically significant and almost unchanged when using the posterior survey.Footnote 13,Footnote 14 Table A.3.4 in the online Appendix shows these results broken down for respondents who answered the posterior survey before and after the median number of days between them. Overall, coefficients are larger for respondents who answered the posterior survey earlier, though the sample sizes are too small, and the standard errors become too large to make meaningful comparisons.
Overall, the analysis of these subsequent datasets indicates a strong persistence of the effect on knowledge and a weaker persistence of the impact on claiming intentions.
3.5 Stated preference for terminology
In addition to its effects on knowledge and claiming intentions, survey respondents prefer the alternative terms and feel they understand them better. After the initial experiments, we asked whether respondents preferred ‘Early Eligibility Age’ or ‘Minimum Benefit Age’, and ‘Full Retirement Age’ or ‘Standard Benefit Age’. Next, respondents were asked to compare the clarity of two equivalent statements, one using the term ‘Delayed Retirement Credits’ and the other using the ‘Maximum Benefit Age’ term as shown below:
Statement A. ‘Individuals over 66 or 67 (depending on the year of birth) can earn Delayed Retirement Credits by delaying claiming Social Security up to age 70, regardless of whether they are still working or not.’
Statement B. ‘Individuals over 66 or 67 (depending on the year of birth) can delay claiming Social Security and have their benefits increase up to the Maximum-Benefit Age (70), regardless of whether they are still working or not.’
The first column of Table 9 shows that Minimum Benefit Age was preferred to Early Eligibility Age by 61% to 39%; Standard Benefit Age to Full Retirement Age by 52% to 48%. Forty-six percent of respondents thought the statement with the term Maximum Benefit Age was clearer than the statement using Delayed Retirement Credits, while only 10% thought the opposite; 34% said both were equally clear, and 11% said neither was clear.
Table 9. Preferred terms by survey respondents

Some status quo bias is apparent, as preferences for the current terms were higher among respondents initially exposed to them than those exposed to the alternative terms. The percentage who preferred Early Eligibility Age, Full Retirement Age, and Delayed Retirement Credits was higher in the control group than in the treatment group. However, even accounting for this, even those who had not been initially exposed to the alternative terms found Maximum Benefit Age significantly clearer than Delayed Retirement Credits, and close to half preferred Minimum Benefit Age to Early Eligibility Age. A clear majority of those in the alternative terms group preferred all the alternative terms. Given the status quo bias, it is conceivable that the preferences for the alternative terms would become more pronounced if the alternative terminology were adopted in a broad range of dissemination materials. On the other hand, it is also conceivable that the novelty of the alternative terms caused respondents to pay more attention to the questions that employed them.
4. Conclusions
The terminology currently used to explain the trade-offs in the claiming decision does not help people to understand their options adequately and may be leading some people to claim Social Security retirement benefits earlier than optimal. Our findings show that a simple intervention – slight modifications of a few keywords – can improve individuals' understanding of the Social Security retirement claiming decision problem and, as a result, change their intended claiming and retirement ages. Furthermore, at least some of these effects can persist over time.
These behavioral changes could come about either because the revised terms make understanding the incentives embedded in the benefit structure easier or because of the increased saliency of the gains from delaying claiming. One limitation of this work is that we cannot differentiate between these two plausible mechanisms, though we do show that the alternative terminology leads to persistently improved understanding. People understand better the trade-offs as information becomes clearer – and better understanding likely leads to better decision-making.
It is feasible to implement this intervention uniformly at the national level, to immediate effect – improving clarity for millions of people, perhaps leading to improved decisions – while incurring only set-up costs. It is likely cost-effective compared to other practices, such as mailing individual Social Security Statements.
The actual magnitude of the effect of changing the terminology in such a rollout is unknowable. The effect on the intended claiming age may translate into a lesser effect on the actual claiming age due to constraints not accounted for in this experiment. It may be easier to change hypothetical responses than real-world behavior. Yet it is also conceivable that the consequences will be more prominent in practice. The effect may be amplified through repeated exposure to information from the SSA itself and other government agencies, NGOs such as AARP, and media providing education about claiming Social Security benefits since all of them follow the SSA in terms of the terminology used. The ultimate effect of the information could manifest not only from direct exposure but also from indirect exposure from cascade effects of social learning.
Overall, the results of this study suggest micro-changes in information policy can have measurable effects on peoples' retirement decision-making and, potentially, on their financial security.
Supplementary material
The supplementary material for this article can be found at https://doi.org/10.1017/S1474747222000269
Financial support
Research reported in this publication was supported by the National Institute on Aging of the National Institutes of Health and the Social Security Administration, under Award No. 3R01AG020717. The content is solely the authors' responsibility and does not necessarily represent the official views of the National Institutes of Health or the Social Security Administration. The study is registered in the AEA RCT Registry with the registry number AEARCTR-0003106. We thank Barbara Smith, David Rogofsky, Richard Chard, the editor, and two anonymous referees for their invaluable input. We also thank Arie Kapteyn, Tania Gutsche, and participants at the Roybal Center for Decision Making's annual meeting for their valuable comments. Programming the Internet survey was led by Bart Orriens; this research project would not have been possible without him.


 Open access