Introduction
Storfjorden is located in the southeast of the Svalbard archipelago between Spitsbergen, Barentsoya and Edgeoya (Fig. 1). Inner Storfjorden, north of its sill at 77° N, has an area of about 13 000 km2 and a volume of 7.5 × 10¹¹ m3. It is part of the Arctic shelf, which is the main supplier of Arctic deep and intermediate water. Densification of sea water occurs through cooling and brine rejection during ice formation, and is stronger on shelves where convection can reach the bottom, while the Atlantic Water layer prevents such convection in the Arctic Ocean.

Fig. 1. Storfjorden, situated between spitsbergen, Barentsøya and Edgeøya, and the position of the field measurements: thick lines are tracks from argos buoys with start and end dates at respective positions; long time periods without data are presented as dashed lines. stars mark the moorings at the shelf break (a) and the moored adcp m inner storfjorden (B). filled diamonds represent the summer CTD sections taken in september 1998, july and september 1999, the filled square the CTD from october 1995 and the triangles the measurements from april 1998 (light) and april 1999 (dark). isobaths at 40 m depth intervals are indicated as thin lines.
Previous studies have revealed the presence and outflow of dense brine-enriched shelf water in Storfjorden (Reference MidttunMidttun, 1985), and its downstream modification in Storfjordrenna and along the West Spitsbergen continental slope has been observed (Reference Schauer and FahrbachSchauer and Fahrbach, 1999) and modelled (Reference Jungclaus, Backhaus and FohrmannJungclaus and others, 1995). A maximum salinity of 35.4% due to brine enrichment was observed in 1986 (Reference Quadfasel, Rudels and KurzQuadfasel and others, 1988). The outflow in 1992 was estimated from direct current measurements in the south of Storfjorden to be 1.6 × 10¹² m3, corresponding to an annual mean rate of 0.05 Sv (Reference SchauerSchauer, 1995). Brine rejection from ice formation in a flaw polynya has been shown to be the origin of this water mass (Haarpaintner and others, in press), and the evolution of such a polynya and the ice cover during winter 1997/98 has been observed by high-resolution synthetic aperture radar (ERS-2 SAR) (Reference HaarpaintnerHaarpaintner, 1999). The area north of 78° N and a band several kilometres wide along the Spitsbergen coast was covered with fast ice throughout the winter. The persistent polynya south of 78° N in Storfjorden opened under northerly winds and consisted of up to 6000 km2 of open water and thin new ice with rafting and ridging. According to polynya and ice-production models (Haarpaintner and others, in press), the polynya covered on average one-sixth of the studied 10 000 km2 area and was responsible for approximately two-thirds of the total ice production of about 29 km3. However, the water-mass transformation, i.e. its densification during the freezing season and its return to the initial autumn conditions during melting, has not been documented until now, due to the lack of winter data from inside the fjord.
In the following we combine several datasets to give a comprehensive view of the hydrographic conditions during winter and summer and the different circulation patterns in Storfjorden. We then attempt to relate the observed seasonal water-mass transformation to currents and the thermohaline circulation, and its interannual variability to results from models of polynya evolution and ice formation (Haarpaintner and others, in press) and results from convection models (Reference Chapman and GawarkiewiczChapman and Gawarkiewicz, 1997; Reference ChapmanChapman, 1999).
Data
Between autumn 1997 and summer 1999, field measurements, summarized in Table 1, were undertaken to complement the systematic observation of sea-ice conditions by ERS-2 SAR imagery. Using SAR, the ice cover could be observed in high spatial (100 m) and good temporal (1−2 weeks) resolution and studied in relation to the meteorological data from Hopen Island to calculate ice formation.
Table 1. Acquired data in storfjorden, 1997−99

Meteorological data were provided from the Norwegian Meteorological Institute (DNMI) in 6 h intervals. These are summarized in the section "Interannual variability" and studied in more detail by Reference Haarpaintner, Haugan and GascardHaarpaintner and others (2001). The positions of field measurements are indicated in Figure 1. Hydrographic sections along 19° E between 76°30’N and 78° N were performed with R/V Lance using a Neil Brown conductivity-, temperature- and depth-measuring device (CTD) in September 1998 and a Seabird CTD in July and September 1999. Each station was calibrated with a water sample, resulting in an accuracy of 0.01 ‰ sufficient for our discussion. In April 1998 and April 1999, snow-scooter and helicopter were used to acquire hydrographic profiles taken through the sea ice with a Seabird mini CTD and a mini salinity-, temperature- and depth-measuring device (STD) (SD200) from Sensordata A.S. as back-up. In April 1999, the Seabird was erroneously shut down after the first station, so the back-up data had to be used, which were then calibrated with the Seabird data from the first station. One station from an October 1995 cruise with R/V Antarctica is also used as comparison. ARGOS buoys were deployed on ice floes to observe ice drift between the end of February and April 1999. Three ARGOS tracks are shown in Figure 1 with their respective dates at the start and end positions. On the September 1998 and July 1999 cruises, a ship-borne acoustic Doppler current profiler (ADCP) was used to measure currents along the ship track. An upward-looking ADCP at 81 m depth, and an Aanderaa current meter with conductivity and temperature sensor (RCM-9) at 87 m depth were moored on the east side of inner Storfjorden (77°57.8’N, 20° 17.7’E) between September 1998 and July 1999, measuring in 2h intervals. The conductivity data seem erroneous and were not used. Both ADCPs work at a frequency of 150 kHz and measure the currents in 4 m depth bins. A mooring at the shelf break (76° 13.3’N, 15°32.3’E) in southwest Storfjorden measured the outflow of cold brine-enriched shelf water into the Norwegian Sea from summer 1997 to summer 1999.
Water Masses in Storfjorden: Seasonal Cycle
Storfjorden is positioned just north of the Polar Front (Reference LoengLoeng, 1991), and large variations in water-mass characteristics occur during the seasons. The water masses in inner Storfjorden are mainly of Arctic origin (T < 0°C; s = 34.3−34.8‰). Salinities are too low to originate from Atlantic Water ( T > 3°C; s > 35‰). Water is imported by the East Spitsbergen Current, partly by strong tidal currents through the two sounds, Heley-sundet and Freemansundet, in northeast Storfjorden (Reference SjokartverkNorges Sjokartverk, 1988) and partly by the coastal current which flows around Edgeoya and enters in the southeast (Reference LoengLoeng, 1991). It is presumably from this water mass that the seasonal inner Storfjorden waters form by cooling and freezing in winter and meltwater input in summer. The temperature and salinity profiles from the winter and summer stations taken closest to the centre and deepest part of the fjord, a pool > 160 m deep, are presented in Figure 2.
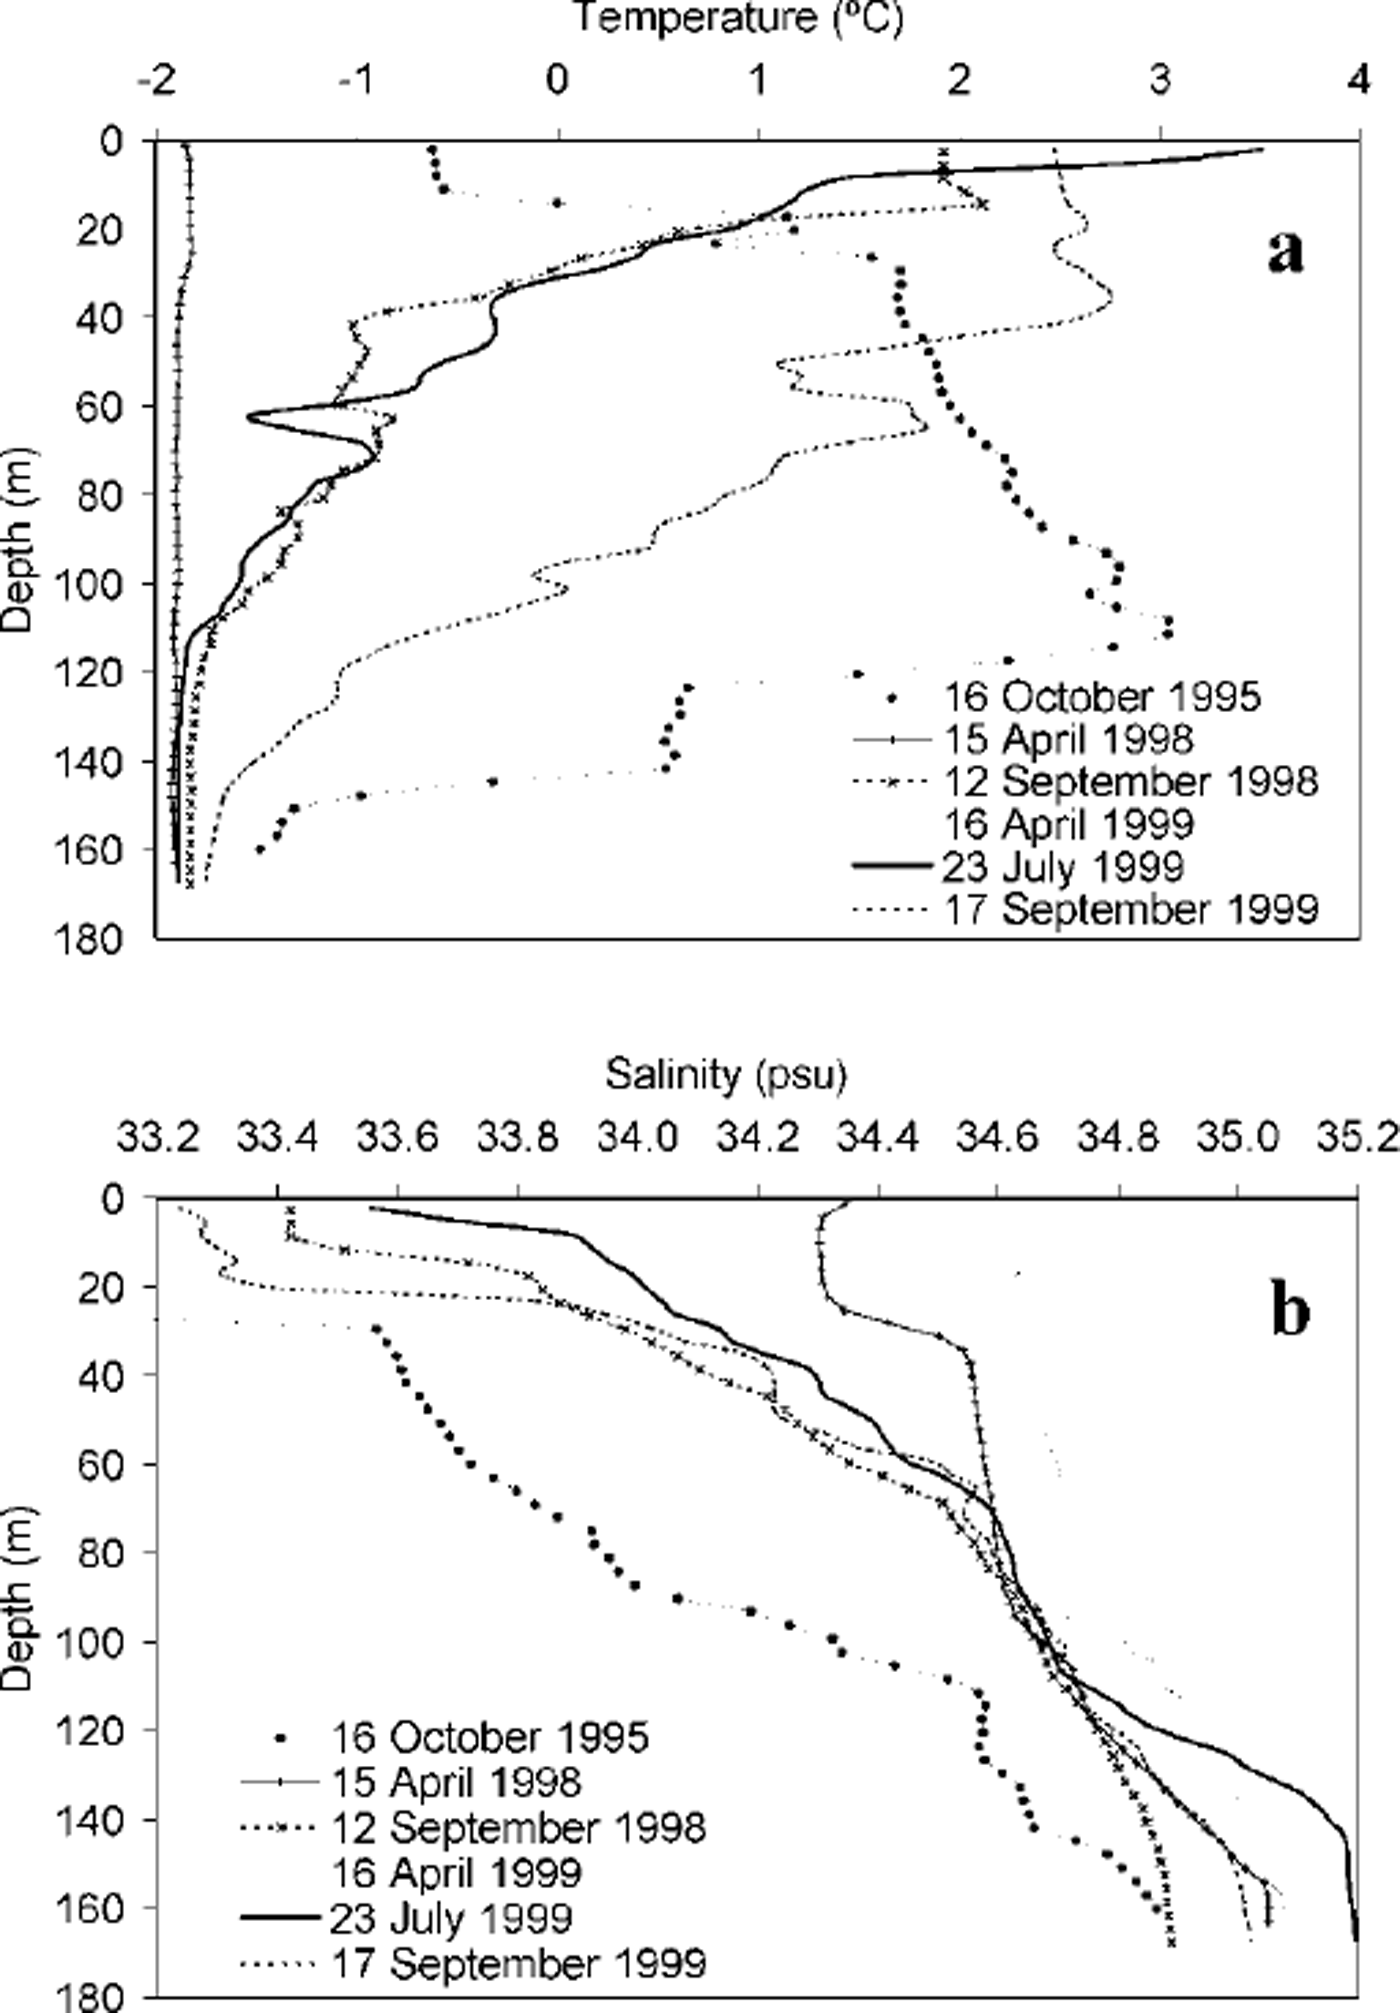
Fig. 2. Hydrographic profiles from the pool in inner storfjorden around 77°30’N, 19° E at indicated dates: (a) temperature and (b) salinity.
Freezing (winter)
Water temperatures in Storfjorden in late summer are between 3°C at the surface and close to freezing temperature at the bottom, indicating brine remnants. As soon as the solar heat flux disappears in autumn, the water column cools down, not only due to the heat loss to the atmosphere, but also due to the advection of Arctic Water (colder than 0°C) by the East Spitsbergen Current and advection of brine-enriched water from shallower shelves, as indicated by the abrupt temperature decrease from 0.5°C to −1.8°C at the mooring (B in Fig. 1) at the end of November and in mid-December 1999 (Fig. 3). The shallow Storfjordbanken might play an important role in providing such cold waters. As expected on a shallow shelf, during ice production the whole water column is cooled down to the freezing point of sea water, between −1.92° and −1.82°C (Fig. 2a). In the centre of Storfjorden, the average temperature difference between September and April over the whole water column is about 2.5°C. The temperature difference can be even higher later in autumn as long as there is heat gain from solar radiation and further south also by advection from the Polar Front, as shown by the temperature profile from October 1995 (Fig. 2a).
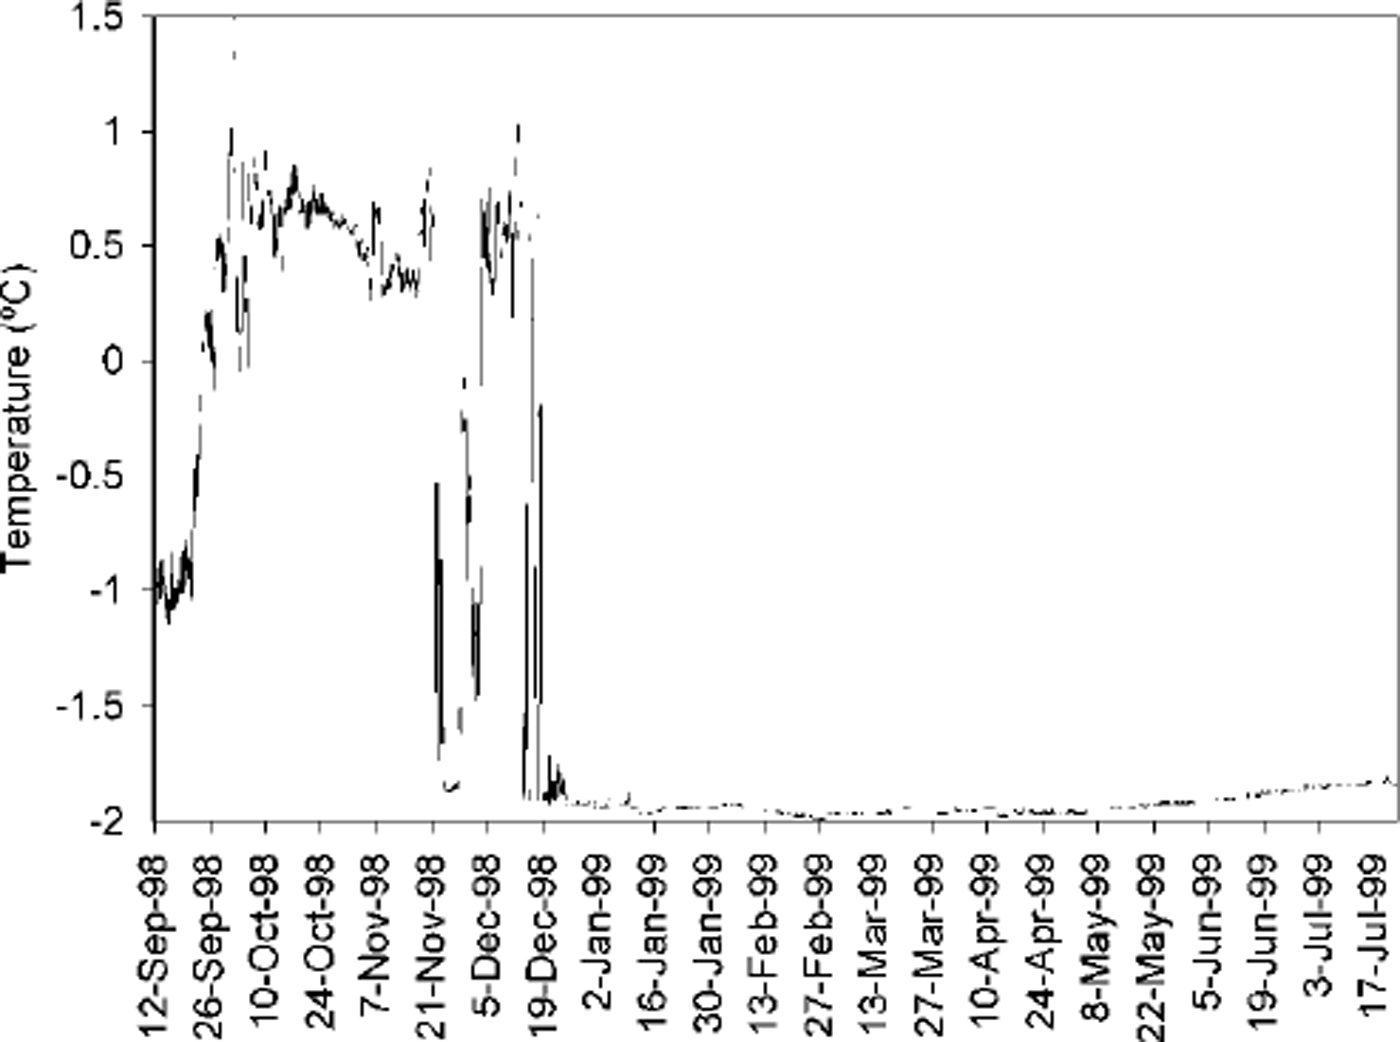
Fig. 3. Temperature during winter at 87 m depth at mooring B (7757.8 N, 20° 17.7 E).
In winter, the salinity increases mainly in the surface layer (Fig. 2b), where fresh water is extracted by ice formation and brine is added to the water column underneath by negative buoyancy. In the middle of Storfjorden, the surface salinity increases by >l‰, from 33.2−33.4% to around 34.5‰, in winter. The bottom salinities increase by about 0.2‰, from 34.8‰ to around 35.0‰, in mid-winter, but may be even higher by the end of the winter season, since salinities of 35.2‰ were measured in July 1999, and of 35.4% in 1986. In the north of Storfjorden, where the shelf was 40 m deep, salinities of 35.3−35.45‰ over the whole water column were measured in April 1999. Since the salinity of an intermediate layer in Storfjorden at around 90 m depth is relatively constant throughout the year, and the bottom salinities increase during the winter, this would suggest that more saline water is formed on shallow northern parts and advected southwards along the bottom into the Storfjorden deep pool. The overall salinity increase in Storfjorden is consistent with the ice volume and a renewal time of about 2 months of the whole Storfjorden waters during winter (Haarpaintner and others, in press).
Melting (summer)
The melting season starts at the end of May, and the water column begins to warm as soon as solar radiation can penetrate, and/or by advection of Arctic Waters, warmed in the shallow Barents Sea. Fresh-water input, by melting of sea ice and river run-off from glacier and snowmelt on land, decreases the salinity of the upper 20 m by > l‰. In late summer a water mass similar to the Spitsbergenbanken Water (Reference LoengLoeng, 1991) occupies the upper 60 m of Storfjorden. This is a mixture of Arctic Water and meltwater, heated by the atmosphere to a characteristic temperature of 1−3°C and with a salinity lower than 34.4%.. We call it Storfjorden Surface Water. Advected Arctic Water occupies the intermediate layer. The salinity of the dense brine-enriched water, trapped in the depression of Storfjorden, is reduced by 0.2‰. In addition to other diffusion processes, the overflow and horizontal currents might also induce turbulence, entraining water from layers deeper than the sill.
In summer, we can thus separate Storfjorden into three layers (Fig. 4): the dense brine-enriched bottom layer (freezing temperature and salinities >34.8‰) at depths greater than the sill of Storfjorden (120m), an Arctic intermediate layer and the Storfjorden Surface Water. The depth limit between the Storfjorden surface and the Arctic intermediate layer sinks down to around 60 m depth during summer with the continuous warming from the atmosphere and freshwater input. In the south of Storfjorden, Polar Front Water, with temperatures of-0.5° to 2.0°C and salinities of 34.8−35.0‰, is formed by mixing of Arctic with Atlantic Water.

Fig. 4. Temperature (a) and salinity (b) transect along 19° E on 23 july 1999.
Circulation in Storfjorden
Several driving forces determine the water circulation in Storfjorden: tides, wind-driven ice and water dynamics, and currents driven by density gradients which are part of the thermohaline circulation, discussed separately in the next section.
Strong currents, resulting from the difference in water level of a half-phase shift between tides inside Storfjorden and the northern Barents Sea (Reference Gjevik, Nost and StraumeGjevik and others, 1994; Reference Kowalik and ProshutinskyKowalik and Proshutinsky, 1995), were observed during a September 1998 cruise through Freemansundet. There was 2−3 m s-1 difference between the absolute ship speed and the ship speed relative to the water. Norges Reference SjokartverkSjokartverk (1988) have reported currents of 4−5 m s"1 in Heleysundet. This suggests that even if mean flows are small through the sounds, tides are important for the exchange of water masses and ice between Storfjorden and the Barents Sea. The tidal signal is clear in the moored ADCP (mooring B in Fig. 1) data inside the fjord with variable current directions and velocities of > 15 cm s−1. An ARGOS buoy deployed in mid-April in the north of Storfjorden reappeared east of Edgeoya after a 3 month blackout of transmission (Fig. 1). The most probable explanation is that it exited Storfjorden through one of the sounds due to strong tidal currents.
In Haarpaintner and others (in press), it was demonstrated that the ice drift in Storfjorden during winter is strongly correlated to the wind. The Storfjorden latent-heat polynya opens under northerly winds, and closes under southerly winds and by freezing. Northerly winds predominate, driving a net southward export of ice into Storfjordrenna and to the West Spitsbergen Current. ARGOS buoys deployed on ice floes in spring 1999 indicate a southwestward ice flow along the Spitsbergen coast (Fig. 1). The average drift speed of the ARGOS buoy between 23 March and 9 April 1999 corresponds to 11 cm s−1. Another buoy, between 28 February and 17 March, was hindered by the coastal fast ice and moved mainly during 2 days in this period with a speed of 17 cm s−1.
Annual mean currents for different depths measured by the moored ADCP (mooring B in Fig. 1) decrease in velocity and spiral to the right with depth (Fig. 5), giving a mean northward flow of 1−2 cm s−1. This is qualitatively similar to the Ekman spiral for a wind-driven current. The mean northward flow along the western coast of Edgeoya would be consistent with a cyclonic surface current (Reference LoengLoeng, 1991). Such a current could be caused by fresh-water river run-off in summer and brine release during winter.
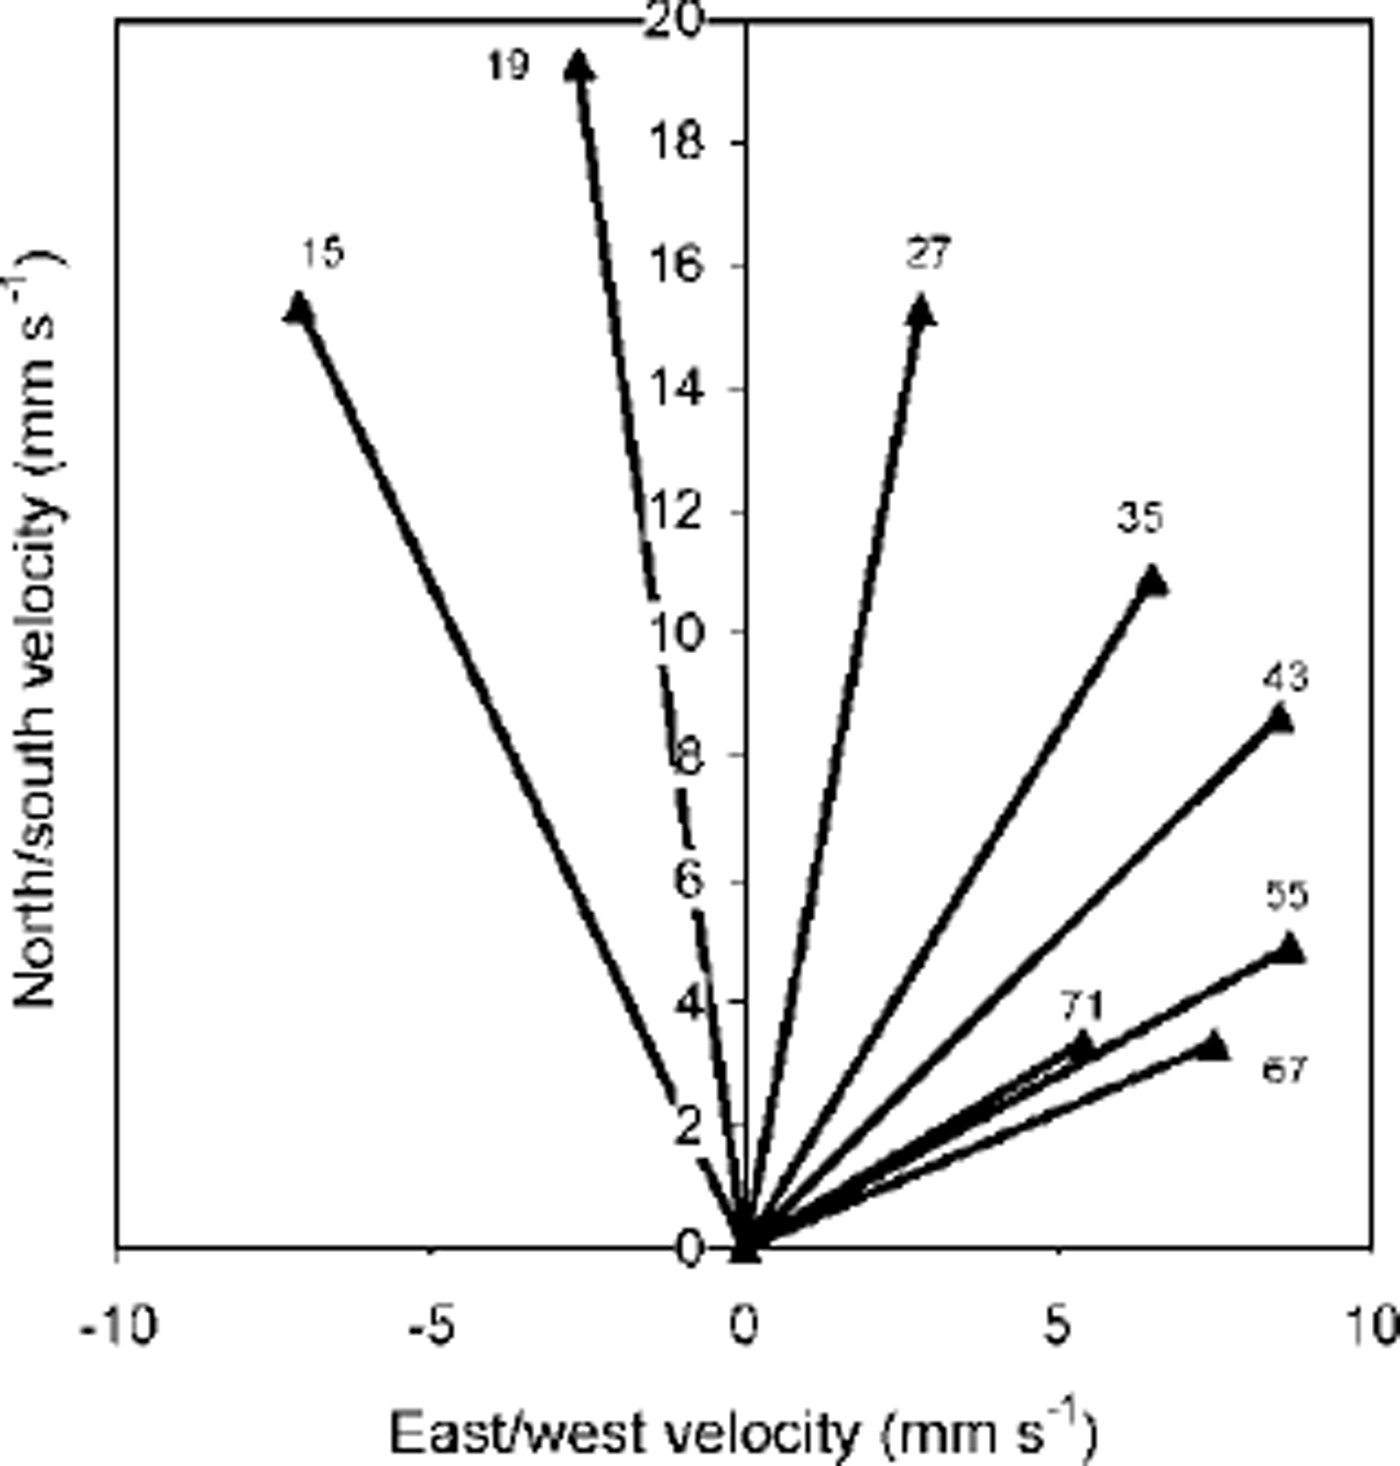
Fig. 5. Current-meter measurements (mooring b) averaged over they ear, at indicated depths (in meters), forming a spiral, comparable to an Ekman spiral for wind-driven currents.
Thermohaline Circulation in Storfjorden
Thermohaline circulation depends on where dense water is formed, how it interacts with topography (plume dynamics along the bottom and overflow above sills) and how it is balanced through horizontal advection when spreading away. Significant dense water formation occurs in Storfjorden, able to increase the bottom salinities by > 0.2‰. Since the salinity of the intermediate layer in Storfjorden at around 90 m is relatively constant throughout the year in the deepest part of the fjord, two scenarios are possible. Either the negative buoyancy forcing due to brine rejection is occurring nearby, but in very localized regions, so that the brine convective plumes have not been observed due to scarce observations, but are strong enough to reach the bottom without mixing with the intermediate layer; or the dense brine-enriched waters have been advected along the bottom from elsewhere in Storfjorden. In the latter case, the above-mentioned measurement of 35.4% in April 1999 from the shallow northern region would indicate the importance of shallow waters in the dense water formation, which in Storfjorden would be located north of 78° N and/or on Storfjordbanken in the southeast. The brine-enriched bottom water collects in the depression of Storfjorden, fills up to the sill depth (120 m) (Fig. 4) and drains out as a gravitational^ driven plume by the end of January until summer (Reference SchauerSchauer, 1995). The estimated residence time of 2 months corresponds to the delay between start of freezing and start of overflow. This outflowing water volume has to be replaced by advection in the upper layers. The balance may be achieved by a difference between the in- and outflow of the cyclonic coastal current and the tidal motion, but there may also be a distinct inflow of surface water driven by buoyancy. A "snapshot" of the currents along 19° E over 17 h is given by the shipborne ADCP during the cruise in july 1999 (Fig. 6a). At the sill at 77° N a strong southward bottom current of 8 cm fl is present, and there is an even stronger northward advection current in the surface layer rather than in an intermediate layer. The baroclinic component, obtained by subtracting the vertical mean current, shows a similar pattern. Subtracting the tidal component using a tidal model (Reference Gjevik, Nost and StraumeGjevik and others, 1994) (Fig. 6b) does not change the feature of southward bottom and northward surface flow, but shows only very weak flows, <2cm s−1, in the intermediate layer between 40 and 80 m depth. In September 1998 (not shown), less saline water is present and the outflow may have already ended. Therefore little coherent surface-bottom shear flow is observed at that time. Three-dimensional models would be necessary to further investigate the advection that balances the bottom-water outflow.

Fig. 6. (a) North/south component of the absolute current along 19° e on 23 july 1999 and (b) with subtracted tidal component (current isolines are every 2 cm s −1; grey is southward, white is northward flow).
The downstream modification of the dense bottom-water plume is discussed in more detail in Reference Schauer and FahrbachSchauer and Fahrbach (1999). According to the mooring data from the shelf break from 1997−99 (Fig. 7), the coldest core from the plumes after winters 1997/98 and 1998/99 reached the shelf break in mid-March and mid-April, respectively. In both cases, this corresponds to a period of about 4 months after the start of ice formation in Storfjorden. The first sign of cooling appears about 1 month before the coldest waters arrive at the shelf break (mid-February and mid-March, respectively). In mooring data from 1994 (Reference Schauer and FahrbachSchauer and Fahrbach, 1999, fig. 6) this continuous cooling during the fourth month is less obvious, but the coldest temperature is also reached about 1 month after the first cooling appears.
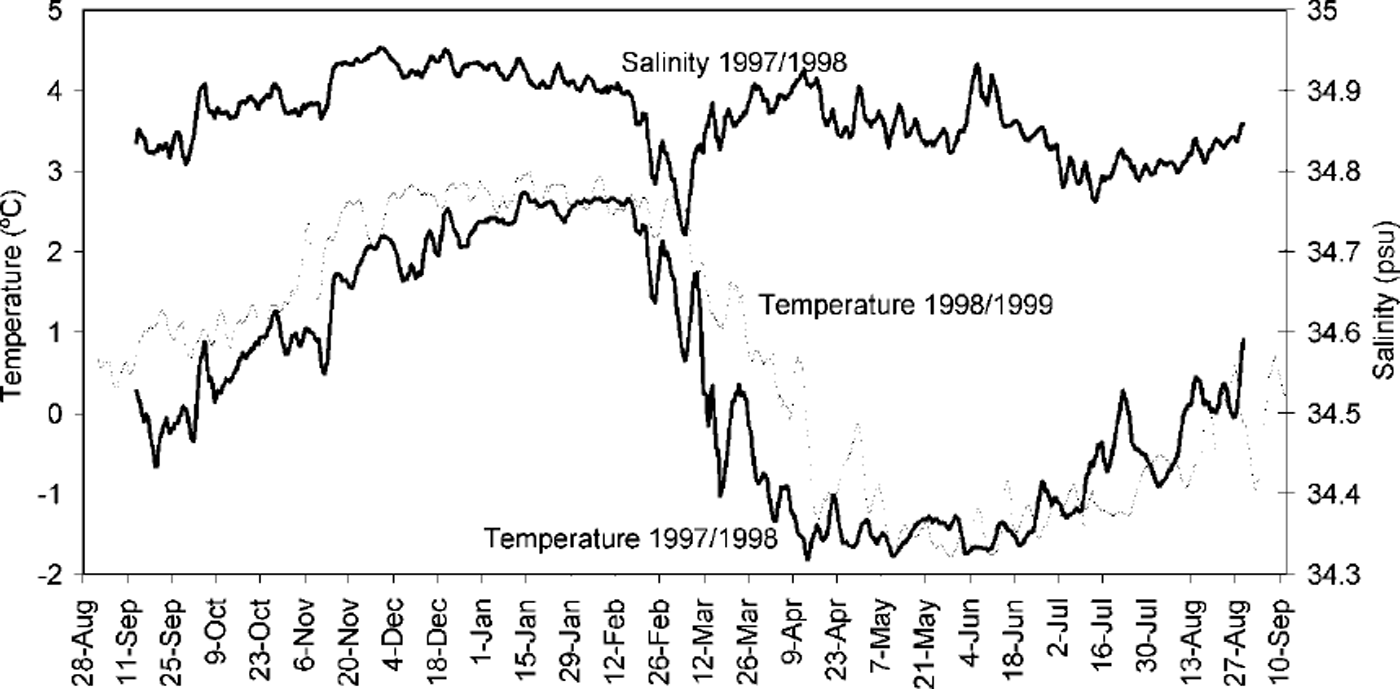
Fig. 7. Temperature during winter 1997/98 (thick line) and 1998/99 (thin line) and salinity during winter 1997/98 at the shelf break (mooring a) at 10 m over the bottom in 310 m depth. the salinity sensor did not work correctly during 1998/99.
Interannual Variability
The meteorological data from Hopen Island show that these winters were significantly different. The rather severe winter 1997/98 included daily averaged temperatures down to −33°C between 1 November 1997 and 31 May 1998 (Fig. 8), and around 2500 freezing degree-days were accumulated. The mild winter 1998/99 had only about 1500 freezing degree-days in the same period, when wind velocities were only slightly stronger, on average 6.4 m s"1 in 1998/99 compared to 6.1 m s"1 in 1997/98. More northerly winds occurred in 1997/98, however. A coupled remote-sensing/model study (Reference Haarpaintner, Haugan and GascardHaarpaintner and others, 2001) shows that around 15% less ice was formed in total in 1998/99 than in 1997/98 and therefore less brine was added to the water column. However, hydrographic measurements in the following summers show that higher density anomalies followed the milder winter. Salinities of >35‰ were found in late summer 1999 (35.2‰ in July), whereas in late summer 1998 only small amounts of bottom water exceeded 34.9‰. Figure 9 presents the difference in salinity between the hydrographic sections of September 1999 and September 1998. Satellite observations suggest that a possible explanation is the different location of the ice production in the two winters. In the severe winter of 1997/98, the whole shallower northern part of Storfjorden was covered by about 120 cm thick fast ice in April 1998, so little ice could be formed there after the fast-ice cover was established. According to Haarpaintner and others (in press), about two-thirds of the 29 km3 total ice volume in the studied 10 000 km2 was formed in the polynya area that extended south of 78° N over the deeper depression of Storfjorden in 1997/98. Adapting the same method for the winter 1998/99 conditions (Reference Haarpaintner, Haugan and GascardHaarpaintner and others, 2001), about 26 km3 of ice (15% less than in 1997/98) was formed in total, of which 75% was formed in the polynya. In the mild winter of 1998/99, tidal currents through Heleysundet could prevent the formation of a fast-ice cover north of 78° N. This, combined with slightly stronger winds in 1998/99, increased the potential area for the formation of a wind-driven latent-heat polynya (Reference PeasePease, 1987; Reference Smith, Muench and PeaseSmith and others, 1990). Regarding the total ice production, this could counteract the difference in atmospheric forcing between the two winters. More intense ice production could occur in the shallower northern region during short cold periods in 1998/99 than during colder periods in 1997/98, since there was no fast-ice cover to prevent the ocean-atmosphere heat flux in 1998/ 99. This moved the location of the ice formation to shallower waters in 1998/99 compared to 1997/98, increasing the resulting density anomaly from brine rejection (Reference Chapman and GawarkiewiczChapman and Gawarkiewicz, 1995). Minor factors that might have led to higher salinities are: lower horizontal density gradients reducing the velocity of the baroclinic eddies that transport the brine offshore (Reference ChapmanChapman, 1999) and a different bottom topography under the ice-producing region, i.e. less steep slopes (Reference Chapman and GawarkiewiczChapman and Gawarkiewicz, 1997) and canyons.
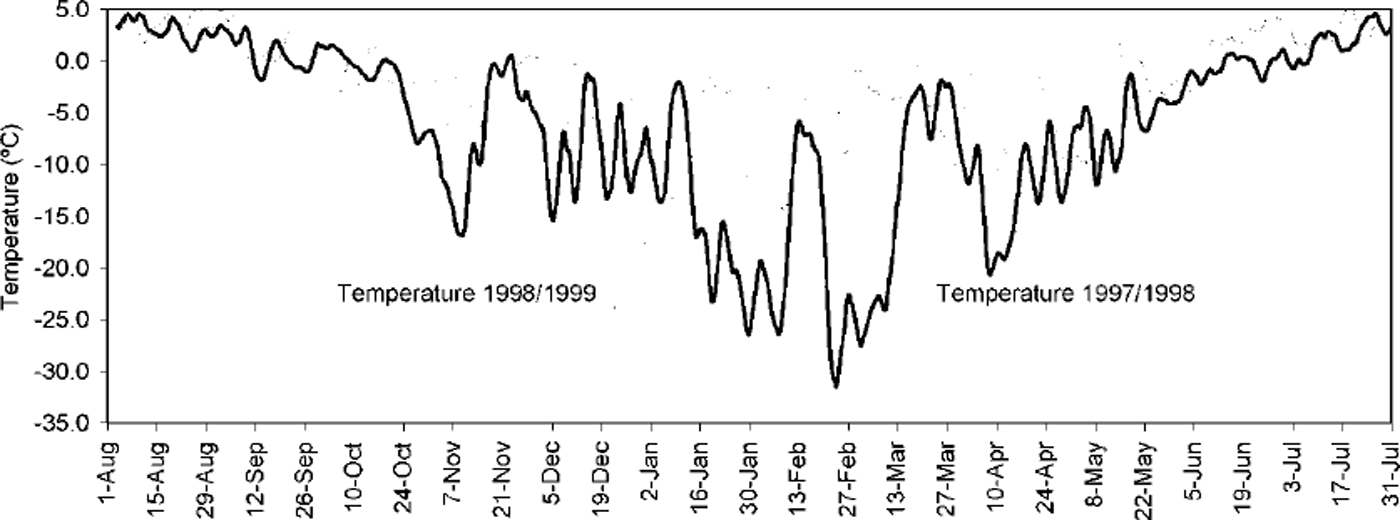
Fig. 8. Air-temperature data at Hopen Island from winter 1997/98 (thick line) and 1998/99 (thin line).
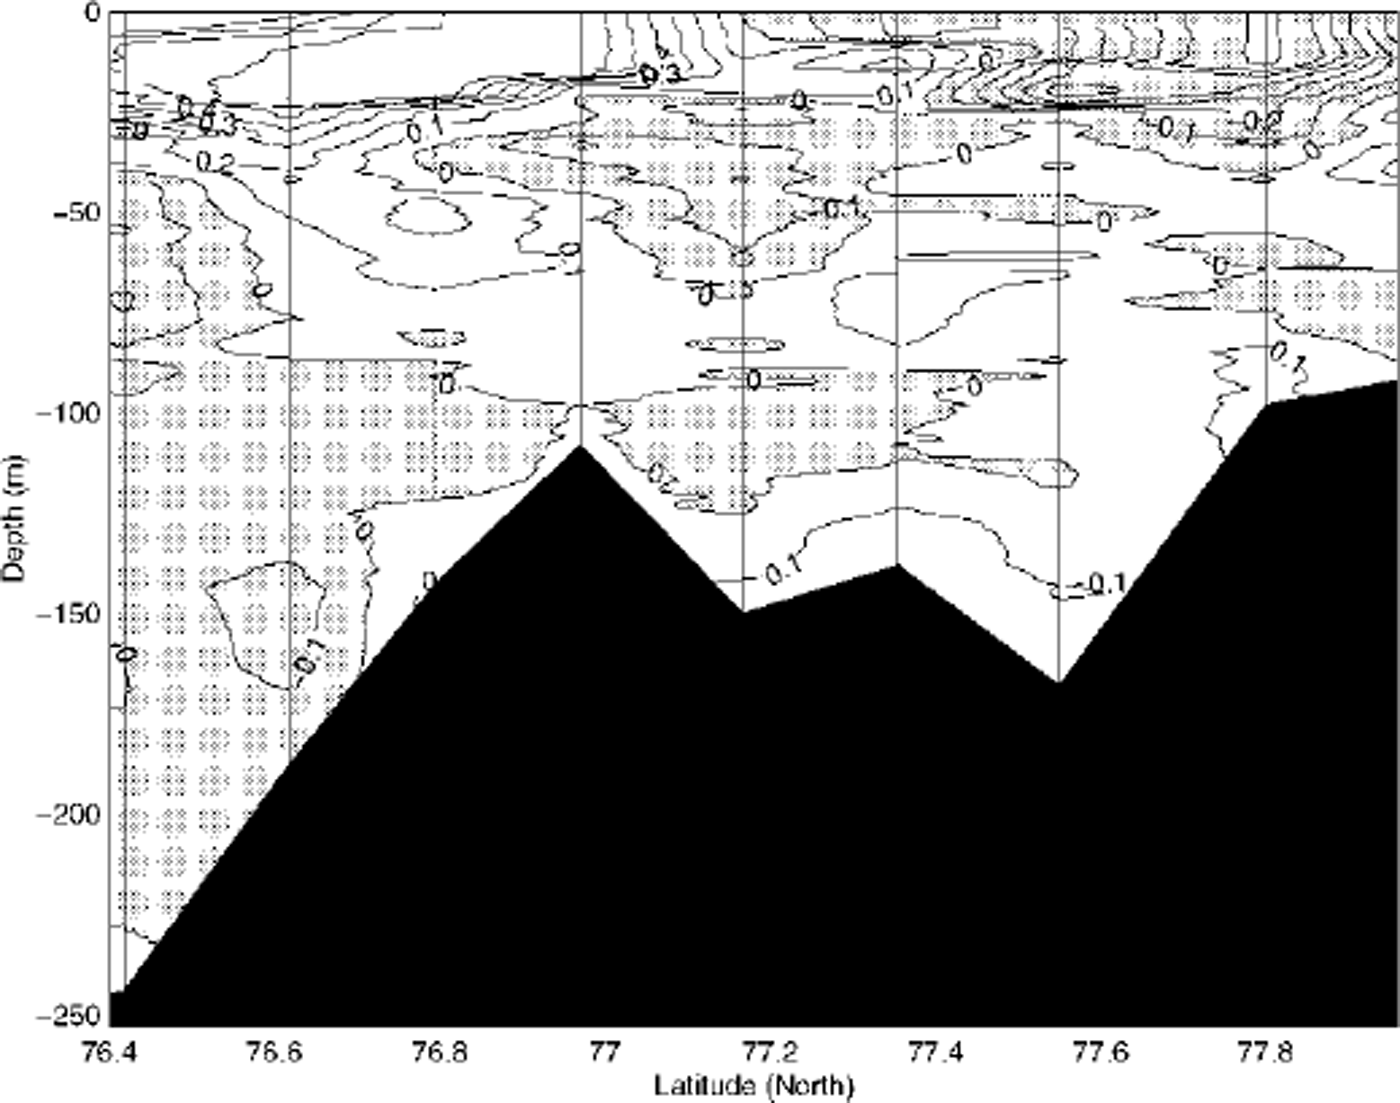
Fig. 9. Interannual variability: salinity difference between the hydrographic sections of september 1999 and september 1998 (sept. 99−sept. 98).
Conclusion
The overall scenario of the water circulation and transformation in Storfjorden is as follows: an original Arctic water mass is imported by tidal circulation through the two northerly sounds and by coastal circulation from the East Spitsbergen Current around Edgeoya. During winter, this water mass undergoes a densification process, as brine rejected during sea-ice formation is added to the water column, inducing a thermohaline circulation.
The main ice production occurs in a persistent polynya, which during severe winters forms under northerly wind conditions south of 78° N, and during milder winters, when a fast-ice cover cannot form north of 78° N, covers nearly the entire area. The effect of thinner and more dynamic ice cover, with a reduced area of fast ice and a larger potential polynya area under suitable wind conditions, can to a large extent counteract an increase in surface air temperature. As predicted by convection models, the salinity anomaly induced by brine rejection is quite dependent on the bottom topography of the forcing region and not only on the strength of the forcing. The bottom topography and depth play an important role in the dynamics and therefore the mixing of the rejected brines with the surrounding water mass. Strong horizontal currents also induce mixing, and a region less influenced by currents might therefore produce denser waters. In the case of Storfjorden, a larger and more northerly (i.e. in shallower waters) positioning of the Storfjorden polynya could produce denser brine-enriched bottom waters in a milder winter.
Storfjorden needs about 2 months to renew the pool of deep water, before it can drain out over the sill in the south. One to two months later, the plume reaches the shelf break into the Norwegian Sea. The exported dense water volume has to be balanced, but too few measurements exist to determine the importance of a direct northward surface advection compared to the coastal and tidal currents. As soon as the melting season starts, Storfjorden is freshened by glacier, snow and sea-ice meltwater. The fresh-water input combined with heat flux from solar radiation transforms the surface layer into Storfjorden Surface Water, which is similar to Spits-bergenbanken Water (Reference LoengLoeng, 1991). This surface layer deepens throughout the summer. The water masses in Storfjorden separate into three layers: Storfjorden Surface Water, an intermediate Arctic Water layer and a dense brine-enriched bottom-water layer.
Acknowledgements
This work was funded by grant No. MAS3−CT96−5036 from the European Union and grant No. 127802/720 from the Norwegian Research Council under contract with the Norwegian Polar Institute, Tromsø. Meteorological data were distributed by the DNMI. Fieldwork was funded by the University Courses on Svalbard (UNIS), the Norwegian Polar Institute (NP) and the Laboratoire d’Océanologie Dynamique et de Climatologie in cooperation. We thank especially S. Maus for his help during fieldwork in spring 1999, and L. Stemmann from the R/V Antarctica expedition in 1995. Thanks to the crew of R/V Lance for help with the hydrographic measurements, and to H. Goodwin of the NP for drawing Figure 1.


