Despite many clinical and psychological studies on lying and deception (Reference RogersRogers, 1997; Reference McCannMcCann, 1998), and although it has been hypothesised that there is a neurobiological basis to lying, cheating and manipulative behaviour (Reference Ford, King and HollenderFord et al, 1988), this hypothesis has not been tested. Several functional magnetic resonance imaging (fMRI) studies on normal individuals who lie or feign memory impairments have found increased bilateral activation in the prefrontal cortex during lying (Reference Spence, Farrow and HerfordSpence et al, 2001; Reference Lee, Liu and TanLee et al, 2002; Reference Ganis, Kosslyn and StoseGanis et al, 2003). To provide initial empirical data on the structural brain imaging correlates of lying and deception, we assessed the volume of prefrontal grey and white matter in individuals who lie, cheat or deceive to test the hypothesis that such individuals have an abnormality within the prefrontal cortex. We used a symptom-based approach (Reference Halligan and DavidHalligan & David, 2001) to define a group of liars and investigated the neurobiological correlates of lying that are not shared by either an antisocial control group or a normal control group.
METHOD
Participants
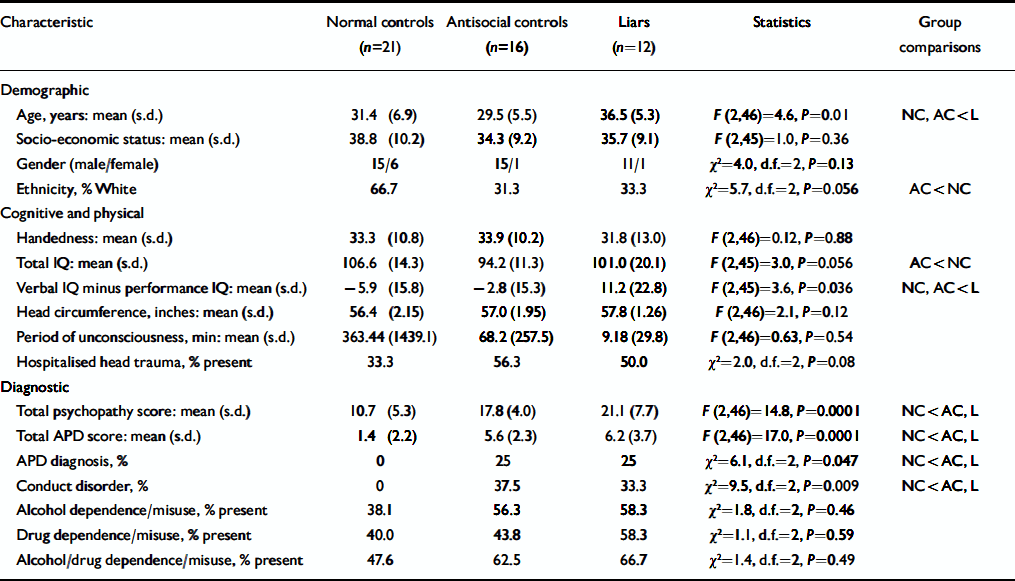
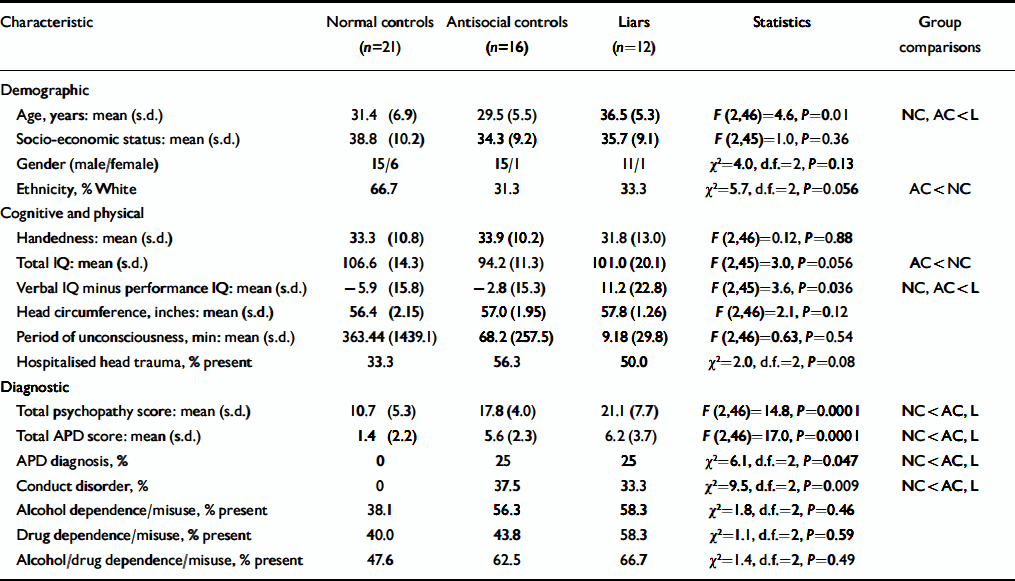
All participants were taken from a total sample of 108 community volunteers drawn from five temporary employment agencies in Los Angeles (Reference Raine, Lencz and BihrleRaine et al, 2000). Groups consisted of 12 participants (11 male, 1 female) with a history of lying (‘liars’), 21 normal controls (15 male, 6 female) who had neither antisocial personality disorder nor a history of pathological lying and 16 antisocial controls (15 male, 1 female) with antisocial personality disorder but no history of pathological lying. Exclusion criteria were: age under 21 or over 45 years, non-fluency in English, a history of epilepsy, claustrophobia, a pacemaker and metal implants. One individual was excluded a priori because brain scanning revealed major atrophy of the right superior temporal gyrus (Reference Raine, Lencz and BihrleRaine et al, 2000). Full demographic, cognitive and physical characteristics of the three groups of participants are shown in Table 1. Full informed, written consent was obtained from all participants in accordance with institutional review board procedures at the University of Southern California.
Table 1 Demographic, cognitive and physical, and diagnostic characteristics of the study groups1

| Characteristic | Normal controls (n=21) | Antisocial controls (n=16) | Liars (n=12) | Statistics | Group comparisons |
|---|---|---|---|---|---|
| Demographic | |||||
| Age, years: mean (s.d.) | 31.4 (6.9) | 29.5 (5.5) | 36.5 (5.3) | F (2,46)=4.6, P=0.01 | NC, AC < L |
| Socio-economic status: mean (s.d.) | 38.8 (10.2) | 34.3 (9.2) | 35.7 (9.1) | F (2,45)=1.0, P=0.36 | |
| Gender (male/female) | 15/6 | 15/1 | 11/1 | χ2=4.0, d.f.=2, P=0.13 | |
| Ethnicity, % White | 66.7 | 31.3 | 33.3 | χ2=5.7, d.f.=2, P=0.056 | AC < NC |
| Cognitive and physical | |||||
| Handedness: mean (s.d.) | 33.3 (10.8) | 33.9 (10.2) | 31.8 (13.0) | F (2,46)=0.12, P=0.88 | |
| Total IQ: mean (s.d.) | 106.6 (14.3) | 94.2 (11.3) | 101.0 (20.1) | F (2,45)=3.0, P=0.056 | AC < NC |
| Verbal IQ minus performance IQ: mean (s.d.) | -5.9 (15.8) | -2.8 (15.3) | 11.2 (22.8) | F (2,45)=3.6, P=0.036 | NC, AC < L |
| Head circumference, inches: mean (s.d.) | 56.4 (2.15) | 57.0 (1.95) | 57.8 (1.26) | F (2,46)=2.1, P=0.12 | |
| Period of unconsciousness, min: mean (s.d.) | 363.44 (1439.1) | 68.2 (257.5) | 9.18 (29.8) | F (2,46)=0.63, P=0.54 | |
| Hospitalised head trauma, % present | 33.3 | 56.3 | 50.0 | χ2=2.0, d.f.=2, P=0.08 | |
| Diagnostic | |||||
| Total psychopathy score: mean (s.d.) | 10.7 (5.3) | 17.8 (4.0) | 21.1 (7.7) | F (2,46)=14.8, P=0.0001 | NC < AC, L |
| Total APD score: mean (s.d.) | 1.4 (2.2) | 5.6 (2.3) | 6.2 (3.7) | F (2,46)=17.0, P=0.0001 | NC < AC, L |
| APD diagnosis, % | 0 | 25 | 25 | χ2=6.1, d.f.=2, P=0.047 | NC < AC, L |
| Conduct disorder, % | 0 | 37.5 | 33.3 | χ2=9.5, d.f.=2, P=0.009 | NC < AC, L |
| Alcohol dependence/misuse, % present | 38.1 | 56.3 | 58.3 | χ2=1.8, d.f.=2, P=0.46 | |
| Drug dependence/misuse, % present | 40.0 | 43.8 | 58.3 | χ2=1.1, d.f.=2, P=0.59 | |
| Alcohol/drug dependence/misuse, % present | 47.6 | 62.5 | 66.7 | χ2=1.4, d.f.=2, P=0.49 |
Assessment of lying
Participants were defined as ‘liars’ if they fulfilled:
-
(a) criteria for pathological lying on the Psychopathy Checklist – Revised (PCL–R; Reference HareHare, 1991); or
-
(b) criteria for conning/manipulative behaviour on the PCL–R; or
-
(c) the deceitfulness criterion for DSM–IV (American Psychiatric Association, 1994) antisocial personality disorder (lifelong repeated lying, use of aliases or conning others for personal profit or pleasure); or
-
(d) criteria for malingering as indicated by admitting to telling lies to obtain sickness benefits in a self-report crime interview (see below).
The term ‘liars’ is intended as a short-hand specifically to denote the above four symptoms. A symptom-based orientation was employed because it has a number of significant advantages over a more traditional syndromal approach (Reference Bentall, Jackson and PilgrimBentall et al, 1988; Reference CostelloCostello, 1992; Reference Halligan and DavidHalligan & David, 2001), especially in this particular field, which lacks diagnostic boundaries.
Normal controls (n=21) were selected from the remaining pool on the basis that they fulfilled none of the four criteria for lying. They also failed to meet criteria for either DSM–IV antisocial personality disorder or DSM–IV conduct disorder, and were matched as closely as possible to the 12 liars with respect to gender and ethnicity.
Because the liar group was significantly antisocial, any structural brain differences could be an artefact of antisocial personality, which has been associated with an 11% reduction in prefrontal grey matter in this group (Reference Raine, Lencz and BihrleRaine et al, 2000). Consequently, an antisocial control group (n=16) was formed by matching liars with individuals who did not fulfil criteria for lying, but who scored as highly as liars on DSM–IV measures of antisocial personality disorder and conduct disorder.
All clinical ratings and diagnoses were performed by clinical PhD graduate research assistants who had both been trained and supervised by A.R. and also had undergone a standardised training and quality assurance programme for diagnostic assessment (Reference Ventura, Liberman and GreenVentura et al, 1998). Pathological lying and conning/manipulative characteristics were assessed using the PCL–R, which was supplemented by five sources of collateral data (Reference Raine, Lencz and BihrleRaine et al, 2000). These were the Interpersonal Measure of Psychopathy (IM–P; Reference Kosson, Steuerwald and ForthKosson et al, 1997), which provides an interviewer's ratings of the participant's interpersonal behaviours and which has been validated for use with incarcerated and non-incarcerated samples; self-reported crime as assessed by an adult extension (Reference Raine, Lencz and BihrleRaine et al, 2000) of the National Youth Survey self-report delinquency measure (Reference Elliott, Ageton and HuizingaElliott et al, 1983); official criminal records; data derived from, and behavioural observations made during, the Structured Clinical Interview for DSM–IV Mental Disorders (SCID–I; Reference First, Spitzer and GibbonFirst et al, 1995a ) and the Structured Clinical Interview for DSM–IV Axis II Personality Disorders (SCID–II; Reference First, Spitzer and GibbonFirst et al, 1995b ). The deceitfulness trait of antisocial personality disorder was ascertained using the SCID–II, whereas malingering (telling lies to obtain sickness benefits) was self-reported on the adult extension of the National Youth Survey self-report delinquency measure.
Comparisons of the study groups are given in Table 1. The two antisocial groups did not differ with respect to rates of antisocial personality disorder and conduct disorder, but rates for both were significantly higher than for normal controls. The same pattern was observed for total psychopathy scores and total antisocial personality scores (the latter created by summing SCID scores on the seven features of antisocial personality disorder). All three groups did not differ significantly with respect to social class, ethnicity, IQ, handedness, history of head injury, height, head circumference and DSM–IV diagnoses of alcohol/drug misuse/dependence. However, groups differed significantly with respect to age, with a higher mean age in the liar group than both control groups. Liars also had significantly higher verbal relative to performance IQ compared with both control groups. There were also trends for group differences in ethnicity (P=0.056) and total IQ (P=0.056), with antisocial controls tending to have lower total IQ and a greater representation of individuals from Black and minority ethnic groups than normal controls.
Demographic, cognitive and physical measures
Estimated IQ was based on five sub-tests (vocabulary, arithmetic, digit span, digit symbol, block design) of the Wechsler Adult Intelligence Scale – Revised (WAIS–R; Reference WechslerWechsler, 1981), with verbal–performance discrepancy scores computed by subtracting performance IQ from verbal IQ. Right v. left hand preference was assessed using the abbreviated Oldfield Inventory (Reference BrydenBryden, 1977), with high scores indicating a stronger preference for right-handedness. History of head injury was defined as head trauma resulting in hospitalisation and the amount of time (in minutes) the subject was rendered unconscious from any head injury. Social class was measured using the Hollingshead classification system (Reference HollingsheadHollingshead, 1975). A physical examination was conducted to derive measures of height and head circumference.
Magnetic resonance imaging
Structural MRI was conducted on a Philips S15/ACS scanner (Selton, Connecticut, USA) with a magnet of 1.5 Tesla field strength. Following an initial alignment sequence of one midsagittal and four parasagittal scans (spin-echo T1-weighted image acquisition, time to repetition=600 ms, echo time 20 ms) to identify the anterior commissure/posterior commissure (AC/PC) plane, 128 three-dimensional T1-weighted gradientecho coronal images (time to repetition = 34 ms, echo time=12.4 ms, flip angle 35°, thickness= 1.7 mm, 256 × 256 matrix, field of view=23 cm) were taken in the plane directly orthogonal to the AC/PC line.
Brain images were reconstructed in three dimensions using a SPARC workstation and semi-automated CAMRA S200 ALLEGRO software (Sun Microsystems Inc., Santa Clara, California, USA) was used for grey/white cerebrospinal fluid segmentation. The prefrontal region was defined as all cortex anterior to the genu of the corpus callosum, and divided into left and right hemispheres along the longitudinal fissure (Reference Raine, Lencz and BihrleRaine et al, 2000). Segmentation of grey and white matter was performed using a thresholding algorithm, with the operator unaware of group membership, and applying a cut-off value to the signal intensity histogram to optimally differentiate white from grey matter, areas of which were defined using an automated seeding algorithm on each slice. Whole brain volume was defined as all cerebral cortex, excluding the ventricles, pons and cerebellum. The pons was excluded by drawing a straight line between the two innermost points that form the superior border. Colliculi were excluded when no longer attached to the cerebral hemispheres. For volume measures, areas on each slice (mm2) were multiplied by slice thickness (1.7 mm) and added to provide volumes in cubic centimetres. Interrater reliability (intraclass correlation coefficient) based on 23 scans (raters unaware of each other's ratings and group membership) were as follows: total brain volume (0.99), left prefrontal grey (0.99), right prefrontal grey (0.99), left prefrontal white (0.93), right prefrontal white (0.94) and total brain volume (0.99). Volumes of grey and white matter were calculated separately for each hemisphere and a grey/white ratio was calculated for each hemisphere, with lower scores indicating increased white matter compared with grey.
RESULTS
Magnetic resonance imaging prefrontal volumes
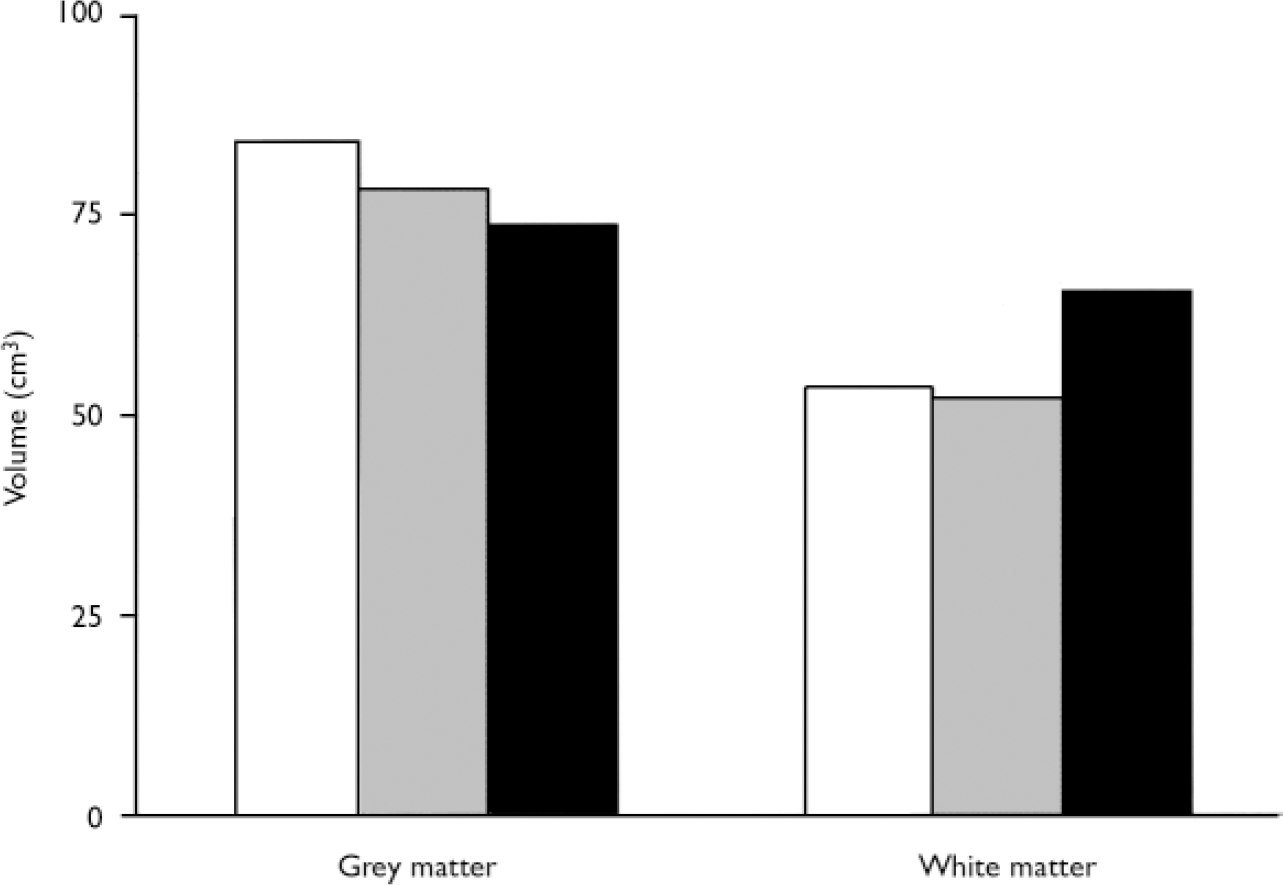
Liars showed a significant increase in prefrontal white matter and slightly reduced grey matter. A 3 (groups) ×2 (left/right hemisphere) ×2 (grey/white) repeated-measures analysis of variance (ANOVA) using the multivariate procedure showed no main effect for group (F(2,46)=0.729, P=0.488) but a significant group × grey/white interaction (F(2,46)=9.049, P=0.0001, η2=0.282). To break down this interaction, separate analyses were run for grey and white matter using a Bonferroni correction (α=0.017) for pairwise comparisons. Liars had significantly greater prefrontal white matter volume than both antisocial controls (t=3.1, d.f.=26,P=0.004) and normal controls (t 2.7, d.f.=31, P 0.01). Liars had a 25.7% increase (13.3 cm3) in prefrontal white matter compared with antisocial controls and a 22.2% increase (11.8 cm3) compared with normal controls (Fig. 1). For grey matter, liars had non-significantly reduced volumes compared with normal controls (t=2.1, d.f.=31, P=0.04) but not compared with antisocial controls (t=0.79, d.f.=26, P=0.43; Fig. 1). Liars had a 14.2% decrease (10.5 cm3) in prefrontal grey matter compared with normal controls. No group × hemisphere interaction for grey/white volumes was found (F(2,46) 0.848, P>0.43). Antisocial control and normal control groups did not differ from each other in either grey (t=0.39, d.f.=35, P=0.23) or white matter volumes (t 0.39, d.f.=35, P=0.69).

Fig. 1 Prefrontal grey and white matter volumes in liars (▪), normal controls (□) and antisocial controls (&![]() ).
).
Prefrontal grey/white ratio
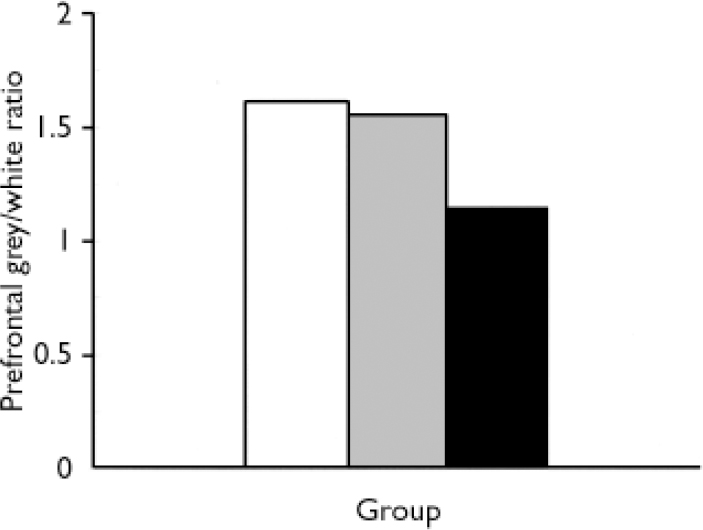
Liars had relatively more prefrontal white than grey matter. A multiple analysis of variance (MANOVA) on grey/white ratios showed a significant main effect for group (F(2,46)=10.25, P = 0.0001, η2=0.308). Liars had lower prefrontal grey/white ratios (mean=1.15, s.d.=0.21) than antisocial controls (mean = 1.56, s.d.=0.38, t=3.6, P=0.001) or normal controls (mean=1.63, s.d.=0.27, t=5.3, P=0.0001). Liars had 35.7% decrease (0.41) a in prefrontal grey/white ratio compared with antisocial controls and a 41.7% decrease (0.48) compared with normal controls (Fig. 2).

Fig. 2 Prefrontal grey/white matter ratio in liars (▪), normal controls (□) and antisocial controls (![]() ).
).
Correction for whole brain volumes
It could be argued that group differences in prefrontal volume were an artefact of group differences in whole brain volume. Consequently, the above analyses on prefrontal grey and white matter were repeated using whole-brain corrected volumes. The same results were found. A repeated-measures ANOVA showed no main effect for group (F(2,46)=0.971, P=0.386) and no group × hemisphere interaction (F(2,46) 0.966, P 0.388) but did show a significant group×grey/white interaction (F(2,46)= 9.333, P=0.0001, η2=0.289). A one-way ANOVA on whole-brain corrected grey/white ratios again showed a significant group effect (F(2,46)=10.34, P=0.0001). A one-way ANOVA on whole-brain corrected grey matter was non-significant (F(2,46)=1.73, P=0.18) but a one-tailed test on the previously significant reduction in liars compared with normal controls was marginally significant (P=0.031).
When prefrontal white matter was expressed as a function of whole brain volume, groups again differed significantly (F(2,46)=8.031, P 0.001). Liars had significantly higher prefrontal white/whole brain ratios (mean=0.069, s.d. 0.011) compared with both antisocial controls (mean=0.054, s.d.=0.011, t=3.4, P 0.002) and normal controls (mean=0.054, s.d.=0.010, t=3.7, P=0.001).
Potential demographic, cognitive and antisocial confounding variables
Groups differed significantly with respect to age, verbal–performance IQ discrepancy scores, psychopathy, antisocial personality disorder and conduct disorder, and also showed trends for differences with respect to ethnicity and full-scale IQ. To rule out the effect of age, psychopathy and antisocial personality disorder, these measures were included as covariates in repeated-measures ANOVA. The grey/white matter × group interaction remained significanticant after correcting for age (F(2,45)=5.76, P=0.006), ethnicity (F(2,45)=8.046,P=0.001), verbal–performance IQ discrepancy scores (F(2,45)=6.605, P=0.003), full-scale IQ (F(2,45)=9.503, P=0.0001), psychopathy (F(2,45)=4.826, P=0.01), antisocial personality disorder (F(2,45)=7.421, P=0.002) and conduct disorder (F(2,45)=7.372, P=0.002).
DISCUSSION
Prefrontal component of lying circuitry
To our knowledge, this study is the first to show a brain abnormality in people who lie, cheat and manipulate others. Liars had increased prefrontal white matter volumes and reduced grey/white ratios compared with normal controls. The effect size was substantial, with group membership explaining 28.2% of the variance in prefrontal volume. Furthermore, liars were found to have these same differences compared with the antisocial control group. The inclusion of an antisocial control group is viewed as a significant strength since this is rarely included in imaging studies. In addition, the use of a symptom-based approach is felt to be an initial first step in delineating a neurobiological basis of deception (Reference Halligan and DavidHalligan & David, 2001). Because lying has been argued to be associated not just with antisocial personality but also with several other personality disorders (Reference Ford, King and HollenderFord et al, 1988), the results of the present study may also have wider psychiatric applicability.
The result could not be attributed to group differences in age, ethnicity, IQ, head injury or substance misuse/dependence. Furthermore, group differences remained after a strict control for antisocial personality disorder, psychopathy and conduct disorder, again indicating specificity to lying in particular rather than antisocial behaviour in general. Consistent with prior research on pathological liars (Reference Ford, King and HollenderFord et al, 1988), liars had significantly higher verbal relative to performance IQ scores than both control groups, but higher verbal scores could not account for group differences in prefrontal white matter. The results further implicate the prefrontal cortex as an important (but not sole) component in the neural circuitry underlying lying, and provide an initial neurobiological correlate of a deceitful personality.
Neurodevelopmental theory of pathological lying
The most significant finding of this study is the increase of prefrontal white matter and decrease in grey/white ratio in the liar group. Compared with normal controls, the liar group had a 22.2% increase in prefrontal white matter and a 41.7% decrease in grey/white ratio, and compared with antisocial controls they showed a 25.7% white matter increase and a 35.7% decrease in prefrontal grey/white ratio.
Children with autism are less capable of lying than normal children (Reference Sodian and FirthSodian & Firth, 1992) and, intriguingly, brain neurodevelopmental studies of autism show the converse pattern of grey/white ratios to that shown by the liar group. When 2- to 3-year-old children with autism reach 9.5–11 years of age, their white matter increases only 13% compared with 45% in normal children (Reference Carper, Moses and TigueCarper et al, 2002). Similarly, Courchesne et al (Reference Courchesne, Karns and Davis2001) found only a 10% white matter increase in children with autism compared with a 59% increase in normal children from 2–3 years of age to 12–16 years, and an increased cortical grey/white ratio in children with autism compared with normal controls (i.e. the reverse of liars). Although autism is a complex condition, these results on children with autism, combined with the previous fMRI findings on lying in normal controls and our current findings on adult liars, suggest that the prefrontal cortex is centrally involved in the capacity to lie.
Why should increased white matter predispose to a deceitful personality? Although a complete explanation inevitably requires more extensive investigation, an initial working hypothesis is that increased prefrontal white matter developmentally provides the individual with the cognitive capacity to lie. From an evolutionary perspective, it is known that deception in primates is correlated with degree of neocortical expansion (Reference Byrne and CorpByrne & Corp, 2004). From a neurodevelopmental perspective, brain weight reaches adult values between the ages of 10 and 12 years, with a very significant increase in the absolute volume of white matter (Reference Paus, Collins and EvansPaus et al, 2001) that exceeds the developmental reduction in grey matter (Reference Sowell, Trauner and GamstSowell et al, 2002). Psychosocial behavioural research also indicates that while young children are poor liars, by 10 years of age they become much more adept at lying (Reference McCannMcCann, 1998). Consequently, the neurodevelopmental increase in white matter parallels developmental changes in the ability to lie. It is conceivable therefore that the increased prefrontal white matter found in adult liars predisposes to lying. The relative reduction in prefrontal grey matter relative to white may also predispose to a general antisocial disinhibited tendency which, coupled with increased white matter, results in excessive lying.
Clinical conceptualisation of malingering
The results may have implications for research on the clinical concept of malingering (i.e feigning illness to obtain benefits). While biomedical models of malingering have been put forward and debated (Reference Halligan, Bass and OakleyHalligan et al, 2003), there appear to be no studies of the biological characteristics (Reference Raine, Halligan, Bass and OakleyRaine, 2003). Of the 12 liars in this study, 6 would be classified as malingerers in that they admitted to telling lies to obtain sickness benefits. Comparison of these malingerers with others in the liar group confirms that they too are characterised by both relatively increased prefrontal white matter (66.0 cm3 v. 64.3 cm3 in malingering and non-malingering liars, respectively) and a reduced prefrontal grey/white ratio (1.09 v. 1.21). Malingering is not currently viewed as a clinical disorder but is included in DSM–IV (American Psychiatric Association, 1994) as a ‘V’ code to mark it as a condition requiring further attention. If the current findings can be replicated and extended to other populations of malingerers, this could have implications for a more clinical conceptualisation of malingering.
Symptom-based, neurobiological approach to lying
Several neuroscience paradigms are beginning to converge on an initial answer to the elusive question of what is the neurobiological basis to lying. Prior research on normal controls who lie has attempted to identify psychophysiological correlates of lying (Reference Patrick and IaconoPatrick & Iacono, 1991). More recent fMRI research has identified prefrontal activation as a correlate of lying in normal controls. We have reversed the usual research paradigm by using a symptom-based approach to address the question of what characterises individuals who pathologically lie and to provide a provisional answer of excessive prefrontal white matter. Nevertheless, we caution that the neurobiological basis of lying is likely to be complex, involving brain circuits extending well beyond the prefrontal cortex. Future studies are required to examine changes in brain anatomy during the critical neurodevelopmental time period in childhood alongside changes in lying ability to test further our preliminary hypothesis on the link between prefrontal white matter and lying.
Clinical Implications and Limitations
CLINICAL IMPLICATIONS
-
▪ Pathological lying is associated with changes in the prefrontal cortex.This also has implications for psychopathy and antisocial personality disorder.
-
▪ The possibility of a clinical conceptualisation of malingering is raised.
-
▪ We propose a neurodevelopmental theory of pathological lying that also helps explain the onset of proficient lying in children.
LIMITATIONS
-
▪ The sample size was modest.
-
▪ Few females were assessed.
-
▪ We may have underestimated the extent of prefrontal abnormalities in pathological liars because we did not screen the normal control group for moderate levels of lying.
Acknowledgements
We thank Jennifer Bobier, Nicole Diamond, Kevin Ho, Blane Horvath, Shari Mills, KristenTaylor, Jennice Vilhauer and Pauline Yaralian for assistance in data collection and scoring. This study was supported by grants to Y.Y. from the National Institute of Mental Health (Research Scientist Development Award K02 MH01114–01, Independent Scientist Award K02 MH01114–01 and 5 RO3 MH50940–02) and from the Wacker Foundation.


eLetters
No eLetters have been published for this article.