Introduction
Does the public respond to important political decisions when the only recourse for accountability is a low-interest retention election? Judges in many states at various levels of the judiciary run in nonpartisan uncontested retention elections to retain their seats on the bench, and scholars have noted two important characteristics of retention elections: (1) voter participation is usually lower in these elections than it is in contested nonpartisan and partisan judicial elections, and (2) it is very rare for voters not to retain judges in these elections (Schaffner, Streb, and Wright Reference Schaffner, Streb and Wright2001; Hall Reference Hall2007; Bonneau and Hall Reference Bonneau and Hall2009). Scholars conclude that judges who are retained in retention elections are more independent from voters than their peers who run in contested and partisan elections (Bonneau and Hall Reference Bonneau and Hall2009).
Despite the common conclusions about judicial independence in retention elections, there have been retention elections in which judges have lost their seats, voters have cast a higher proportion of negative votes than is usual, or there has been an especially strong partisan nature to the race (see Aspin Reference Aspin2010; Kritzer Reference Kritzer2015). Participation in retention elections has also been increasing over time (Aspin Reference Aspin2010). The goal of this article is to explain the extent to which voters respond to salient judicial decisions in state supreme court retention elections.
The 2010 Iowa Supreme Court judicial retention race is an especially useful case through which to evaluate the motivating question. In 2009, the Iowa Supreme Court legalized same-sex marriage with its Varnum v. Brien decision, holding that the limitation of marriage to opposite-sex couples is a violation of the state constitution’s equal protection clause (Cain Reference Cain2009). In the subsequent general election, three of the justices involved in the unanimous decision ran in the uncontested nonpartisan statewide judicial retention race, and Iowans did not retain any of them. This was the first time Iowa voters had voted against the retention of a state supreme court justice,Footnote 1 and, at that point, only the sixth time (since 1964) voters in any state with a similarly appointed and retained supreme court had failed to retain one or more of their justices (Aspin Reference Aspin2007, n.12).
Iowa’s 2010 election presented an ideal opportunity for voter response in a judicial retention race. Same-sex marriage was an especially divisive issue, with public opinion estimates of support for same-sex marriage in Iowa prior to Varnum ranging from 25 to 42 percent (Lax and Phillips Reference Lax and Phillips2009; Kreitzer, Hamilton, and Tolbert Reference Kreitzer, Hamilton and Tolbert2014; Kastellec Reference Kastellec2018), and the decision led to a battle over the constitution in the state legislature (Clopton and Peters Reference Clopton and Peters2013). Interest groups also devoted extensive resources to encouraging Iowans to vote in the race and to vote against the justices running for retention; they created the state’s first commercials about a supreme court retention race (Skaggs et al. Reference Skaggs, Silva, Casey and Hall2010; Clopton and Peters Reference Clopton and Peters2013).
Scholars have linked previous state supreme court justice retention losses to voters’ reactions to justices’ decisions, and in many cases scholars credit special interest groups’ efforts for mobilizing voters (Latzer Reference Latzer1996; Clopton and Peters Reference Clopton and Peters2013). However, this research is often descriptive, unable to estimate the electoral effect of the judicial decision(s) in question with the chosen method of analysis, or concerned with understanding which voters shaped the electoral outcome rather than estimating the outcome itself.Footnote 2 The analyses included in this article attempt to address this gap in the literature. Using voting and demographic data from twelve other states with appointed state supreme court justices who must run in end-of-term statewide nonpartisan uncontested retention races, I employ a series of difference-in-differences analyses to compare electoral outcomes before and after a salient retention race to those outcomes we might expect in the absence of that salience.Footnote 3
In the Iowa case, I find that contrary to some media reports and state officials’ speculation, there is little evidence to suggest that 2010 general election turnout was higher than should have been expected in response to Varnum, but the decision did lead to the justices’ defeat. Perhaps most interestingly, the number of votes cast in the judicial retention race was especially high, and I provide convincing evidence that Varnum led to this increase in participation. Even the controversial nature of Varnum and the campaigning that followed did not increase turnout in Iowa’s 2010 general election. Rather, Varnum and the related mobilization that followed appear to have led those who vote to vote further down the ballot. Following the analysis of Iowa’s 2010 election, I turn to elections that followed periods of salient judicial decisions in other states. In these examples, too, I find that general election turnout does not increase, but participation in judicial retention races is higher than we would have expected otherwise.
Taken together, the findings in this article offer important insight into judicial independence in retention elections. If lack of voter participation in judicial elections is a mark of judicial independence, then judges who run in retention elections are usually independent from electoral pressures, but this independence is not as consistent as previous scholarship suggests. Previous scholars’ reliance on the rarity with which justices are not retained and low average levels of participation in retention elections as evidence of judicial independence obscures important variations in voter participation in retention elections across states and years. Inasmuch as voters act as a check on elected judges’ behavior,Footnote 4 understanding participatory shifts in judicial retention races must be at least as important as understanding shifts in negative vote shares, regardless of whether judges are retained.
In the sections that follow, I review the scholarship to which this project contributes, and I provide a brief overview of the circumstances surrounding Iowa’s 2010 supreme court retention race. I then present the data and analyses of Iowa’s 2010 election. Next is a discussion of the generalizability of these findings and analyses of supreme court retention race participation in other states, followed by the conclusion.
Voting in Judicial Retention Elections
Appointed judges are generally accountable to whichever branch of government (executive or legislative) they rely on for appointment and reappointment (Bonneau and Hall Reference Bonneau and Hall2009).Footnote 5 Citizens can hold elected judges accountable with their votes. However, most of the factors driving voter participation in judicial elections are associated with partisan and competitive, rather than retention, elections (Bonneau and Hall Reference Bonneau and Hall2009).
Nonpartisan uncontested judicial retention elections occur in many states for a variety of types of courts. However, they are especially common in states, like Iowa, that have adopted the Missouri Plan, also referred to as merit selection, for the selection and retention of judges. Judges in states and districts that follow the Missouri Plan are selected from a list of candidates prepared by a nominating commission and appointed once (usually by the governor); they run in a retention race within roughly one year of appointment, and then must run for retention at the end of each term (state supreme court term lengths vary from six to twelve years). During an election, voters can either vote “yes” to retain a judge in office, or “no” against retention.
Ballot roll-off—the proportion of voters who vote in the top ballot race but not in a lower ballot item—in retention elections is generally higher than in other types of judicial elections, and the proportion of positive votes in retention elections is typically high, with relatively little variation; in fact, scholars have identified the suppressive forces of nonpartisan- and retention-style elections on participation when compared with traditional competitive elections (Schaffner, Streb, and Wright Reference Schaffner, Streb and Wright2001; Hall Reference Hall2007; Bonneau and Hall Reference Bonneau and Hall2009). Bonneau and Hall (Reference Bonneau and Hall2009) conclude that following their initial appointment, judges in Missouri Plan states are independent from the nominating branch, and the frequency with which these judges are easily retained insulates them from the electoral pressures that their counterparts who participate in competitive elections face.
Kritzer (Reference Kritzer2015) shows, however, that despite many proponents’ claims, retention elections are not devoid of politics, and that highly partisan retention elections are associated with higher percentages of votes against judicial retention. Aspin (Reference Aspin2010, Reference Aspin, Bonneau and Hall2016), though he acknowledges that judges are still overwhelmingly retained and that he does not expect this to change, identifies a fairly steady decrease in ballot roll-off (with some fluctuation) in retention elections from 1964 through 2014.
Scholarship concerned with judges’ accountability to voters (through their behavior) as opposed to voters’ ability to punish judges with their votes finds some evidence to suggest that judges who run in retention elections are responsive to public opinion when rendering decisions, especially when it comes to salient issues. These scholars have shown that supreme court justices who run in retention elections may resemble their counterparts who run in nonpartisan competitive elections in this respect. Though the evidence is stronger for nonpartisan than retention elections, the lack of party labels on ballots means that voters focus on judges’ past decisions, and, knowing they will be evaluated based on their decisions, justices consider the public’s preferences when rendering decisions, especially on hot-button issues (Canes-Wrone, Clark, and Park Reference Canes-Wrone, Clark and Park2012; Canes-Wrone, Clark, and Kelly Reference Canes-Wrone, Clark and Kelly2014).
I hypothesize that although judicial retention races generally have low levels of voter participation compared to competitive elections and, therefore, more limited potential to punish or reward judicial behavior, in elections following salient judicial decisions, voters may respond and participate in state supreme court retention races at higher levels than we would otherwise expect. This electoral response decreases the extent to which we can think of judges who run in retention elections as independent from voters, regardless of whether any particular judge is retained. However, salient decisions will not increase general election turnout and bring more voters to the polls than we should expect, keeping judges, like other elected officials, independent from those who would not have turned out to vote.
Varnum and its aftermath
Varnum is the perfect case with which to identify voter response in retention elections. It was a high-visibility decision about which many citizens were likely aware due to the issue involved (same-sex marriage) and the series of events that occurred between the decision and the 2010 election. Varnum was followed by a battle between the parties in both state legislative bodies over amending the state constitution’s definition of marriage (Buller Reference Buller2011; Clopton and Peters Reference Clopton and Peters2013). Bob Vander Plaats, in a bid to win the 2010 Republican gubernatorial nomination, made overturning Varnum “the centerpiece of his campaign,” and though he did not win the nomination, he launched a campaign against the justices, founding the group Iowa for Freedom (Clopton and Peters Reference Clopton and Peters2013, 322).
Presidential candidates shared their opinions on same-sex marriage nationally and in Iowa, increasing the visibility of the issue (Clopton and Peters Reference Clopton and Peters2013), and, for the first time ever, Iowans saw television ads about the supreme court retention race. American Family Action, Inc. and the National Organization for Marriage each spent over one-hundred thousand dollars for 319 ad spots targeting the Varnum decision and in support of conservative family values (Skaggs et al. Reference Skaggs, Silva, Casey and Hall2010). In total, groups and individuals opposing same-sex marriage and the justices’ retention spent close to one million dollars, much more than those in favor of the decision (Aspin Reference Aspin2010; Clopton and Peters Reference Clopton and Peters2013).Footnote 6
Iowa’s published 2010 election results show the unusually high levels of participation and negative votes in the judicial retention race. On the other hand, general election turnout increased from 48.1 percent in Iowa’s 2006 midterm election to what some reports claimed was record high turnout at 49.9 percent in 2010; these reports listed Varnum as a key factor in the supposed increase in turnout, which largely benefited Republicans (Clayworth Reference Clayworth2010).
In the next section, following a discussion of the data and method of analysis, I evaluate the media claim that Varnum led to record-high turnout in Iowa’s 2010 general election. I then turn to analyses of the retention race results to evaluate the hypothesis that Iowa voters responded to Varnum in the supreme court judicial retention race, specifically. I then consider responses to judicial decisions in other states to consider the generalizability of Iowa’s post-Varnum election. Again, I find that while this salience does not increase general election turnout, those who vote participate in retention races at higher levels than we would expect otherwise.
Data and Analyses
The analyses in this section investigate three different electoral outcomes. First, I evaluate the media claim that there was record-level turnout in Iowa’s 2010 general election. Next, I turn to outcomes related to the judicial retention race: negative votes and retention race participation.
If the legalization of same-sex marriage did elicit an electoral response and lead to failed retention bids for three justices, the effects should be visible in voters’ participation in the retention race specifically, rather than the election in general. I conduct an analysis of negative votes in Iowa’s 2010 supreme court retention race to identify whether Varnum did, in fact, lead to the justices’ defeat. However, negative votes are only one type of electoral response, and an increase in negative votes only captures the responses of those voters voting against retention. I conduct an analysis of voter participation in the 2010 supreme court retention race to identify whether there was a more general response to the legalization of same-sex marriage regardless of voters’ choices. Following the analyses of Iowans’ response to Varnum in the state’s 2010 supreme court judicial retention race, I conduct analyses of voter participation in state supreme court retention races in three other states to understand the generalizability of the main results better.
Methodological Approach
In the analyses that follow, I evaluate hypotheses about Varnum’s effect on different electoral outcomes in the 2010 election. To provide convincing evidence in support of the hypotheses that the court decision increased negative votes and participation in the subsequent retention race rather than potential random fluctuations in voting patterns, the analyses estimate the electoral outcomes that we might have expected in the absence of Varnum—in a counterfactual Iowa—and compare them to the actual 2010 outcomes. To do this, I conduct a series of difference-in-differences analyses of the electoral outcomes of interest.
The difference-in-differences design compares changes in Iowa voters’ participation after Varnum with changes in voter participation in other states at the same time. With this approach, Iowa is the “treated” unit among the group of comparison states, and the election after the Iowa Supreme Court’s legalization of same-sex marriage (the treatment) is the post-treatment period. I compare the differences in electoral outcomes before and after the treatment in Iowa with those in other states with supreme court judicial retention races. Inherent in this method of analysis is an assumption that any observed effect is actually a response to Varnum and not due to something else that happened prior to the election.
I conduct these difference-in-differences analyses in two ways. One approach uses regression analysis, incorporating state and year fixed effectsFootnote 7 to control for unobserved differences across states and years that could affect electoral outcomes (such unobserved differences might include the organization of a state’s trial and appellate court systems, the requirements for running for judgeship, etc.). The difference-in-differences estimate, in this case, is the coefficient of a binary interaction term indicating the state of Iowa and the election after the Varnum decision. The estimate measures the extent to which the difference in Iowa’s electoral outcomes pre- and post-Varnum is different from the average differences in the electoral outcomes of the comparison states pre- and post-Varnum.
The second approach assigns varying weights to the individual comparison states to create a counterfactual or synthetic control (synthetic Iowa).Footnote 8 The weights are selected such that the synthetic control matches the treated state as well as possible with respect to the values of the voting predictor variables included in the analysis that are most important for predicting the outcome in the pre-treatment period (Abadie, Diamond, and Hainmueller Reference Abadie, Diamond and Hainmueller2010, 498).Footnote 9 The state weights for the synthetic control are then used to generate the electoral outcome that we would expect in Iowa in the absence of the treatment (Varnum). If the synthetic control matches the treated state in the pre-treatment period, then the effect of Varnum is the difference between the electoral outcome in Iowa and the electoral outcome in synthetic Iowa. If the synthetic control is not a good match for the treated state prior to treatment, then it is difficult to make any inference about perceived differences between the two after treatment using a synthetic control.
Data
The data for the analyses consist of state-level election results and predictors of voter turnout from 1984 through 2012 for Iowa and the twelve other statesFootnote 10 that follow the Missouri Plan for the selection and retention of state supreme court justices, where the entire state (rather than individual districts) votes on each justice’s retention, and where judicial retention races are held during the general election.Footnote 11 Therefore, Iowa and the states to which I compare it have populations that did not elect justices to their initial appointments and that have the same opportunities to retain or remove supreme court justices during general elections. The covariates include state-level data on residents’ income and other economic factors, race, level of education, religious adherence, and partisanship.Footnote 12
I estimate Varnum’s effect on three different outcome variables: general election voter turnout, state supreme court judicial retention race “no” votes, and participation in the retention race. I measure general election turnout as the percentage of the voting eligible population (VEP) that voted in the top-ballot race (McDonald Reference McDonald2014).Footnote 13 As the top left panel of Figure 1 shows, Iowa experiences relatively high turnout, with the third highest mean turnout in the group of states from 1984 through 2008.
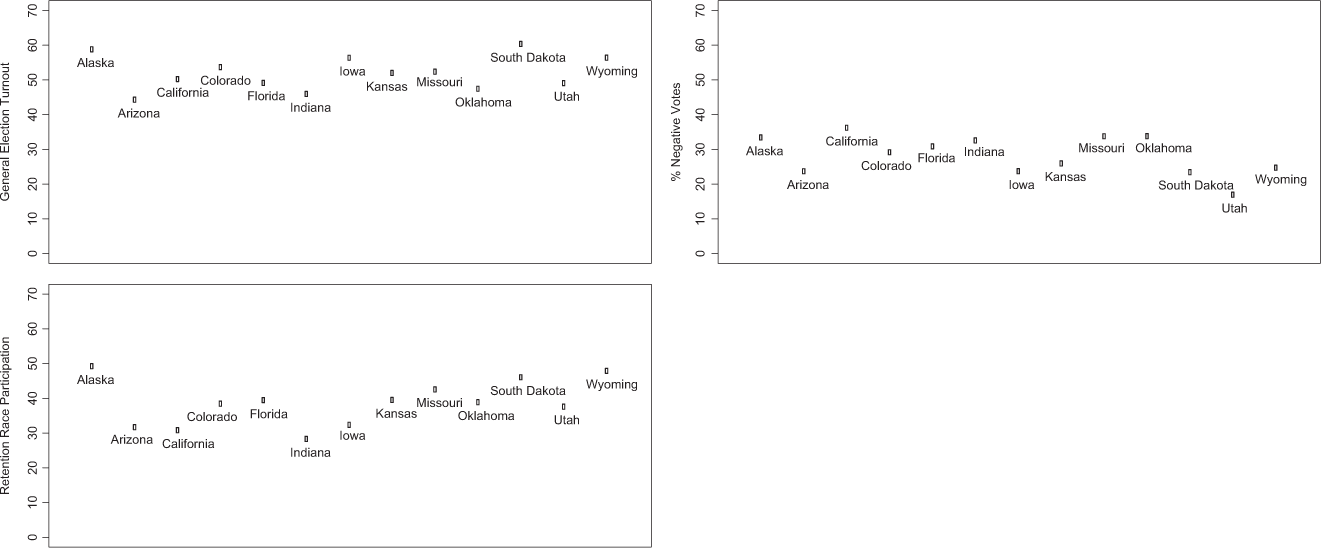
Figure 1. Heterogeneity of Outcomes across States: 1984–2008
There does not appear to be much change in general election turnout in Iowa’s 2010 election. The top left panel of Figure 2 presents general election turnout for the thirteen states in the 2010 general election (after Varnum), and turnout in Iowa is still among the highest compared to the other states. On the other hand, the percentage of “no” votes in the state’s 2010 retention race increased a great deal compared to Iowa’s mean percentage of “no” votes from 1984 through 2008 and compared to the other states (see top right panels of Figures 1 and 2).
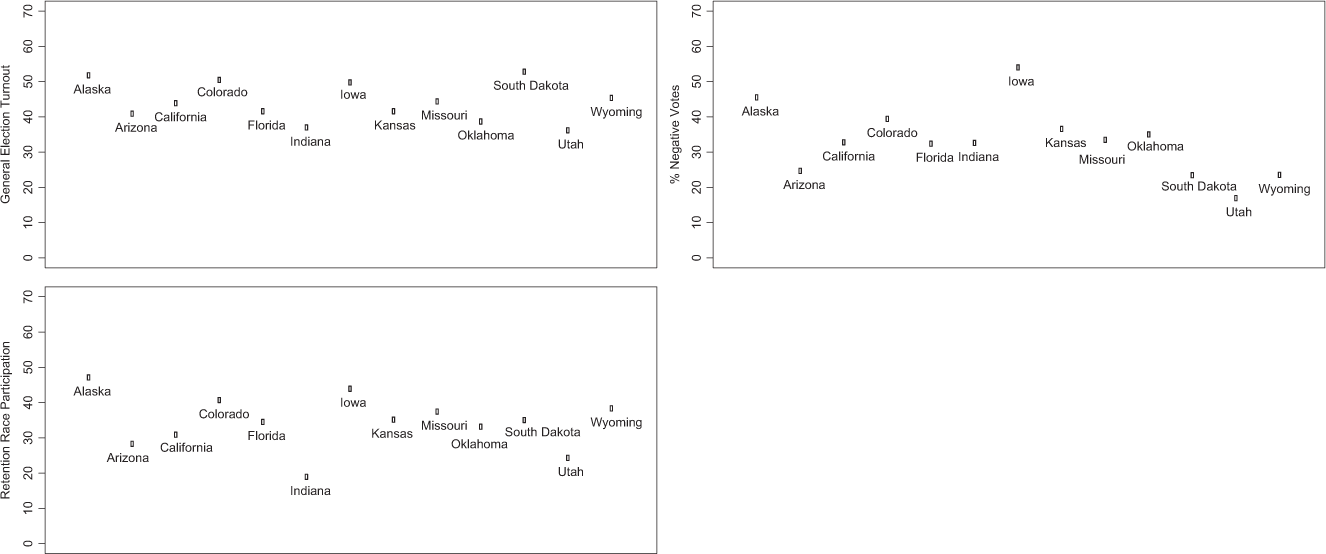
Figure 2. Heterogeneity of Outcomes Across States: 2010
Participation in Iowa’s state supreme court judicial retention race, measured as the percentage of the VEP casting a vote in the supreme court retention race, also appears to change quite a bit from its mean level after the Varnum decision (see bottom left panels of Figures 1 and 2). Iowans turn out in general elections, but they typically do not participate at comparable levels in the state supreme court judicial retention race; this changed in 2010. The difference-in-differences analyses that follow measure the change in how different Iowa is from the other states prior to Varnum and how different Iowa is from the other states after Varnum.
Turnout in Iowa’s 2010 Election
As a first step to identifying electoral response to Varnum, I evaluate the media claim that the decision increased turnout among Iowans in the 2010 general election. To do this, I construct a counterfactual, synthetic Iowa, whose supreme court did not legalize same-sex marriage in 2009, and then compare 2010 general election turnout in synthetic Iowa to Iowa’s actual general election turnout in 2010. An effective synthetic control will match the outcome variable values of the treated unit prior to the intervention such that any difference between the two after that can be attributed to that intervention (in this case, the Varnum decision).
General election turnout in synthetic Iowa is a fairly good match for that in Iowa prior to Varnum, and it follows the same overall trend with higher levels in presidential election years (see Figure 3). Synthetic Iowa in Figure 3 is a combination of Colorado, South Dakota, Wyoming, and Utah, which received weights of 0.697, 0.196, 0.105, and 0.002, respectively. The most important state-level voter turnout predictors for generating these state weights are the Republican vote share, poverty rate, and the Catholic adherence rate.
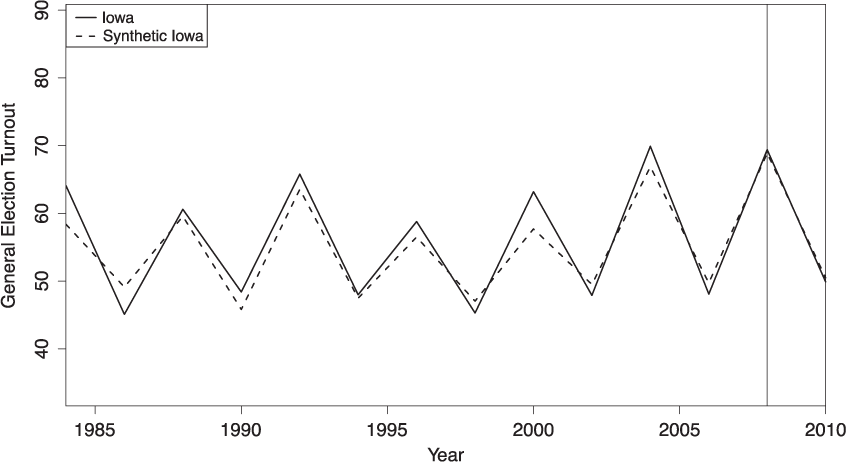
Figure 3. Turnout in Iowa vs. Synthetic Iowa: 1984–2010
Turnout in Iowa is slightly higher than in the synthetic control for most of this period, which is not surprising since, as Figure 1 shows, average turnout in Iowa is among the highest in the comparison state pool. However, turnout in synthetic Iowa—a weighted combination of the comparison states—is a much closer match to turnout in Iowa than the unadjusted mean turnout of all the comparison states prior to Varnum. The vertical line at 2008 marks the last election prior to the Varnum decision, and turnout in synthetic Iowa is essentially a perfect match for real Iowa after that. This result suggests that neither Varnum nor other factors leading up to the 2010 election had any significant impact on voter turnout.Footnote 14 This result also suggests that media claims of record-high turnout in Iowa’s 2010 general election were overstated, and that even a court decision as salient and controversial as the legalization of same-sex marriage does not bring additional voters to the polls. Additional details about the construction of synthetic Iowa are included in the online Appendix.
Even if this analysis generated a visible and significant gap between turnout in Iowa and synthetic Iowa post-Varnum, we could not conclude that the decision was the cause. It would be very difficult to identify the effect of a court case on overall general election turnout; if the analysis produced a significant result, it would be challenging to distinguish whether it was the result of the legalization of same-sex marriage or another event that occurred before the 2010 election, such as the contentious gubernatorial campaign, for example.
Politicians who referenced Varnum in their campaigns, and the interest group advertisements that ran in support of conservative family values, all encouraged Iowans to remove the justices from office with their votes in the 2010 judicial retention race (Skaggs et al. Reference Skaggs, Silva, Casey and Hall2010; Clopton and Peters Reference Clopton and Peters2013). The remaining analyses in this section attempt to identify voter response to the justices’ decision in outcomes related to the retention race specifically.
“No” Votes in the Supreme Court Judicial Retention Race
For justices to lose their seats in a retention election, citizens have to cast votes in that race, and there have to be more “no” votes than “yes” votes. This rarely happens, and it had never happened in an Iowa Supreme Court election prior to 2010. This is why so many people, including legal scholars and members of the media, were fascinated with the outcome of the election and what it said about voters’ ability to punish judges and hold them accountable for their behavior. In this section, I evaluate the claim that Varnum led to the justices’ defeat.
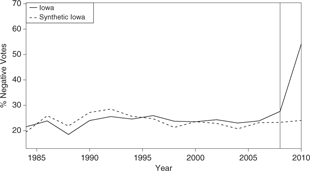
In a judicial retention race in any state, voters see a question similar to the following on their ballots: “Shall the following judges be retained in office?”Footnote 15 Then, they can select “yes” or “no” for each justice or judge up for retention that year. Typically, about 23–25 percent of Iowans voting in the supreme court retention race vote “no.”Footnote 16 In 2010, however, 54 percent of the votes in the supreme court retention race were “no” votes.
Constructing a synthetic control is very useful method by which to identify Varnum’s effect on negative votes in the 2010 judicial retention race. With respect to the percentage of people voting against state supreme court justices, synthetic Iowa is a combination of Arizona, Utah, Oklahoma, California, Indiana, and South Dakota, and these states receive weights of 0.474, 0.327, 0.084, 0.069, 0.043, and 0.003, respectively. The most important predictors for generating a synthetic Iowa in this case are participation in the judicial retention race, the percentage of the population that is Black, and the religious adherence rate.
As Figure 4 shows, “no” votes in synthetic Iowa are a good match for those in Iowa prior to the 2010 election. The relatively close match between the two prior to the legalization of same-sex marriage allows for the ability to estimate the difference between the two in the 2010 election and make an inference about Varnum’s effect. The vertical line at the year 2008 separates pre- and post-Varnum elections. The synthetic control does such a good job here that the gaps between real and synthetic Iowa with respect to “no” votes in this period are relatively small, especially when compared to the gap between the two post-Varnum.Footnote 17 Placebo tests also suggest that this result is not the product of chance.Footnote 18
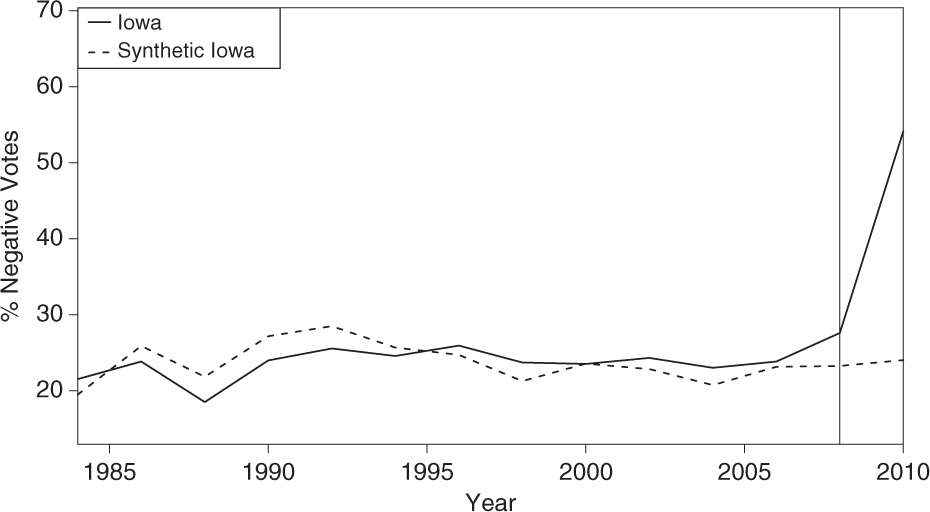
Figure 4. Judicial Retention Race “No” Votes in Iowa vs. Synthetic Iowa: 1984–2010
The results of this analysis support the hypothesis that Varnum did lead to the three justices’ 2010 retention election loss. However, vote choice is just one way that voters might respond to a salient judicial decision in a retention race, and vote choice only captures the response of those voters who do not support justices’ retention. Voters in favor of retention might also respond to salient decisions, but analyses of “no” votes alone fail to capture fully the responses of both sets of voters. The next subsection investigates the broader response, with an analysis of voter participation in Iowa’s 2010 supreme court judicial retention race.
Participation in the Supreme Court Retention Race
Varnum led to significantly more negative votes than any previous supreme court retention race, but it did not bring more voters to the polls in the general election. How else might it have changed participation in Iowa’s 2010 election? In 2010, Iowa voters paid attention to a ballot item they often skip—the state supreme court judicial retention race.
To provide some context as to how Varnum changed voters’ behavior in 2010, Figure 1 shows that although general election turnout in Iowa is generally high, participation in supreme court retention races (percentage of the VEP casting a vote in the supreme court retention race) is relatively low compared to other Missouri Plan states. This phenomenon is referred to as ballot roll-off; many Iowa voters vote in the top ballot item but roll off the ballot without voting in the retention race. In 2010, however, supreme court retention race participation in Iowa was among the highest of all the comparison states (see Figure 2).
Three of the justices involved in the unanimous Varnum decision ran for retention in 2010, and another of the justices involved in the decision ran for retention in 2012. The analyses in this subsection include data through the 2012 election to assess Varnum’s impact on both supreme court retention elections following the decision. The synthetic control of supreme court retention race participation in Iowa is a combination of Indiana, Kansas, Wyoming, Utah, and South Dakota, which receive weights of 0.644, 0.196, 0.103, 0.029, and 0.027, respectively. The most important factors for constructing this synthetic control are the poverty rate, the homeownership rate, and the Mormon adherence rate.
Figure 5 plots supreme court retention race participation in Iowa and synthetic Iowa from 1984 through 2012. The trend in retention race participation in synthetic Iowa matches that in real Iowa fairly well prior to Varnum. Except for the 1992 and 2004 elections, retention race participation in Iowa is either lower than or about the same as participation in synthetic Iowa. This is not surprising because Iowa experiences low participation in its supreme court races compared to the other states in the sample (see Figure 1), which means that, for many years, no combination of comparison states can generate levels of retention race participation as low as those in Iowa.
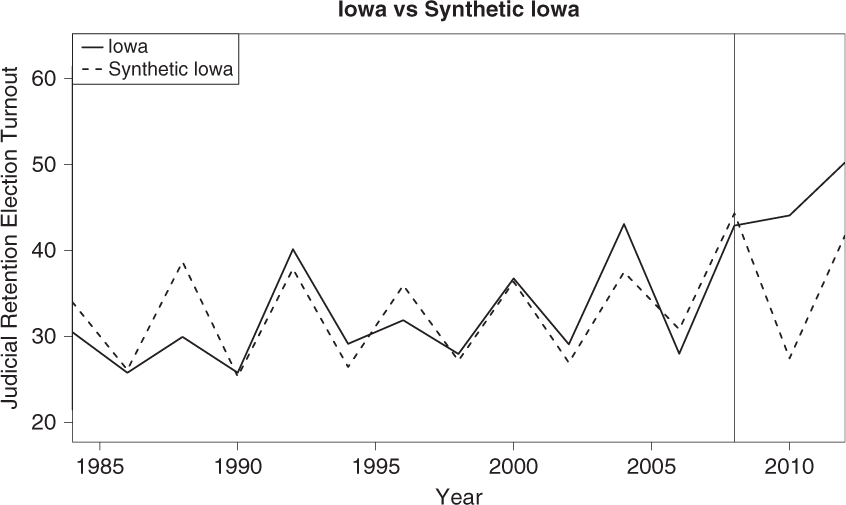
Figure 5. Judicial Retention Race Participation in Iowa vs. Synthetic Iowa: 1984–2010
Figure 5 does show a post-Varnum gap between retention race participation in Iowa and synthetic Iowa after the 2008 election, which is good evidence in support of the hypothesis that Varnum increased participation in the race. Retention race participation in Iowa in 2010 and 2012 are higher than in synthetic Iowa even though retention race participation in synthetic Iowa is higher than actual participation in the state throughout the pre-Varnum period. Although the post-Varnum gap between Iowa and synthetic Iowa is larger than any of the gaps between the two in the pre-Varnum period, some of the gaps in the pre-Varnum period are larger than is ideal for inferential purposes.
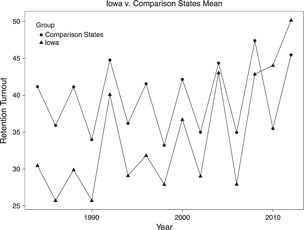
Unlike the synthetic control, which relies on the weighted average of a sample of states for comparison, difference-in-differences regression compares the change in Iowa’s retention race participation after Varnum with the average change in other states at the same time. This approach provides additional support for the suggestive evidence in Figure 5. Figure 6 shows supreme court retention race participation in Iowa and the mean of retention race participation in the comparison states from 1984 through 2012. Both lines follow the same trend over time—higher participation in presidential election years—and until the 2010 election, retention race participation in Iowa is lower than the average of the comparison states. The trend changes in 2010 when participation in Iowa is higher than it was in the 2008 presidential election and higher than the average of the comparison states. Retention race participation remains higher in Iowa than in the comparison states in 2012.
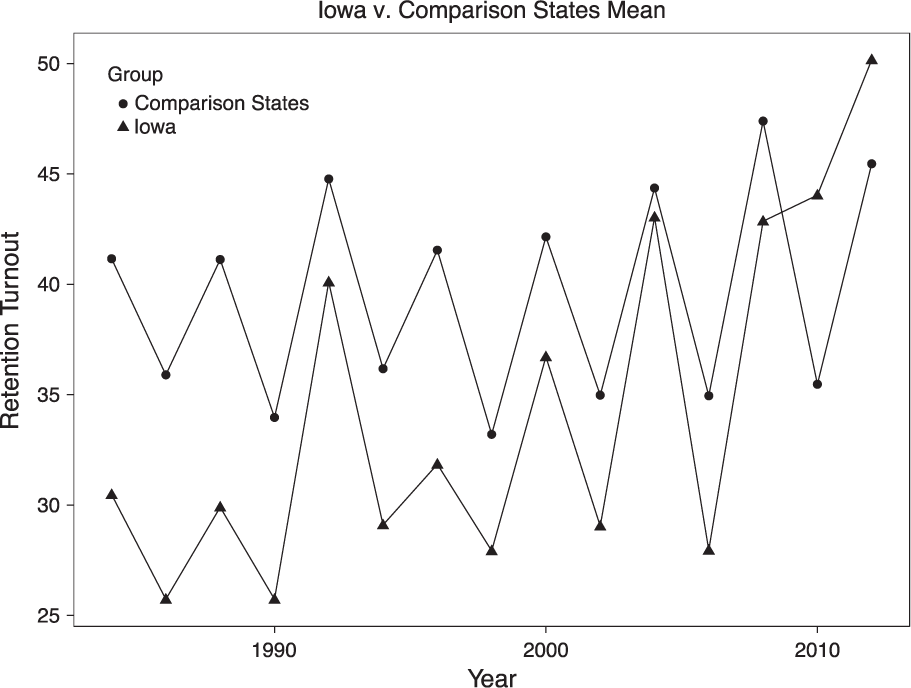
Figure 6. Judicial Retention Race Participation in Iowa Compared to Comparison States Mean: 1984–2012
The difference-in-differences estimate captures the change in the trend in comparison with the other states after 2008. Table 1 shows results of the model, which includes state and year fixed effects. The difference-in-differences estimate is the coefficient for the interaction of the Iowa indicator variable and the 2010 indicator variable (IA × 10), which suggests that retention race participation in Iowa’s 2010 election was 12 percentage points higher than should have been expected when compared with participation in previous years and in the comparison states. More specifically, the coefficient means that the difference between participation in Iowa and average participation in the comparison states in 2010 is 12 percentage points greater than it was on average prior to the 2010 election. This estimate is robust to various model specifications, remaining substantively and statistically significant (p < 0.01).
Table 1. Retention Race Participation in Iowa
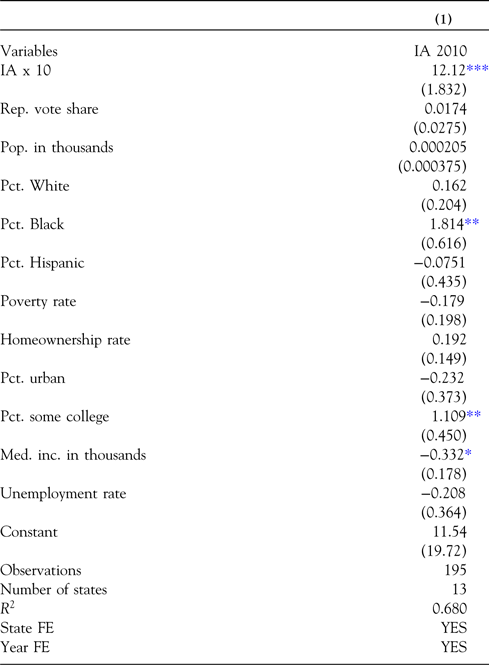
Notes: Robust standard errors in parentheses. ***p < 0.01; **p < 0.05; *p < 0.1.
The results included in this subsection support the hypothesis that the legalization of same-sex marriage led to an electoral response in the subsequent election. Varnum encouraged voters to cast ballots in the supreme court retention race at a higher rate than usual.Footnote 19 Same-sex marriage was an extremely salient issue across the states prior to Obergefell v. Hodges, and there was an influx of money and media attention devoted to the 2010 Iowa supreme court retention race unlike anything the state had previously experienced.
If a state supreme court decision ever had the chance of increasing general election turnout, it was during the 2010 election after Varnum. However, even though the intense campaigning and mobilization around the decision may have increased participation in the race, they did not bring more people to the polls, suggesting that a salient judicial decision can increase participation in retention races, but not election turnout. In the section that follows, I present results from analyses of supreme court retention race participation following salient decisions in other states. In these examples, as well, general election turnout does not increase, but participation in the judicial retention race does.
Beyond Varnum: Electoral Response in Retention Elections
It is the increase in retention race participation, in addition to the removal of three state supreme court justices, that makes the Iowa case an interesting addition to debates about voter participation and judicial independence in judicial retention elections. The increases in negative retention votes in the Iowa case and the cases that follow suggest that voters who voted in those retention elections responded negatively to justices’ controversial behavior; however, most voters do not vote in judicial retention races. So, an increase in negative votes unaccompanied by a shift in participation might mean that only the most engaged voters—those casting ballots in a typically low salience retention race—respond to salient judicial decisions, and it is possible that those engaged voters might be more inclined to respond negatively than other voters.
Low levels of participation in judicial retention elections is a mark of judges’ independence from voters. Understanding the types of participatory responses that result from court behavior is crucially important to understanding judicial independence since both positive and negative votes, especially in the wake of controversial decisions, express public evaluation of judicial behavior. Therefore, throughout this section, I am specifically interested in retention race participation.
Kritzer identifies particularly partisan judicial elections using partisan correlations, which he measures as “the correlations between the county-level percentage voting to oust the justice and the county-level vote for the Republican candidate for governor” (Kritzer Reference Kritzer2015, 203). I use these partisan correlations to identify supreme court retention races in Missouri Plan states that are likely to have followed salient court decisions that have the potential to drive shifts in electoral participation.Footnote 20 The subsections that follow include brief overviews of the circumstances surrounding the partisan retention races in Colorado (2010), Alaska (2000), and a race in Wyoming (1992) that was contentious, but not particularly partisan. While retention race participation was higher than should have been expected in each of the elections discussed below, general election turnout was not. The results suggest that, as in Iowa, judicial decisions can encourage voters to participate in the retention race, but they cannot bring more voters to the polls on Election Day.Footnote 21
Colorado 2010
Prior to the 2010 retention race, Colorado justices received criticism for a series of decisions about such issues as property rights, taxes, and congressional redistricting (Aspin Reference Aspin2010; Cardona Reference Cardona2010; Kritzer Reference Kritzer2015). According to Kritzer (Reference Kritzer2015), the Colorado retention race was the most partisan of all supreme court retention races in 2010. However, even this particularly partisan race did not increase turnout in Colorado’s general election, although, as in Iowa, participation in the supreme court retention race was higher than would otherwise have been expected.
There were no retention races on Colorado’s ballot in 2006 or 2008, so I generate the difference-in-differences estimate using regression analysis rather than a synthetic control, which would have to recreate the results of retention races that did not occur for comparison. The coefficient of the difference-in-differences estimator, in the first column of Table 2, suggests that there was an electoral response to the justices’ salient behavior. More specifically, retention race participation was 5 percentage points higher than the level of participation that would have been expected when compared with previous years and the comparison states.Footnote 22
Table 2. Retention Race Participation in Alaska and Colorado
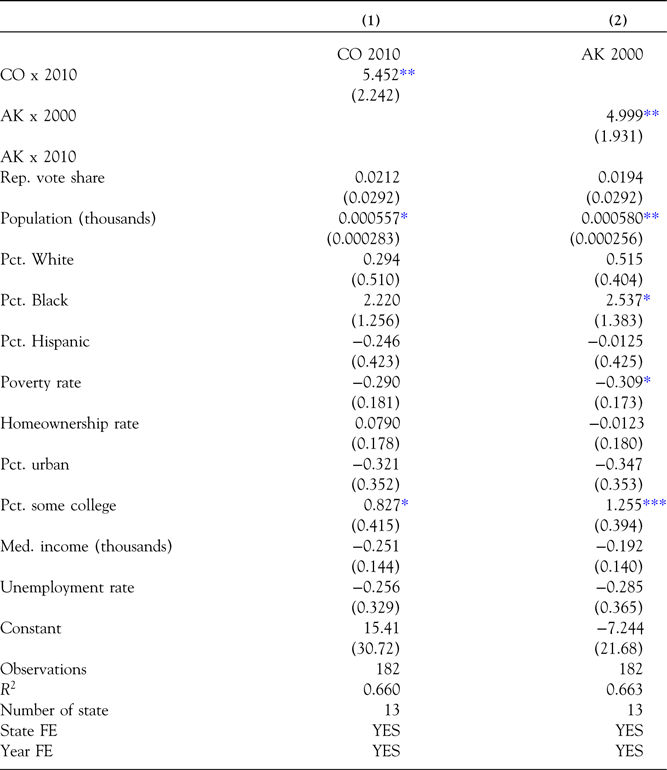
Notes: Robust standard errors in parentheses, ***p < 0.01; **p < 0.05; *p < 0.1.
Alaska 2000
Prior to the 2000 supreme court retention race, conservative groups mobilized voters against Justice Dana Fabe for previously ruling that a hospital that accepted money from the federal and state governments “could not interfere with a woman’s right to choose an abortion” (Queary Reference Queary2000; Kritzer Reference Kritzer2015). The second column of Table 2 includes the results of a regression model of participation in Alaska’s 2000 supreme court judicial retention race. Because Alaska has either the highest or second highest retention race participation of all states in the comparison pool for the entire period, no combination of the states can be used to make a synthetic control that replicates retention race participation in Alaska. The coefficient of the difference-in-differences estimator for the 2000 retention race, which is statistically significant at conventional levels, suggests that Justice Fabe’s decisions led to a 5 percentage point increase in retention race participation that year compared to what we would have expected otherwise, but there was no effect on general election turnout.
Wyoming 1992
Opponents campaigned to unseat Justice Walter Urbigkit in 1992 because they felt his decisions were soft on crime (Kritzer Reference Kritzer2015). Justice Urbigkit was not retained that year, but there was no particularly partisan pattern to the results of the race (Kritzer Reference Kritzer2015).
Figure 7 plots retention race participation in Wyoming and synthetic Wyoming from 1984 through 1998. Retention race participation in synthetic Wyoming is a good match for the real Wyoming through the 1990 election. There is a large gap between the two in the 1992 election when voters did not retain Urbigkit, suggesting that the mobilization around and the silence of his race led to an approximately 7 percentage point increase in retention race participation compared to what we would have been expected in the absence of controversy around Justice Urbigkit’s decisions prior to the election.
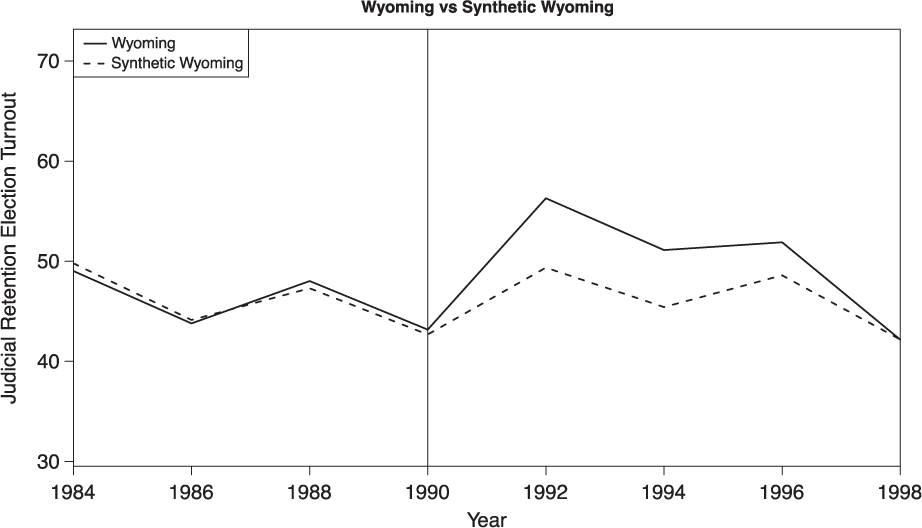
Figure 7. Judicial Retention Race Participation in Wyoming vs. Synthetic Wyoming: 1984–1998
Overall, the examples in this section show that the relationship between Varnum and participation identified in Iowa’s 2010 election is not limited to that example. Those who vote do respond to salient judicial decisions in nonpartisan judicial retention races, but this salience, even following such a controversial decision as Varnum, does not appear to be enough to increase overall turnout in the general election.
Conclusion
The results of the analyses in this article suggest that voters do respond to salient judicial decisions in supreme court retention elections. However, we should not expect even the most controversial decisions to bring additional voters to the polls. Rather, the findings suggest that in response to these decisions, those who vote, will vote further down their ballots and participate in the judicial retention race.
The findings suggest that justices who run in retention elections might not be as independent from voters as scholarship relying on the rarity of failed retention bids and low negative vote shares as evidence of these justices’ relative independence generally concludes. Justices were removed only in the examples from Iowa and Wyoming included in this article, but voters in Alaska and Colorado also increased their participation in supreme court retention races. This does not mean that justices in Alaska and Colorado are more independent than those in Iowa and Wyoming. Voters responded in both sets of examples, but in Alaska and Colorado, the yes votes outnumbered the no votes.
A strength of the findings presented in this article is their robustness to various model specifications. Building on knowledge that scholars have developed in the field of judicial elections, these analyses improve our understanding of electoral response in typically low-interest judicial retention races. The analyses in this article convincingly identify changes in electoral outcomes in retention races following salient judicial decisions when compared with the outcomes we would have expected using previous years and other states for comparison.
However, these analyses require the assumption that any observed effect is actually in response to judges’ decisions and not something else that happened in any of these states prior to the elections in question, including high-profile campaigns for national or state legislative offices. The inclusion of analyses of supreme court retention races in multiple states inspires confidence in the results. Additionally, ballot roll-off in presidential election years is quite similar to ballot roll-off in midterm elections (Aspin Reference Aspin, Bonneau and Hall2016), suggesting that even high-profile national elections create little change in retention race participation as a proportion of general election turnout.
High-profile campaigns against judges running for retention, like the one in Iowa in 2010, are not the norm, and most campaigns will not achieve their goal of removing judges from the bench (Aspin Reference Aspin, Bonneau and Hall2016). But justice removal is not the only reason we should be interested in campaigns against retention and shifts in retention race results. If voters are the only ones who can punish or reward Missouri Plan judges after appointment, then it is important to understand the factors related to shifts in participation in these races. The results of analyses presented in this article suggest that we need to take greater care in evaluating the extent to which judges who run in retention elections are independent from voters. Voters do respond to salient decisions and mobilization in retention races. Even if the judges running in these elections are ultimately retained because more of the voters cast yes votes than no votes, they are not as independent from voters as opponents of retention elections often argue.
Supplementary material
To view supplementary material for this article, please visit https://doi.org/10.1017/lsi.2018.21

