INTRODUCTION
Legionnaires' disease (LD) was first recognized in 1976 when an outbreak of pneumonia occurred at a hotel hosting a convention of American Legionnaires [Reference Fraser1]. The disease is caused by infection with the legionella bacteria which can be found in soil and water, and has an incubation period of 2–10 days. Infection arises following inhalation of aerosol containing Legionella spp. The main sources of infection are hot-and cold-water systems (such as showers, spa pools) and wet cooling systems (including cooling towers) [Reference Darelid2–Reference Garcia-Fulgueiras4]. Aspiration has also been implicated as a source of transmission [Reference Yu5], but person-to-person transmission has not been recorded. Men are more susceptible than women, and the peak age group affected is 50–59 years. The disease proves fatal in about 10% of cases [Reference Ricketts and Joseph6].
Surveillance for LD in England and Wales began in 1980, with case numbers reaching 300–350 per year between 2002 and 2005 [7]. The seasonal distribution for most years shows a summer peak in non-travel- as well as travel-related infections. Cases are detected at a local level and reported to the Health Protection Agency Centre for Infections (HPA CfI), where the national database is situated.
At the beginning of September 2006, there was an unexpected upsurge in the number of cases reported to HPA CfI [8, Reference Laurance9]. It was established by public health investigation that this was due to an increase in sporadic community-acquired cases of LD distributed across England and Wales, rather than to multiple outbreaks. Extensive investigations were conducted in regions with high numbers of cases, but no common sources of infection were identified.
Meteorological conditions have been previously implicated in increases of legionellosis [Reference Fisman10, Reference Hicks11]. Due in part to the transmission of the legionella bacteria in aerosol, the probability of infection is susceptible to influence by environmental conditions. Fisman et al. [Reference Fisman10] concluded that the acute occurrence of the disease in the Greater Philadelphia Metropolitan Area of the United States in 1995–2003 was best predicted by wet, humid weather, whilst Hicks et al. [Reference Hicks11] demonstrated that monthly legionellosis incidence in the Mid-Atlantic region of the United States in 2003 increased during periods of higher rainfall, and that temperature was also independently associated with incidence.
It is biologically plausible that weather may have a large influence on growth of the legionella bacteria in the aquatic environment and on its dissemination in aerosol. Temperature is important for the bacteria's survival and multiplication, which occurs between 20°C and 45°C. The bacteria do not appear to multiply below 20°C and will not survive above 60°C; growth is optimal at 37–42°C. They may, however, remain dormant in cool water and multiply when water temperatures reach a suitable level [12].
Since transmission of the bacterium is by aerosol, humidity is potentially an important factor in its survival [Reference Dunklin and Puck13]. The longer cells remain viable in an aerosol, the greater the dose susceptible individuals may inhale. Humidity has a profound effect on survival in aerosols but the relationship is not a simple linear one [Reference Hambleton14–Reference Berendt16]. Different strains have different survival rates, and the monoclonal subgroups of Legionella pneumophila serogroup 1 that are more commonly associated with disease tend to survive longer in aerosols than other subtypes [Reference Dennis and Lee15].
The purpose of this study was to examine the meteorological conditions that occurred before and during the incubation period (i.e. the likely periods of bacterial growth and exposure of cases to infection) for each sporadic, community-acquired case of LD in England and Wales with onset from 2003 to 2006 (inclusive), and to compare this with the conditions that occurred in control years. Particular emphasis was placed on the cases that occurred between August and October, to assess whether it is likely that biologically plausible meteorological conditions can be implicated in the increase of cases in the late summer of 2006 (Fig. 1).
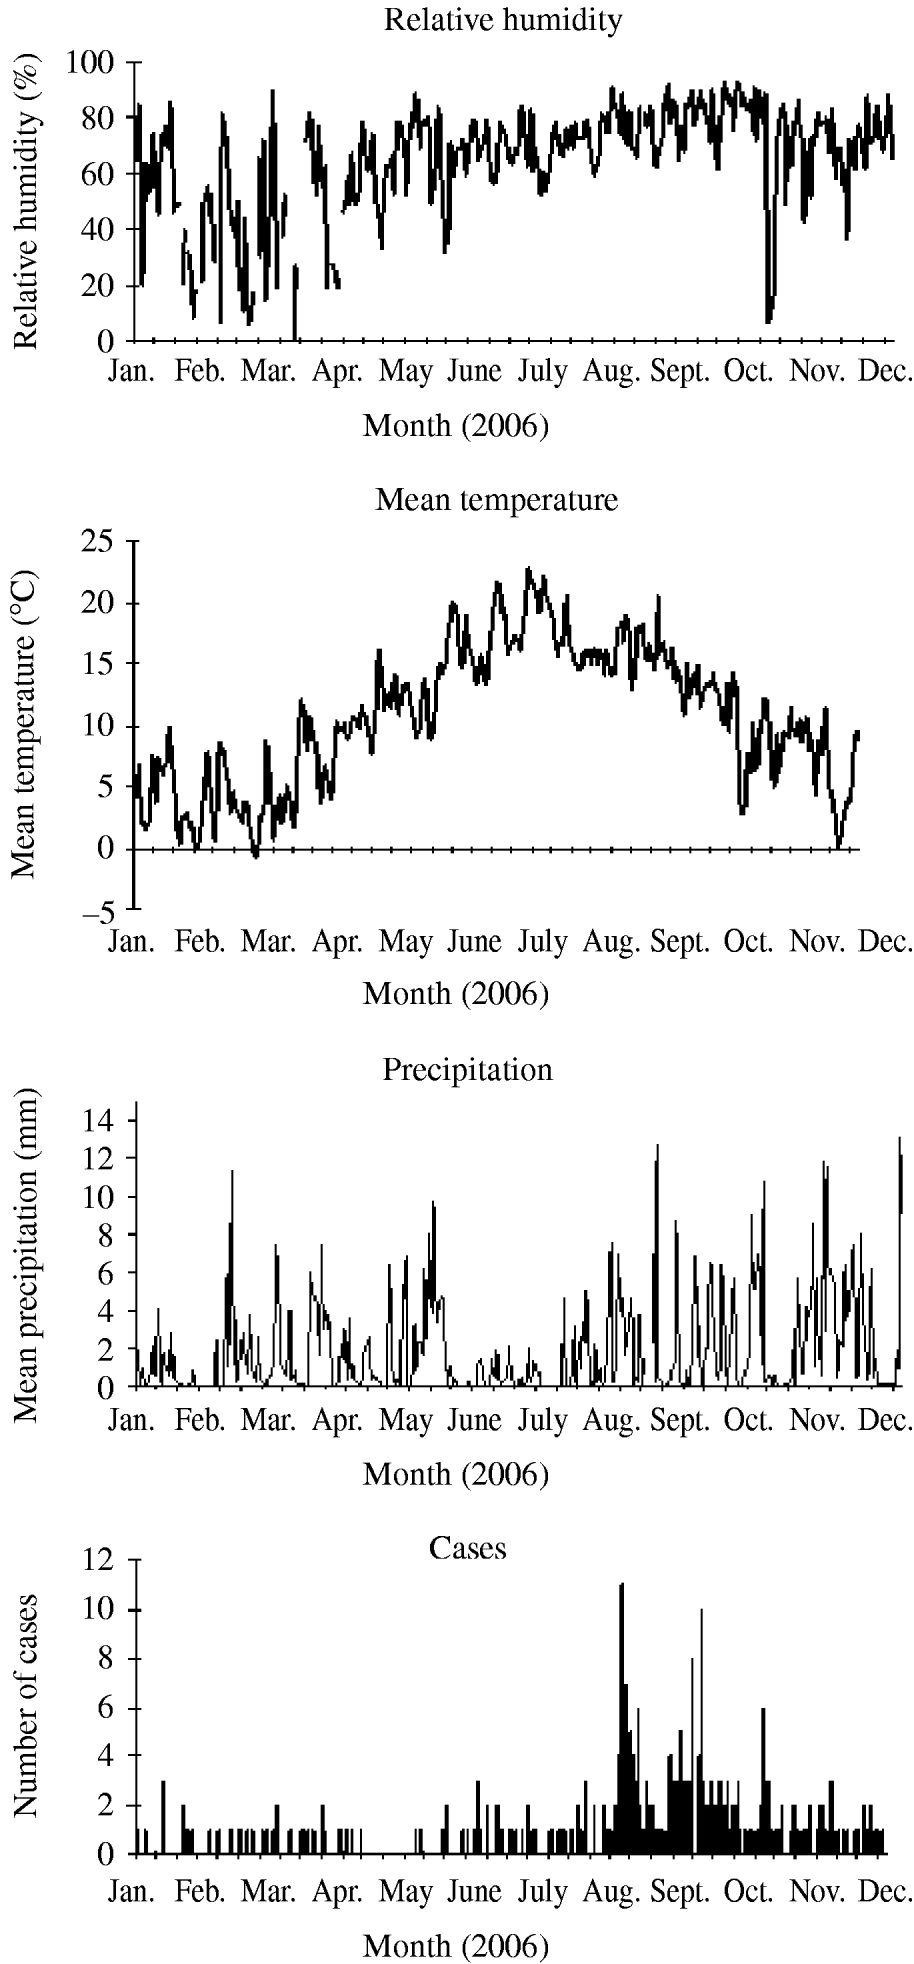
Fig. 1. Sporadic, community-acquired cases of Legionnaires' disease in residents of England and Wales for 2006 with mean meteorological data from the stations included in the study (daily mean precipitation, daily mean temperature, and daily mean relative humidity).
METHODS
Data sources
LD is not notifiable in England and Wales; instead, HPA CfI runs an enhanced surveillance scheme for Legionella infections in residents of England and Wales. Cases are identified by health protection units and reported to regional and national public health authorities. Each case report includes the individual's domestic postcode, which is used to assign it to a government office region (GOR).
Every sporadic, community-acquired case of LD within England and Wales reported to HPA CfI, with a date of onset between 2003 and 2006 was entered into the study (see the next section on case definitions).
The period 2003–2006 was selected for analysis because in 2002 the largest outbreak of LD that has occurred to date in England and Wales led to heightened interest in the disease, which in turn resulted in better diagnosis and reporting of cases. The years that were included therefore have similar patterns of diagnosis and reporting. Additionally, the study covers a broad range of meteorological conditions and case incidences; there was an unusually high number of cases in the London region during the summer of 2005, and 2003 was a year with a very hot summer but no notable increase in cases. This selection period also allows for three ‘matched’ control years to provide a comparison with the case year.
Meteorological data was obtained from the National Climate Data Centre (NCDC) for weather stations distributed across England and Wales [17]. One station was selected to be representative for each GOR based on completeness of the data for the period of interest, and the following daily data was obtained for 2003–2006: maximum/mean air temperature, dewpoint temperature [used only for the purpose of calculating relative humidity (RH)], total precipitation, and mean windspeed. RH was derived using the following three formulae [18]:
where Es=vapour pressure, E=actual vapour pressure, T c=mean daily air temperature, and T dc=daily dewpoint temperature.
Case definitions
The HPA uses standard case definitions for LD [19]. A sporadic case of LD is defined as any case that is not identified as being part of an outbreak. Outbreaks are defined as at least two cases within a given time-period where there is strong epidemiological evidence of a common source of infection. A travel-associated cluster can span 2 years, whereas community clusters are usually defined as covering, at maximum, a 6-month period.
Community-acquired cases are those who were at home for every night of their 2- to 10-day incubation period. This excludes those who stayed in a hospital (‘hospital-associated cases’) or at a public accommodation site (‘travel-associated cases’) for any night of their incubation period.
Statistical methods
Two initial, exploratory analyses were undertaken to examine (i) the association of cases of LD with meteorological conditions during their incubation period, and (ii) the association of cases of LD with meteorological conditions prior to their incubation period. The results of these two analyses were used to inform the third part of the study, which attempted to combine the influences of both short-term and long-term meteorological effects.
Associations with recent (during the incubation period) meteorological conditions
A case-crossover study design was used to estimate the strength of association between the meteorological variables (mean and maximum daily air temperatures, mean daily precipitation, mean daily RH and daily mean windspeed) and the occurrence of sporadic LD. The meteorological data was collated for each day of each case's incubation period, together with self-controlled data from the same weather station for the corresponding days in the three other study years. A series of conditional logisitic regression analyses were conducted, examining the associations with the meteorological variables for each of the 14 days prior to onset (Fig. 2). This covered the 2- to 10-day incubation period along with extra days to allow analysis of the meteorology immediately prior to infection. Effect modification by year was explored by introducing an interaction term between meteorological condition and year of onset of case.

Fig. 2. Day-by-day odds ratios for maximum temperature, mean temperature, relative humidity, precipitation, and windspeed for each study year.
Associations with long-term (occurring prior to incubation period) meteorological conditions
This analysis was restricted to only those sporadic cases that occurred between 1 August and 31 October each year. Following the removal of any seasonal and temporal trends using periodic regression in both case and meteorological time-series, the data was aggregated into 4-week periods prior to onset. Time-series cross-correlation analyses were performed both on the total data and by each year and region for each weather variable. The summary data is presented in Figure 3.
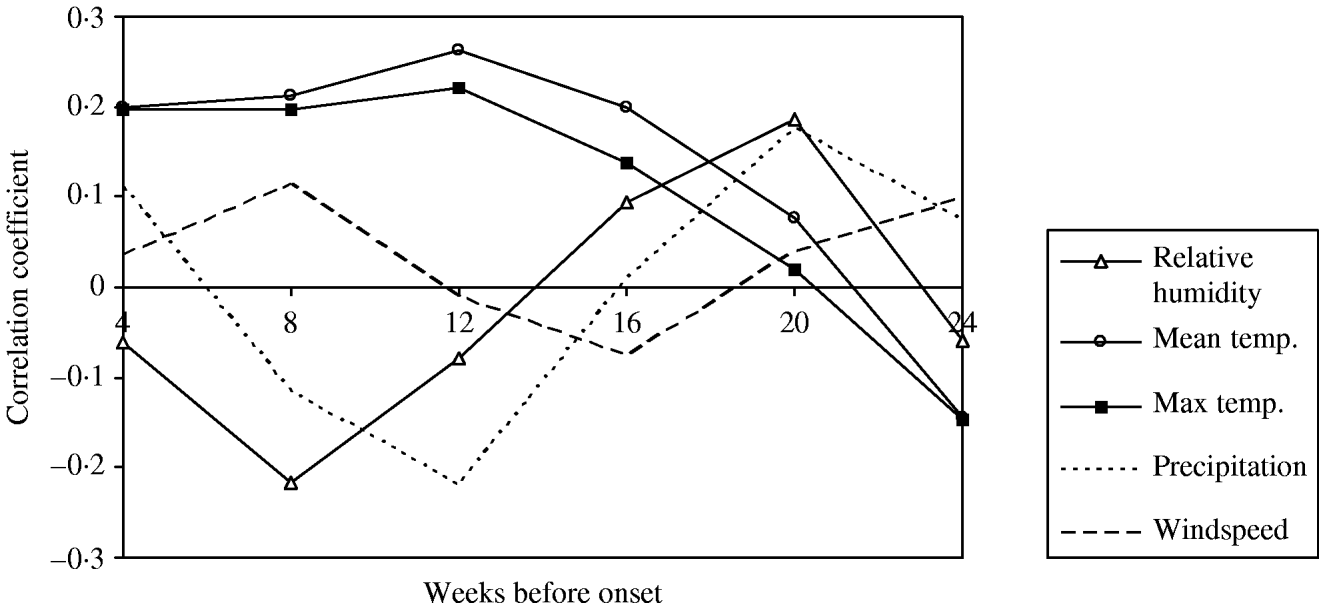
Fig. 3. Time-series analysis of meteorological factors occurring during 4-week lag periods prior to onset of cases of sporadic, community-acquired Legionnaires' disease with onset between 2003 and 2006.
Associations with both short-term and long-term meteorological conditions
A case-crossover methodology was used to compare each case with self-controlled data from the other years in the study using a conditional logistic regression analysis. Effect modification by quarter and year in which the case occurred was explored.
Mean RH during the 2–10 days prior to onset was used (this time-period has reverted to cover only the 2- to 10-day incubation period after results from the first analysis showed little of interest in the days immediately preceding day 10), along with the mean mean and mean maximum temperatures in the 4-week period 10–14 weeks before onset (this straddles the 4-week period centred on the strongest association in Fig. 3). Results for both the mean mean and the mean maximum temperatures are presented for the initial analyses; for the more complex analyses, mean maximum temperatures are primarily used because of the higher biological plausibility of an association with cases of LD.
RESULTS
A total of 551 cases of LD had onset in 2006, almost 200 more than in any previous year. Between July and August the number of cases per month increased dramatically from 43 to 118. The epidemic curve shows two peaks in case numbers: one at the end of August and the second at the beginning of October (Fig. 1).
The total number of cases with onset between 2003 and 2006 was 1538. By excluding 599 cases that travelled abroad during their incubation periods, the dataset used for this study retained only infections known to be acquired within England and Wales; between July and October these increased from 61·6% of the total cases in 2005 to 75·6% in 2006. In total, 140 cases were excluded as having travelled within the United Kingdom during their incubation periods, 32 were excluded as having been associated with a hospital stay during their incubation periods, and a further 93 were excluded as being associated with outbreaks. This left 674 sporadic, community-acquired cases with dates of onset between 1 January 2003 and 31 December 2006 that were entered into the study; 347 of these occurred between 1 August and 31 October 2003–2006.
The Central England temperature time-series gives an overview of the meteorological conditions that occurred in 2006; this was the warmest calendar year on record by a considerable distance, topping a long run of warm years [20]. It is of interest that 2006 experienced lower than normal rainfall, although higher than in 2005 [21].
Associations with recent meteorological conditions
During 2006 the odds ratios for mean RH were significantly higher than 1·0 every day except day 13 prior to onset. The ratios for precipitation also rose above 1·0 for a few days during the 2003 and 2006 incubation periods. Because of the close association between RH and precipitation, the authors did not wish to include both in a more advanced model. These two variables have both been cited as important in the literature, therefore the authors opted to examine RH in further detail based upon the more consistent association in 2006 displayed in Figure 2. Temperature did not consistently show a significant effect and windspeed was not related to case numbers (Fig. 2).
Associations with long-term meteorological conditions
The most notable results arising from this analysis were the high correlation coefficients between the ‘excess’ number of cases of LD and the mean and maximum temperature when these were lagged between 10 and 14 weeks prior to onset (a lag of about 3 months) (Fig. 3). The data also suggested a significant finding for RH and precipitation for a lag of about 5 months. RH was not investigated further since there is no biologically plausible mechanism for it to influence infections occurring 5 months later. Similarly, precipitation was not taken forward because temperature was deemed to be the stronger association, and the investigators wished to avoid further complexity in the model when fitting correlated predictor variables. There were two negative associations that were not investigated further in this study.
Associations with both recent and long-term meteorological conditions
In total, 674 cases of LD were included in the analysis. From January to June there were on average 10 cases or fewer each month. The number then rose and peaked between August and September, after which it declined to above 10 cases in December. There was an obvious increase in cases in 2006, due mainly to large numbers between August and October, inclusive (Table 1).
Table 1. Sporadic, community-acquired cases by month and year of onsetFootnote *
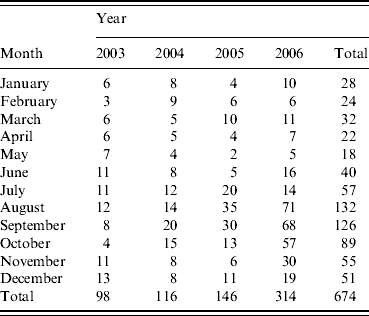
* These differ from the final number of cases for these years published by the National Surveillance Scheme for Legionnaires' Disease in Residents of England and Wales because these were taken as at the end of 2006, and some case reports were received subsequently.
Mean RH was higher by an average of 3·1% [95% confidence interval (CI) 2·1–4·0] during the incubation period in the case year when compared with the control years. The case years also had a higher average mean mean temperature of +0·2°C when compared with the control years in the 4-week period centred around 2 months prior to the onset of cases (95% CI 0·05–0·3°C), and a higher mean maximum temperature of +0·3°C (95% CI 0·2–0·4°C) in comparison to the control years. Where the meteorological data for RH or temperature was missing, the record was excluded from the analyses for that variable.
Multivariable analysis
When mean RH, mean maximum temperature and year were fitted in a simple ‘main effects’ conditional logistic regression model, both of the meteorological variables were significantly associated with LD. The estimated odds ratio and 95% CI being 1·15 (95% CI 1·05–1·27) and 1·09 (95% CI 1·01–1·16) for a 10% increase in mean RH and a 1°C increase in mean maximum temperature, respectively. For both there were significant secular trends, although allowing for this in the model did not remove the associations.
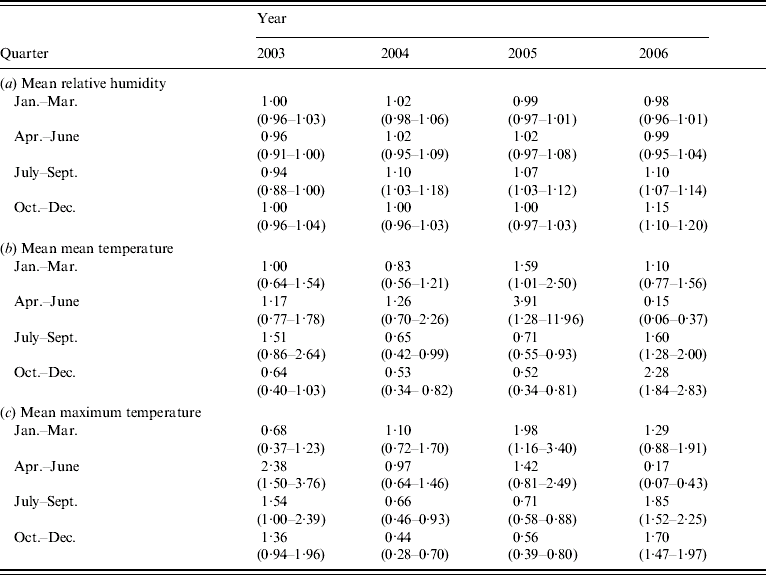
However, further investigation of effect modification by both year and quarter within year by means of the inclusion of interaction terms into the regression model indicated that the above associations were not consistent between quarter or year. There is a significant three-way interaction between year, quarter and mean RH [Likelihood ratio (LR) test 54·5, 9 d.f., P<0·0001], indicating that the association between mean RH and LD was dependent upon both year and quarter (Table 2a). There were also significant three-way interactions between quarter, year and mean mean temperature (LR test 118·3, 9 d.f., P<0·0001), and between quarter, year and mean maximum temperature (LR test 131·54, 9 d.f., P<0·0001), indicating that the association between temperature and LD is dependent upon both year and quarter (Tables 2b, c).
Table 2. Estimated odds ratios (95% confidence interval) from single variable analysis of (a) mean relative humidity, (b) mean mean temperature and (c) mean maximum temperature
When both of the three-way interactions discussed above (quarter, year and mean RH, and quarter, year and temperature interaction) were fitted together in a multivariable conditional logistic regression model, both remained significant (mean mean temperature: LR test 125·14, 9 d.f., P<0·0001; mean RH: LR test 51·18, 9 d.f., P<0·0001), (mean maximum temperature: LR test 169·44, 9 d.f., P<0·0001; mean RH: LR test 54·74, 9 d.f., P<0·0001).
To further explore any interaction between RH, temperature and year, a multivariable model was fitted separately to each quarter. Mean maximum temperature is primarily used in the analyses below.
For January–March, there was no evidence to suggest a year, humidity and temperature interaction (Wald χ2=2·24, 3 d.f., P=0·52). There was also no evidence for two-way interactions between humidity and temperature (χ2=0·50, 1 d.f., P=0·48) or RH and year (P=0·29), however, there was some evidence of an interaction between temperature and year (P=0·05).
For April–June, there was no evidence to suggest a year, humidity and temperature interaction (Wald χ2=3·94, 3 d.f., P=0·27) There was also no evidence for a two-way interaction between humidity and temperature (χ2 =0·83, 1 d.f., P=0·36), however, there was some evidence of a two-way interaction between RH and year (P=0·02). There was strong evidence of a two-way interaction between maximum temperature and year (P<0·001).
For the October–December quarter there was weak evidence to suggest a year, humidity and temperature interaction (Wald χ2=8·34, 3 d.f., P=0·08). There was no evidence for a two-way interaction between humidity and temperature (χ2 =0·16, 1 d.f., P=0·69). However, there were strong two-way interactions between RH and year (P<0·0001), and mean temperature and year (P<0·0001).
For the July–September quarter there was strong evidence to suggest a year, humidity and temperature interaction (Wald χ2=30·79, 3 d.f., P<0·0001). In order to simplify this complex interaction, the mean maximum temperature was dichotomized into <20°C and ⩾20°C. This somewhat weakened the evidence for a three-way interaction between year, humidity and categorized temperature, however, it still remained strongly significant (Wald χ2=13·31, 3 d.f., P<0·004) (Table 3).
Table 3. Estimated odds ratios (95% confidence interval) from multivariable analysis of mean relative humidity for maximum temperature categories for July–September
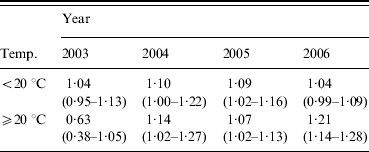
For the cases in this quarter occurring in 2003 there was a protective association when the mean maximum temperature was ⩾20°C. In all other year and temperature categories, increasing RH appeared to be associated with an increase in case numbers; in 2004 and 2006, there was an increase in the strength of association with RH when the mean maximum temperature was ⩾20°C, while in 2005 the stronger association occurred in the <20°C category, however, both temperature categories exhibited similar odds ratios.
DISCUSSION
There is a reasonably consistent association between increased mean RH during the periods when the patients were likely to have been exposed to infection, and sporadic LD occurring between July and September (Table 2). This can be further refined to show that, for two of the years in this study, the association appears to be stronger when the mean maximum temperature during the 10–14 weeks preceding the onset was ⩾20°C. However, this does not hold across all years; for cases arising in 2003 there was a protective association between RH and cases in the ⩾20°C category, while in 2005 there was a slightly stronger association in the <20°C category.
For cases of LD occurring during the winter (January–March), there was no convincing evidence of associations with either RH or mean maximum temperature. For cases occurring in spring (April–June) there was some evidence of an association with mean maximum temperature, however, this was not observed consistently in each year. There is, however, a possibility that meteorological factors other than the two explored in detail in this study could be associated with cases occurring in either winter or spring.
The overall weather in 2003 was very hot and dry, so RH levels were generally quite low [2003 gave the lowest national annual mean RH of the years under study (63·0%), whilst 2006 gave the highest (68·5%)]. In general (under laboratory conditions simulating indoor conditions), survival of L. pneumophila improves with increasing humidity between 30% and 90% RH, and this paper has assumed a linear association, however, the relationship is not as simple as there is a trough at 55% RH and a peak at 65% RH [Reference Hambleton14–Reference Berendt16]. It is possible that there may be a threshold value of RH below which legionellae do not respond to a change in humidity; this may explain why the data from 2003 in the single variable analysis do not fit with the pattern otherwise observed. It could also explain why tropical countries with high temperatures do not experience more cases of LD: their climate may be too dry with too much sunlight to allow prolonged survival of legionellae in an aerosol.
This study has made the assumption that every case's source of infection is local to their domestic area. If a case travelled outside their region during the incubation period, the meteorological conditions affecting their risk of infection may not have been accounted for. Although it was not possible to fully control for this issue, cases that travelled overnight (abroad or within the United Kingdom) were excluded. Due to the relatively small number of cases in this study, no further adjustments were made for occupational travel; a separate study has been proposed to explore this.
In addition, RH can be severely affected by localized conditions, and it is therefore a limitation that only one set of meteorological data was obtained for each region. However, even if this study had used individual readings from weather stations closest to each case, the potential for very localized variation is still high. For instance, the aerosols released by a spa pool might lead to very high RH in the area directly adjacent to the pool, whilst having no effect on individuals who remain at a distance.
There are additional limitations which arise from the meteorological data used for this study. Taking only the daily mean or maximum temperature may not fully represent the environmental conditions affecting the growth of legionella as there can be large disparities between day-time and night-time temperatures.
Our results are consistent with previous work in the field. Hicks et al. found a relationship between rainfall and case numbers [Reference Hicks11]; RH was not investigated. We found some small indications of a similar relationship, however, given that there are strong associations between meteorological factors and RH is influenced by precipitation, it is possible that the relationship established in Hicks' paper described a surrogate factor for RH. This study followed a similar design to Fisman et al. and the results were similarly complex. Fisman's multivariate analysis of month of onset found significant influences of temperature and RH [Reference Fisman10], as did the present study. He also looked at the dose–response relationship of meteorological factors during cases' incubation periods and discovered strong effects of both precipitation and RH; his paper does not discuss whether there was any confounding between these. There was no influence of temperature during the incubation period, which is consistent with our findings.
Our analysis has taken this work further and examined the potential relationships between LD and meteorology by year. The associations do not hold across all years; this suggests that even though our analysis took account of different meteorological influences on the growth and dissemination phases of the bacteria, there are still other important factors that our model has not been able to adjust for. For instance, outdoor survival will be affected by a range of other factors such as sunlight and toxic factors in the air [Reference May, Druett and Pachman22]. It is possible that a more highly pathogenic strain was circulating in the environment in 2006 in comparison with previous years, and that this was responsible for much of the summer increase in cases [Reference Harrison23]. Moreover, some sporadic cases of LD will have been caused by contaminated and poorly maintained aerosol-generating devices, regardless of the prevailing meteorological conditions. However, this paper was examining residuals – the excess number of cases associated with unusual weather conditions. Our results suggest that, in general, the risk of infection will be increased if ambient temperature and RH rise and are therefore more conducive to growth and dissemination of the legionella bacteria in the environment.
Investigations of this kind are important for informing public health actions. If weather conditions conducive to increased legionella growth and dissemination in the environment can be identified, clinicians can be given warning of periods with potentially high case numbers and policies on testing could be targeted appropriately. Information on high-risk periods can also be of use to engineers; prior to the 2006 increase, one large water treatment company noticed an increase in the numbers of legionella-positive samples in their routine monitoring, and wrote to their clients warning them of this (J. V. Lee, personal communication).
These findings also have implications for future case numbers. If temperature does have an important influence on the number of cases of LD, then the effect of possible global warming on case numbers must be taken into account in resource planning. However, high temperatures alone do not necessarily result in high case numbers; the burden of LD in many tropical countries is relatively small, possibly due to low RH.
This paper has examined only 4 years' worth of data. In order to more rigorously test the associations identified, and to ensure that they have not been unduly influenced by the unusual data from 2006, further work will be conducted to examine the case data for England and Wales from 2007 and 2008 to see whether the relationships hold true, and therefore whether it might be possible to predict case numbers from weather patterns.
ACKNOWLEDGEMENTS
The authors thank all microbiologists, CCDCs, local health protection staff and others for providing epidemiological and microbiological data on individual cases of Legionnaires' disease, and for their continued support of the surveillance scheme. We also thank the anonymous reviewers who provided very useful feedback on a first draft of this paper. The meteorological data used in this study was provided by the National Climatic Data Centre, Global Surface Summary of Day, Ashville, North Carolina.
DECLARATION OF INTEREST
None.


