


1. Introduction
The design of offshore structures requires accurate estimation of nonlinear wave loading. At the time of writing, monopiles are the most common form of support structure for offshore wind turbines, which has led to renewed interest in the classical problem of wave loading on columns. MacCamy & Fuchs (Reference MacCamy and Fuchs1954) solved the linear problem many years ago, with the focus since then being on the nonlinear physics of the problem. The nonlinear loading can be divided into two parts. Weak nonlinearity, where the wave does not break, typically generates loads at harmonics of the fundamental incoming wave. For instance, Chaplin, Subbiah & Irani (Reference Chaplin, Subbiah and Irani1992) looked at the local forces on such a cylinder in regular and irregular waves. Loads from other processes that are usually active only above some critical steepness – for instance, loads from breaking waves or the secondary load cycle – can be considered strongly nonlinear (Chella, Tørum & Myrhaug Reference Chella, Tørum and Myrhaug2012). Here, we consider cylinders sufficiently large that drag forces play only a minor role.
Various second-order analytical and numerical models exist (e.g. Eatock Taylor & Hung Reference Eatock Taylor and Hung1987; Kim & Yue Reference Kim and Yue1989; Chau & Eatock Taylor Reference Chau and Eatock Taylor1992), and the third harmonic force was explored by Faltinsen, Newman & Vinje (Reference Faltinsen, Newman and Vinje1995), Malenica & Molin (Reference Malenica and Molin1995) and Newman (Reference Newman1996). The recent analytic work from Taylor et al. (Reference Taylor, Tang, Adcock and Zang2024) has derived a transformation of the third-order FNV theory, which uses only nonlinear surface elevation as input. These and higher harmonics have been studied by various authors, such as Huseby & Grue (Reference Huseby and Grue2000) and Riise et al. (Reference Riise, Grue, Jensen and Johannessen2018a) in experiments and computations. Recently, Chen et al. (Reference Chen, Zang, Taylor, Sun, Morgan, Grice, Orszaghova and Ruiz2018) and Tang et al. (Reference Tang, Ryan, Ding, Chen, Zang, Taylor and Adcock2024) have developed a Stokes-type predictive model for the loading that has been extended to directional seas (Mj et al. Reference Mj, McAllister, Bredmose, Adcock and Taylor2023).
Steep waves breaking on a cylinder will induce slam loads (Sheikh & Swan Reference Sheikh and Swan2005; Masterton & Swan Reference Masterton and Swan2006), for which a variety of models exist (Von Kármán Reference Von Kármán1929; Wagner Reference Wagner1932; Ghadirian & Bredmose Reference Ghadirian and Bredmose2019). The wave-in-deck loads have been explored further by Ma & Swan (Reference Ma and Swan2020, Reference Ma and Swan2023a,Reference Ma and Swanb), where loads are found to be critically dependent upon both the wave shape and the water particle kinematics. The interaction between these waves and the cylinder may create additional strongly nonlinear loading, for instance, from the secondary load cycle, which appears between the passage of the crest and the following trough of the wave. This strongly nonlinear loading was first reported by Grue, Bjørshol & Strand (Reference Grue, Bjørshol and Strand1993) and has been explored further in numerous studies of regular wave trains (Grue & Huseby Reference Grue and Huseby2002; Wang, Xu & Zhang Reference Wang, Xu and Zhang2020; Saincher et al. Reference Saincher, Sriram, Agarwal and Schlurmann2022), focused wave groups (Chaplin, Rainey & Yemm Reference Chaplin, Rainey and Yemm1997) and irregular sea states (Stansberg et al. Reference Stansberg, Huse, Krokstad and Lehn1995; Stansberg Reference Stansberg1997), and also in multidirectional waves (Chaplin, Subbiah & Irani Reference Chaplin, Subbiah and Irani1993, Reference Chaplin, Subbiah and Irani1995). Li et al. (Reference Li, Zhang, Liu, Fan and Zang2022) also deployed the empirical mode decomposition method to isolate the secondary load cycle, and Lee et al. (Reference Lee, Kim, Ko and Hong2021) proposed an empirical formulation to predict the occurrence of the secondary load cycle with regular wave experiments. The related scatter wave field has also been explored by Swan et al. (Reference Swan, Masterton, Sheikh and Cavalletti2005) and Swan & Sheikh (Reference Swan and Sheikh2015) with tank experiments. The potential mechanisms underlying the secondary load cycle have been discussed extensively in the literature, including works by Tromans, Swan & Masterton (Reference Tromans, Swan and Masterton2006), Paulsen et al. (Reference Paulsen, Bredmose, Bingham and Jacobsen2014) and Riise et al. (Reference Riise, Grue, Jensen and Johannessen2018b), and also recently by Antolloni et al. (Reference Antolloni, Jensen, Grue, Riise and Brocchini2020) and Ghadirian & Bredmose (Reference Ghadirian and Bredmose2020), where a suction behind the cylinder is believed to be closely associated with the presence of the secondary load cycle. However, the exact process that triggers the secondary load cycle remains unclear (Chang et al. Reference Chang, Huang, Sun and Li2019; Li et al. Reference Li, Zhang, Liu, Fan and Zang2022).
Additionally, several of these studies reported structural resonant response at the natural frequency triggered by the secondary load cycle (Rainey Reference Rainey2007; Esandi et al. Reference Esandi, Buldakov, Simons and Stagonas2020), which can have detrimental effects on offshore structures. This structural resonant response is also commonly being referred to as the ‘ringing’ response of the offshore wind turbine in various works (Grue et al. Reference Grue, Bjørshol, Strand and Ohkusu1994; Marthinsen, Stansberg & Krokstad Reference Marthinsen, Stansberg and Krokstad1996; Krokstad et al. Reference Krokstad, Stansberg, Nestegard and Marthinsen1998; Grue Reference Grue2002; Zang et al. Reference Zang, Taylor, Morgan, Stringer, Orszaghova, Grice and Tello2010; Liu & Teng Reference Liu and Teng2023), which can also be triggered by higher-harmonic wave forces (Grue & Huseby Reference Grue and Huseby2002) as well as wave breaking (Choi, Lee & Gudmestad Reference Choi, Lee and Gudmestad2015; Ma & Swan Reference Ma and Swan2020).
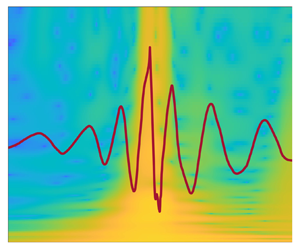
In this paper, we report a quasi-impulsive force associated with the secondary load cycle in the opposite direction to the incoming waves. This backwards force can be identified with the wavelet analysis method shown in figure 1. The wavelet transform shows the spatial–temporal energy distribution of the nonlinear forcing on the vertical cylinder, and enables us to investigate energy change in a short time scale. From figure 1, this backwards force appears towards the end of the secondary load cycle (indicated by the second black dashed line), and its frequency–temporal distribution of energy is superficially similar to the first impact due to wave breaking – having a wide range of high-frequency content (up to over 20 times  $f_p$, the frequency of the wave spectral peak) and a very short duration (usually less than 0.1 s at laboratory scale). In past studies, this impulse force was commonly regarded as a component of the secondary load cycle (Riise et al. Reference Riise, Grue, Jensen and Johannessen2018b). In this paper, however, we find this impulsive force to be an extra nonlinear process happening at the later stage of a secondary load cycle, and occurring at a slightly higher Froude number than the typical secondary load cycle reported previously. As such, the main focus of this study is on this extra nonlinear process, which excludes the initial part of the secondary load cycle.

Figure 1. A demonstration of additional higher-frequency forces associated with the secondary load cycle with wavelet analysis.
To further investigate the quasi-impulsive force, we utilise a novel version of four-phase decomposition Fitzgerald et al. (Reference Fitzgerald, Taylor, Eatock Taylor, Grice and Zang2014), using three of the four phase time histories to recreate what would have occurred in the fourth phase if the secondary load cycle had not occurred. This allows a clean separation of the secondary load cycle from the Stokes-type higher frequency load components. We explore the source of this impact from the scattered wave field using run-up profiles on the cylinder based on the synchronised videos in experiments. We confirm a strong correlation between this quasi-impulsive force with the previously reported Type-II scattered wave in Swan & Sheikh (Reference Swan and Sheikh2015). However, we note that previous work focused primarily on the scattered wave effect at the front face of the cylinder some time after the main interaction. We compare our findings with highly resolved computational fluid dynamics (CFD) simulations, and propose an engineering model to capture the main features of this quasi-impulsive force.
This paper is structured as follows. In §§ 2 and 3, we introduce the experimental and numerical set-ups, respectively. In § 4, we detail the methods used for exploring the underlying physical processes. The results are presented in § 5, followed by discussion and conclusions in § 6.
2. Experimental set-up
We performed experiments in the large towing tank (76 m long, 4.6 m wide, with water depth set to 1.8 m) at the Kelvin Hydrodynamics Laboratory, University of Strathclyde (figure 2). The tank in this study has a 14 m long passive sloping type beach at one end for wave absorption; the typical reflection coefficient from the beach is less than 5 %. At the other end of the tank is installed a state-of-the-art force-controlled active absorbing flap type wave maker, designed and manufactured by Edinburgh Design Ltd. In this study, we focus on focused wave groups, where the reflected waves can simply be excluded from the analysis by ignoring the time series after the wave group passes by. Based on linear wave generation theory, the wave maker is capable of providing a precision uncertainty of only 0.2 %. A single surface-piercing vertical cylinder with radius  $R=0.2$ m, fixed at both ends, was placed 35.3 m away from the wave maker. A hammer test found the natural frequency to be 8 Hz, corresponding to approximately 20.1
 $f_p$ and 14.8
 $f_p$ for two experimental cases presented herein, where
  $f_p$ is the frequency with the peak spectral energy for the wave groups tested.

Figure 2. Experimental set-up and synchronised camera system for experiments at Kelvin Hydrodynamics Laboratory, University of Strathclyde.  $R$ is the radius of the cylinder and
  $2R$ is for the diameter of the cylinder.
In this study, we generated unidirectional focused wave groups based on a JONSWAP spectrum following Young (Reference Young2020) with a peak enhancement factor  $\gamma =3.3$, and generated a wide range in the non-dimensionalised parameter space, with
  $k_p R$ ranging from 0.1 to 0.55, and
  $k_p \eta _{c}$ from 0.05 to 0.42, with detailed parameters shown in figure 7 (
 $k_p$ being the wavenumber associated with frequency
  $f_p$, estimated according to finite wave depth linear dispersion relationship
  $(2 {\rm \pi}f_p)^2=g k_p \tanh (k_p d)$, where
  $d$ is water depth). The relative water depth
  $k_p d$ associated with these wave groups ranged from 1.2 to 3.8, giving intermediate to deep water conditions. Nonlinear wave evolution is expected for steep wave groups as the wave group propagates towards the cylinder (Lo & Mei Reference Lo and Mei1985; Baldock, Swan & Taylor Reference Baldock, Swan and Taylor1996; Adcock & Taylor Reference Adcock and Taylor2009). As such, we recorded the local undisturbed properties of wave groups at the position of the centre of the cylinder by repeating the experiment without the presence of the cylinder and using these results as the undisturbed incident waves. The detailed parameters for two experimental and two numerically simulated cases are presented in table 1.
Table 1. Incoming wave group parameters for the experiments and numerical simulations:  $A_L$ is the maximum crest amplitude at focus as if the wave group evolved linearly,
  $T_p$ is the peak wave period,
  $d$ is water depth,
  $k_p$ is the peak wavenumber associated with the peak wave period, and
  $R$ is cylinder radius.

We also use a four-camera system synchronised with the data acquisition system, to monitor the scattered wave field around the cylinder. The frame rate of these cameras is 20 fps, and a check-board grid was wrapped around the cylinder with the size of each rectangle at 50 mm width, 49 mm height. These synchronised cameras provide a detailed view of the scattered wave field and allow direct extraction of the run-up profile on the cylinder.
3. Numerical set-up
We utilise a computational fluid dynamics model, OpenFOAM, based on the Navier–Stokes equations, in this research. A multi-phase solver, interFoam, is employed to simulate the wave–cylinder interactions, with a volume of fluid method tracking the boundary interface between water and air. The  $k$-
$k$- $\omega$ SST model is used for turbulence modelling.
The numerical wave tank in OpenFOAM uses the same lateral and vertical dimensions as the physical experiments, as shown in figure 3. The width of the numerical wave tank is 4.6 m, and the water depth remains constant at 1.8 m. The cylinder is installed in the middle of the wave tank. Two relaxation zones are defined in both inlet and outlet boundaries. The relaxation zone in the inlet boundary absorbs the reflected waves from the cylinder, while the other relaxation zone, in the outlet boundary, absorbs the incoming waves and suppresses wave reflection. Both relaxation zones are 1.5 times the incoming wavelength, which is the length recommended by Jacobsen, Fuhrman & Fredsøe (Reference Jacobsen, Fuhrman and Fredsøe2012) for complete wave attenuation. Due to the set-up of the relaxation zones, the total length of the numerical wave tank can be significantly shorter than the physical wave tank and without the influence of reflected waves. The total length of the wave tank is 7 times the incoming wavelength. The incoming waves are generated by defining the wave parameters in the inlet boundary with the waves2foam toolbox (Jacobsen et al. Reference Jacobsen, Fuhrman and Fredsøe2012).

Figure 3. Top view of the numerical wave tank and mesh layout around the cylinder in the  $XY$ plane.
The mesh around the cylinder in OpenFOAM is also shown in figure 3. Chen et al. (Reference Chen, Zang, Hillis, Morgan and Plummer2014) conducted a series of mesh convergence tests to determine the appropriate mesh size to predict wave–cylinder interactions accurately. We adopt the same design for the outermost layer of mesh cells, with  $\Delta x = \Delta y = L/140$ and
  $\Delta z = A/8$, where
  $\Delta x$ and
  $\Delta y$ give the horizontal mesh size highlighted in figure 3,
  $\Delta z$ is the vertical mesh size,
  $L$ is the incoming wavelength, and
  $A$ is the incoming wave amplitude. In this work, we refine the thickness, i.e. the horizontal width
  $\Delta x$, of the innermost layer around the cylinder further to 0.2 times the thickness of the outermost layer to capture complex and highly localised wave behaviours, such as steep gradient of wave run-up on the cylinder, and the secondary load cycle. The detailed parameters of the simulation cases are presented in table 1.
4. Methodology
4.1. Three-phase decomposition method
Four-phase decomposition is based on the form of Stokes expansions in both wave amplitude and frequency. The idea is that by running an experiment four times, with the phase of the wave field changed from the original by 90 $^\circ$, 180
 $^\circ$ and 270
 $^\circ$, the principal sum-harmonic contributions can be extracted by linear combinations of the phase-shifted signals.
We modify the four-phase decomposition method discussed in previous studies (Fitzgerald et al. Reference Fitzgerald, Taylor, Eatock Taylor, Grice and Zang2014; Feng et al. Reference Feng, Taylor, Dai, Day, Willden and Adcock2020) to predict the harmonic components of force ( ${F}_{1,2,3,4,5}$) based on only three of the four phases in the decomposition method. The new idea is that if an additional nonlinear process beyond that expected from a Stokes-type expansion (perhaps additional loading from wave breaking) is triggered in only one of the four phases, then we can use the other three phases to make a prediction of the loads in the fourth phase without the additional nonlinearity, and thus isolate the load due to the additional nonlinear process. Let us suppose that the additional nonlinear process occurs in the 0
 $^\circ$ case,
  $\mathbb {F}_{0}$. We can then reconstruct what the total force time history of the
  $\mathbb {F}_{0}$ phase would be if the additional local force had not occurred. The three-phase harmonic extraction (using
  $\mathbb {F}_{90,180,270}$) can be written as
 \begin{equation} \left.\begin{gathered} A {F}_{1}- A^4 F_{4}+A^5 F_{5}+O(A^6) =-\tfrac{1}{4}( \mathbb{F}_{90}+2 \mathbb{F}_{180}+ \mathbb{F}_{270}+ \mathbb{F}_{90}^H-\mathbb{F}_{270}^H),\\ A^2 {F}_{2}- A^4 {F}_{4}+O(A^6) =-\tfrac{1}{2}(\mathbb{F}_{90}+ \mathbb{F}_{270}),\\ A F_{1}- A^3 {F}_{3}+ A^5 {F}_{\boldsymbol{5}}+O(A^7) =\tfrac{1}{2}(- \mathbb{F}_{90}^H+ \mathbb{F}_{270}^H), \end{gathered}\right\} \end{equation}
where the  $H$ superscript is the Hilbert transform of the time series. The predicted time series for the 0
 $^\circ$ case is then compared against the 0
 $^\circ$ case measured in the experiment, and the differences indicate the additional ‘strongly nonlinear’ process beyond that expected from a Stokes-type expansion in force.
Figure 4(a) shows that for a steep wave group without any strong nonlinearity measured in the experiment, the proposed three-phase decomposition method recreates the total harmonic force accurately. For wave groups with additional nonlinear forces beyond the Stokes-type model, the proposed three-phase decomposition method allows the identification of those nonlinear forces beyond the wave loading from the Stokes-type model. As shown in figure 4(b), the three-phase decomposition method separates the secondary load cycle and structural responses from the Stokes harmonics cleanly at the trough of the force time series, and agrees well with the measured force elsewhere. This can also be confirmed in figures 4(c,d), where the difference between the three-phase decomposition predicted force and the measured nonlinear force in the experiment are presented. We subtract the three-phase estimated signal from the measured forces during the experiment to obtain the difference. The additional nonlinear process beyond that expected from a Stokes-type expansion (i.e. the force associated with the high frequency resonant response) is isolated from the measured nonlinear force, which can be further confirmed by the force spectral plots shown in figures 4(e,f).

Figure 4. Three-phase reconstruction of the fourth phase prediction of total diffracted nonlinear forces: (a) a steep wave group without secondary load cycle ( $Ak_p=0.17$,
  $k_pR=0.12$); (b) a wave group with resonance structure response associated with secondary load cycle (case 1,
  $Ak_p=0.18$,
  $k_pR=0.12$); (c,d) the force difference between the three-phase decomposition prediction and the measured force in the experiment for these two wave groups; and (e,f) the corresponding force energy spectrum with logarithmic scale on the vertical axis.
4.2. High-frequency force analysis with wavelets
We further investigate the spatial–temporal energy distribution of the loading by an isolated wave group using wavelet analysis. Similar approaches have been used widely in extreme wave grouping, wave breaking detection and characterisation, and also wave structure impact characterisation (Massel Reference Massel2001; Derakhti & Kirby Reference Derakhti and Kirby2016; Liberzon et al. Reference Liberzon, Vreme, Knobler and Bentwich2019). We follow Derakhti & Kirby (Reference Derakhti and Kirby2016) for the construction of a continuous wavelet transform  $M_{F}(s, t)$ of the discrete sequence of the measured inline force series
  $F(t)$ on the cylinder, with a scaled and translated mother wavelet
  $\phi$ given as
 \begin{equation} E_{ F }(s, t)=\frac{1}{\sqrt{s}} \int_{-\infty}^{\infty} F(\tau)\, \phi^{{\star}}\left(\frac{\tau-t}{s}\right) \mathrm{d} \tau, \end{equation}
where  $t$ is time,
  $s=(\theta _w f)^{-1}$ is the scale factor that dilates the signal when
  $s<1$ and compresses the signal when
  $s>1$,
  $\theta _w=4 {\rm \pi}/(\omega _0+\sqrt {2+\omega _0^2})$ is a constant associated with the Fourier wavelength of the mother wavelet
  $\phi$,
  $F(\tau )$ is defined as the convolution of
  $F(t)$,
  $\tau$ is the translation factor, and
  $^{\star }$ denotes the complex conjugate. The mother wavelet that we adopt is the commonly used Morlet wavelet
  $\phi (t)=\mathrm {e}^{\mathrm {i} \omega _0 t}\, \mathrm {e}^{-(t^2 / 2)}$ (Farge Reference Farge1992), where
  $\omega _0$ is the non-dimensionalised central frequency of the mother wavelet.
In figure 5(a), we show the wavelet scalogram of the three-phase predicted force, which shows the clear structure of higher-order harmonics. The wavelet scalogram also shows almost zero magnitude for frequencies that are higher than  $7f_p$ (see the bottom panel). The measured force including the non-Stokes-like component (in figure 5b), however, shows clear additional peaks above
  $7f_p$, which are not consistent with the Stokes-type higher harmonics model. Similar energy redistribution into the high-frequency range can also be seen in figures 4(e,f), although the time distribution of energy is unresolved in the spectrum. Structural resonance at the natural frequency of the test rig can be triggered during the experiments due to the high-frequency energy content of the quasi-impulsive loading. We remove the structural resonance responses following the frequency response method (Chen et al. Reference Chen, Zang, Taylor, Sun, Morgan, Grice, Orszaghova and Ruiz2018), and apply a response transfer function in the frequency domain. The natural frequency and damping ratio of the system are determined by the damped free vibration curve from a hammer test. We find that the structural responses are significant only at frequencies that are close to the natural frequency.

Figure 5. Wavelet analysis of total diffracted inline force series of case 1 for (a) three-phase reconstruction, (b) measured inline force, with contours varying from 2.6 (in blue) to 110 (in yellow) in  $\log _{10}$ scale. (c) The difference (measured minus three-phase reconstructed) between the two wavelet scalograms; the blue contour shows positive differences, and the red contour shows negative differences. Both contours vary from 2.6 to 8 on a linear scale. The units for wavelet amplitude are N
  $\sqrt {\textrm {Hz}}$. In the bottom panels, we present the integrated wavelet scalogram increase for force components with frequency content larger than
  $7f_p$ in blue, and the integrated wavelet scalogram reduction in the linear region in red (i.e. between
  $0.7f_p$ and
  $1.6f_p$), where
  $f_p$ is peak frequency.
We subtract the wavelet scalogram of the three-phase estimated signal from the measured scalogram during the experiment to obtain the difference between these two plots in figure 5(c), which demonstrates the magnitude change due to the presence of the quasi-impulsive force and the associated secondary load cycle. We observe a magnitude reduction in the linear and second-order sum-harmonics frequency range over a slightly longer time, and a sharp magnitude gain in a wide range of high frequencies happening over a very short time interval. This quasi-impulsive energy gain in high frequencies is superficially similar to the energy increase reported during slamming impacts (Esandi et al. Reference Esandi, Buldakov, Simons and Stagonas2020). This difference between the measured force and the three-phase predicted force indicates that the strong nonlinear effects (i.e. the secondary load cycle and the associated backwards quasi-impulsive forcing) cause extra energy transfer from low frequencies to a wide range of high frequencies in a short period of time.
4.3. Wave run-up on the cylinder with image processing
The four-camera system in our experiments provides a set of synchronised views of the scattered wave field from different angles. In this study, we analysed in detail the video captured by the side camera. An example of a frame captured by this camera is shown in figure 6. We deployed standard camera calibration and check-board detection procedures (Zhang Reference Zhang2000). We first detected the edges of each check-board rectangle with a corner detection algorithm, where the locations with significant image intensity value variation in multiple directions are labelled. The intrinsic and extrinsic parameters of the camera can be estimated based on these identified corner points.

Figure 6. Validation results for our image processing approach on wave run-up. (a–d) The wave run-up profile on the cylinder, with red dot indicating the run-up point at the centre of the cylinder. The arrow indicates the incoming wave direction. (e) Wave run-up profile compared against surface elevation without cylinder. Dashed lines indicate the time instances of the photos from (a) to (d).
The wave run-up points (i.e. the air–water boundary) on the cylinder are extracted manually for every frame that is close to the focus time of the wave group. The camera parameters determined in the calibration stage are then used to accurately interpret the image by matching the pixel coordinates to the real-world coordinates. The still-water level is determined by processing frames at the start of the experiment when the flume is free of waves.
We present the validation case here in figure 6, where we applied the image processing method to a quasi-linear experimental case, where we expected minimal nonlinear wave run-up and wave scattering at the shoulder point (i.e. the most outer point of the cylinder in the transverse direction of the incoming wave field). The captured run-up profile matches well the empty tank surface elevation time history from a wave gauge at the same location, excluding the presence of what we interpret as the Type-II wave scattering, as shown in figure 6(d).
5. Results
5.1. Occurrence of secondary load cycle and structural response
We first investigate the occurrence of the quasi-impulsive loading over 200 wave group experimental runs. We present the experimental results in figure 7, with the horizontal axis showing the non-dimensionalised incoming wave steepness, and the vertical axis the non-dimensional cylinder radius.

Figure 7. Occurrence of the secondary load cycle (SLC) and structural response compared against previous results reported by Saga Petroleum (1995), Grue & Huseby (Reference Grue and Huseby2002) and Chang et al. (Reference Chang, Huang, Sun and Li2019);  $Fr$ is calculated following Riise et al. (Reference Riise, Grue, Jensen and Johannessen2018b).
We have also included reference lines for a Froude number that has been found to be a good predictor of a secondary load cycle (Grue et al. Reference Grue, Bjørshol and Strand1993). Recent studies also suggest that this extra nonlinear loading can occur at short waves outside the flow separation regime (Antolloni et al. Reference Antolloni, Jensen, Grue, Riise and Brocchini2020). The two lines are at  $Fr=0.3$ and
  $Fr=0.4$. We have another line for
  $Fr=0.45$ as a predictor of the backwards quasi-impulsive loading, with details explained further at the end of this section. Following Riise et al. (Reference Riise, Grue, Jensen and Johannessen2018b), we estimate the Froude number as
 \begin{equation} F r= 2 {\rm \pi}\eta_c / T_p \sqrt{g D}, \end{equation}
where  $\eta _c$ is the maximum surface elevation measured from the empty tank results at the centre of the cylinder,
  $T_p$ is the peak wave period,
  $g$ is the gravitational acceleration, and
  $D = 2R$ is the cylinder diameter.
We identify the secondary load cycle following the method presented in Riise et al. (Reference Riise, Grue, Jensen and Johannessen2018b), where the high-frequency force signals above  $3.5f_p$ are investigated manually. We find that the Froude number with a threshold approximately between 0.3 and 0.4 can separate the cases into those with a secondary load cycle on the right of the Froude number curve, and those without to the left. Our results are consistent with previous studies (Grue & Huseby Reference Grue and Huseby2002; Chang et al. Reference Chang, Huang, Sun and Li2019). This is also shown in figure 7.
For the occurrence of this quasi-impulsive wave force, it was challenging to find a simple and straightforward way of identifying these occurrences directly from the inline force time series. As such, we manually examine the wavelet scalogram, and label those cases with this extra impulse. We identify this quasi-impulsive force with a significant energy contribution above  $7f_p$ after removing the force components due to the structural response, following the frequency response method in Chen et al. (Reference Chen, Zang, Taylor, Sun, Morgan, Grice, Orszaghova and Ruiz2018).
From figure 7, we report that the extra quasi-impulsive force does not always take place when a secondary load cycle appears during the experiment. Instead, the occurrences of these quasi-impulsive forces require higher wave steepness or more slender cylinders when compared to the cases with only the secondary load cycle, which also approximately follow the Froude number scaling with a higher threshold of approximately 0.45 (also shown in figure 7). We also identify structural resonance as a clear energy peak around the natural frequency of the structure (8 Hz), which also closely follows the occurrence of the secondary load cycle. We observe clear structural resonance for all the cases with this quasi-impulsive force in the current experimental set-up, which suggests a strong interconnection between these two processes. However, we note that this observation is not directly applicable to the structural resonance in the field as the response characteristics of the systems in the laboratory scale are very different from those in the field scale.
5.2. Wave nonlinear run-up and scattering
We further investigate the source of this quasi-impulsive backwards loading starting from the wave run-up on the cylinder. Based on the image processing method outlined in § 4.3, we first present the run-up time histories at the shoulder of the cylinder (i.e. the most outer point of the cylinder in the transverse direction of the incoming wave field) for numerical simulations and experimental observations in figure 8. For both cases, the wave run-up time histories show a clear localised peak after the main wave crest, presumably due to the wave scattering around the cylinder. We also observe an alignment in time between this localised peak and the quasi-impulsive force, both of which occur at  $0.3T_p$ after the maximum force peak.

Figure 8. Comparison between the wave run-up at the shoulder (i.e. the most outer point of the cylinder in the transverse direction of the incoming wave field) of the cylinder (red), surface elevation measured at the cylinder centre but without cylinder (blue), and total diffracted inline force (green) for (a) experimental results (case 1) and (b) numerical simulations (case 3).
We further explore the localised peak in the run-up associated with the wave scattering field captured during experiments, as shown in figure 9(e). We compare the run-up time series with the empty tank surface elevation, and both of these profiles agree well, though with two main differences. These two departures are consistent in both the experiments and numerical simulations using OpenFOAM. First, the run-up profile on the cylinder is higher than the empty tank elevation at the crest of the wave. This is due to a thin water sheet run-up projected upwards on the surface of the cylinder, as shown in figure 9(c). This is consistent with previous numerical studies (Chen & Zhao Reference Chen and Zhao2022). The localised peak in a shorter time scale is caused by a Type-II scattered wave travelling in the opposite direction to the incoming wave. This wave will travel around the cylinder, and the scattering of this wave in the latter stages is consistent with the Type-II scattering reported previously by Swan & Sheikh (Reference Swan and Sheikh2015).

Figure 9. (a–d) Wave run-up profile for case 1 on the cylinder, with red dots indicating the run-up point around the cylinder. The arrow indicates the incoming wave direction. (e) Wave run-up profile for case 1 at the shoulder point of the cylinder – i.e. the most outer point of the cylinder in the transverse direction of the incoming wave field – (red) compared against the surface elevation measured at the cylinder centre but without cylinder (blue). The empty tank surface elevation (blue) corresponds to the red and blue lines in figure 8(a). Dashed lines indicate the time instances of the photos from (a) to (d).
We present the spatial–temporal wave run-up profile in figure 10, where the Type-II scattering is initially formed at the back of the cylinder and travels around the body perimeter towards the front stagnation point. As this local wave disturbance moves, it introduces local maxima in the run-up profiles. The pink plane on the figure indicates the time when the quasi-impulsive force is measured in the experiment, which is close to the time when the Type-II scattered wave was first detected in the run-up. We report comparable sizes of runup on the upstream and downstream sides within the view angle of our synchronised camera system in the experiment. This trend is consistent with numerical simulation results, and the large runup from the downstream side of the cylinder has been previously reported by Ghadirian & Bredmose (Reference Ghadirian and Bredmose2020) with numerical simulations and also from experiments by Kristiansen & Faltinsen (Reference Kristiansen and Faltinsen2017).

Figure 10. Wave run-up profile on the cylinder for case 1 with (a) spatial–temporal evolution with red plane indicating the time instant ( $T_{Emax}$) when the wavelet scalogram shows a peak for high frequency force (
 $\,f>7f_p$), and (b) cross-section planes of spatial–temporal profile at various positions along the cylinder. Here,
  $\theta = 0$ for the front stagnation point, and
  $\theta = 180$ for the rear stagnation point of the cylinder. Each line is separated by 0.1 m, starting from the
  $\theta = 70$ case. The wave group that we analysed here has peak period
  $T_p = 2.5$ s and wave steepness at linear focus
  $k_pA = 0.175$ and
  $k_pR=0.147$.
5.3. Backwards forces estimation with impact model
To further investigate the time correlation between the appearance of the Type-II scattered wave and the quasi-impulsive backwards force, we track the motion of the Type-II scattered wave around the cylinder with the maximum local run-up points. We present the time when the local run-up profile reaches a localised maximum ( $T_{\eta,c}$) for different locations on the cylinder in figure 11(a). The non-dimensionalised position of different observation nodes along the
  $x$ direction is shown on the vertical axis, with the circumferential angle in the colour gradient. The
  $x$ position is defined as the projected distance along the tank centreline, and a positive value of
  $x$ indicates the rear side of the cylinder.

Figure 11. (a) The locations of sampling points along the cylinder for case 3 against the arrival time of the Type-II scattered wave (calculated as the time when run-up reaches a local maximum at each sampling point). The red line shows the slope of the linear fitted line used to calculate the speed of the wave. Here,  $x$ is defined as the projected distance along the tank centreline, and a positive value of
  $x$ indicates the rear side of the cylinder. (b) The combined plot of the wavelet scalogram and the corresponding total inline force profile. The black dashed line in both (a) and (b) indicates the same time instant
  $T_{Emax}$ when the wavelet scalogram shows a peak for high-frequency force (
 $\,f>7f_p$). The non-dimensionalised
  $k_{p}R$ value of the cylinder radius is 0.147 in the presented case.
The local maximum run-up point first appears close to the rear point of the cylinder and agrees well with the observations reported by Kristiansen & Faltinsen (Reference Kristiansen and Faltinsen2017). In addition to this gradual process, we also observe the local maximum run-up point suddenly accelerates, travelling at a faster speed towards the front side of the cylinder. This suggests that a faster-moving wave (i.e. the Type-II scattered wave) appears from the rear side of the cylinder and propagates in the opposite direction to the incoming wave. More importantly, this sudden acceleration of the local maximum run-up point coincides with the time when the quasi-impulsive force occurs, and can also be clearly seen in the wavelet scalogram in figure 11(b). This suggests that the arrival of the Type-II scattered wave is closely connected to the quasi-impulsive force observed experimentally. Also, the secondary local cycle seems to start earlier (i.e. when wave run-up reaches the maximum near the rear stagnation point) and initially moves away with a much slower propagation speed. This difference in the time scales suggests that the quasi-impulsive force discussed here could potentially be caused by a different underlying physical process from the typical secondary load cycle discussed in the literature.
We now investigate the entire scattering wave field in the vicinity of the cylinder at the time instant when this quasi-impulsive force occurs, as shown in figure 12. The numerical simulation results for the scattered wave field are presented in figure 12(b) with the empty tank elevation subtracted to remove the influence of the undisturbed incident wave. In figure 12(a) and also movie 1 in the supplementary material (available at https://doi.org/10.1017/jfm.2024.648), localised ‘white caps’ can be observed at the back of the cylinder with a rough scattered wave field, and the splashing of the water with a significant amount of air entrainment is superficially similar to the classic wave breaking processes. We also observed an evident initial engagement of the Type-II scattered wave with the rear side of the cylinder, which was further confirmed by the videos captured by the side view camera during the experiment (see the supplementary material for details). Similar observations on the scattered wave field profiles are also reported by Ghadirian & Bredmose (Reference Ghadirian and Bredmose2020) with numerical simulations, and also from experiments by Kristiansen & Faltinsen (Reference Kristiansen and Faltinsen2017).

Figure 12. Wave scattering field at the time when high-frequency forces impact first occur for (a) experimental results (case 3), with the empty tank surface elevation in (c) and total inline force in (d). (b) Numerical simulation (case 1). Red dots indicate the current time of the plot. Movie versions of both experimental and numerical results are provided in the supplementary material.
Finally, we adapt a classic wave impact model to demonstrate the time correlation between the Type-II scattered wave and the quasi-impulsive force in the reverse direction. We focus on this backwards quasi-impulsive force at the later stage of the secondary load cycle, and the impact model discussed in this study does not capture the initial part of the secondary load cycle. The aim here is to build a practical model for approximating this force that captures the essential elements. The model assumes an infinite lateral width of the impacting wave crest, and a curling factor to capture the shape of the rolling break. The ambiguity in these assumptions may affect the quantitative estimation of the impact magnitude, but not the impact time calculations, which is the key objective here. The latter depends primarily on the speed of the wave and the geometry of the cylinder, both of which can be estimated directly from numerical simulations and experiments with the run-up profile.
The quasi-impulsive impact from locally breaking waves on a vertical cylinder may be modelled using various versions of the wave impact model (e.g. Von Kármán Reference Von Kármán1929; Wagner Reference Wagner1932; Ghadirian & Bredmose Reference Ghadirian and Bredmose2019). In this study, we apply one of the most commonly used breaking wave models based on the work of Goda (Reference Goda1966) to the new quasi-impulsive force acting backwards against the wave propagation direction. This is formulated as
 \begin{equation} F_I(t)=\lambda \eta_b C_s \rho R c^2\left(1-\frac{c}{R}\,t\right), \end{equation}
where  $\lambda$ is the wave curling factor,
  $\eta _b$ is the crest height of the incoming wave,
  $c$ is the wave celerity,
  $\rho$ is the fluid density,
  $C_s$ is the impact coefficient, and
  $R$ is the cylinder radius. The values of some of the coefficients are given in table 2. From table 2, the impact time, which can be estimated as
  $R/c$, is very small. This agrees well with the observation that this new quasi-impulsive force has a very short duration from the wavelet analysis.
Table 2. Values used for the impact model. The peak impact crest height is obtained as the difference between the measured run-up height and the empty tank undisturbed wave field (i.e.  $\Delta \eta$ in figure 12b), and the crest speed is obtained based on the slope in figure 11. The (a–d) notation corresponds to the values measured for two experimental results (cases 1, 2) and two numerical simulation results (cases 3, 4), respectively, which are also presented in figures 13(a–d).

To adopt the classic wave impact model, we estimate the impact crest height ( $\eta _{b}$) as the difference between the measured run-up height and the empty tank undisturbed wave field (i.e.
  $\Delta \eta$ in figure 12a). The wave celerity (
 $c$) can be calculated directly as the gradient of the
  $x\unicode{x2013} t$ plot shown in figure 11(a). For the other terms, such as impact coefficients, curling factor and impact time formulation, we use standard values (Goda Reference Goda1966) shown in table 2 without any further modification. We present the prediction of this quasi-impulsive force based on the Type-II scattered wave in figure 13. We used the three-phase decomposition method to remove any nonlinear force beyond the Stokes expansion for both the experimental cases (figures 13a,b) and one numerical simulation case (figure 13d). For the numerical simulation results in figure 13(c), where the three-phase decomposition is not applicable due to the secondary load cycle appearing in multiple phases, we utilise a low-pass filter at
  $2.4f_p$ to remove the nonlinear force associated with impact and the secondary load cycle, following Riise et al. (Reference Riise, Grue, Jensen and Johannessen2018b).

Figure 13. Comparison of measured total inline forces (blue), three-phase reconstruction or low-pass filtered (at  $2.4f_p$) estimated inline forces without high-frequency loading (red), and the linear combination of the three-phase predicted force with impact loading estimated from the Goda impact model (green) for (a,b) experimental results (cases 1, 2), and (c,d) numerical simulations (cases 3, 4). The lower plots show zoomed-in views around the trough, with the backwards impact force estimated by the Goda impact model (Goda Reference Goda1966).
We recover the local inline force by superimposing an impact in the opposite direction to the incoming wave, which leads to better agreement between the measured force and both the numerical simulations and experiments. However, this additional load component does not capture the secondary load cycle, as the phenomenon occurs before the impact. Unsurprisingly, the proposed impact model cannot accurately capture the magnitude of this negative impact, primarily because the underlying mechanism and behaviour of the Type-II scattered wave are distinct from the typical incoming breaking wave hitting an obstacle. For example, as shown in figure 7, this Type-II scattered wave forms a crescent shape and affects the scattered wave field only within the first 0.5 $R$ of the cylinder. Nevertheless, the fact that this simplified breaking model can recover most of the characteristics of the quasi-impulsive force, particularly with accurate arrival time estimations, suggests a strong correlation between the Type-II scattered wave and this backwards impact.
6. Discussion and conclusions
In this paper, we investigate a new loading component in the form of a quasi-impulsive force acting in the opposite direction to the incoming waves, which is associated with the secondary load cycle. To identify this new force, we utilise a novel three-phase decomposition method to separate nonlinear forces beyond the main Stokes-type expansion, as well as the wavelet transform to explore the frequency–time energy distribution. We confirm that this backwards force, which occurs immediately after the secondary load cycle, has somewhat similar characteristics to a classic breaking wave impact at the crest of the wave. A significant amount of high-frequency energy is identified at the impact time across a wide range of frequencies, which can be observed clearly up to 20 $f_p$ in the wavelet scalogram in the log scale.
We further investigate the spatial–temporal evolution of the wave run-up profile on the cylinder, and use a classic wave impact model to examine the interconnections between the run-up and the nonlinear quasi-impulsive force. The strong time correlation match between the occurrence of this quasi-impulsive force and the arrival of the Type-II scattered wave suggests that the scattered wave is likely to be the source of this nonlinear force in the opposite direction. Because of the complexity of the violent scattered field on the rear side of the cylinder, we found it challenging to rule out all other potential causes of this quasi-impulsive force on the cylinder. For example, a head-on collision of disturbances around the back of the cylinder would lead to a similar impact but should take place slightly earlier. However, from the observation that we are able to approximate this impulse with a simplified impact model without further modification for four different cases (two physical experiments, and two in CFD), we are confident that the impact from the Type-II scattered wave contributes to the impulse that we identified.
We hope that this work sheds some light on the secondary load cycle phenomenon, as the quasi-impulsive force appears to happen immediately after it. As mentioned in the Introduction, this impulsive force is generally considered a part of the secondary load cycle in previous literature where some common characteristics have been described. In line with this perspective, our findings are in agreement with numerous prior investigations, including the notable amplification of energy observed in the fourth and fifth harmonics reported by Kristiansen & Faltinsen (Reference Kristiansen and Faltinsen2017), as well as the interpretation of the secondary load cycle as a prominent nonlinear phenomenon in Rainey (Reference Rainey2007). However, our results suggest a hypothesis of multiple underlying physical processes contributing to the secondary load cycle, with different time scales and durations. We explored the faster-travelling Type-II scattered wave that arrives later in the time line with an extremely short duration. Prior to this backwards impulsive force, the local maximum run-up on the cylinder suggests a slower underlying process, which contributes to the initial rise of the secondary load cycle. This slow-rising process is not covered by the current study and deserves further investigation.
We would also like to discuss the limitations of our study. Due to the physical constraints of the experimental facility, our quantitative analysis is restricted to the wave run-ups on the cylinder, and we have qualitative data available only for the entire wave scattering field in the experimental results. Unfortunately, this limitation presents significant challenges when investigating the initial part of the secondary load cycle. Another limitation of this study is that we consider only unidirectional wave fields, which differ from the spread wave fields in the open ocean. Although we have limited insights into how the quasi-impulsive force would behave in spread seas, we believe that our unidirectional results serving as a limiting case will still provide valuable insights into the underlying physics.
In this study, we focused on the hydrodynamic force on a fixed vertical cylinder, which is the first step towards a better understanding of the subsequent structural responses during the secondary load cycle. Some evidence, however, has indicated that this impulsive force is also important for the subsequent structural responses. We observe clear structural resonance at the natural frequency (so often called ringing responses) for all the cases with this quasi-impulsive force present for the entire experimental campaign (see figure 7). Unfortunately, the current experimental set-up limits further assessment of the response effect for several reasons. First, the structural dynamics characteristics are very different for the test rig (20 times peak wave frequency) and for the offshore wind turbine (2–3 times peak wave frequency; Schløer, Bredmose & Bingham Reference Schløer, Bredmose and Bingham2016). Second, the current laboratory scale is also very different from the field scale. As such, further studies are required with flexible supported cylinders or large-scale numerical simulations to examine the impact of this quasi-impulsive force on the subsequent structural responses.
Finally, we would like to discuss the implications of this study. Our results provide a possible explanation for the question of why the secondary load cycle associated structural resonance phenomenon persists even if the natural frequency of the system is set to be tens of times higher than the wave frequency (20 times higher in our experiments). It seems that the excitation of the structural resonance by the secondary load cycle shares a very similar underlying process with that due to wave breaking at the crest: a short-duration quasi-impulsive event excites the system at its natural frequency. One significant difference, however, is that the impulsive event from the secondary load cycle is in the opposite direction to the incoming wave. This new and unexpected impact direction requires further attention in future offshore designs, as previously, wave impacts were believed to be predominantly aligned with the mean wave direction. Our study here also suggests an additional physical process to be considered when predicting the wave impacts on the monopile foundations and similar cylindrical supporting structures: in addition to the well-known breaking wave impact, the nonlinear scattered wave field can also lead to a quasi-impulsive impact, which happens at a much lower wave steepness than these wave breaking events.
Supplementary material
Supplementary material is available at https://doi.org/10.1017/jfm.2024.648.
Acknowledgements
An abbreviated version of this work was recently reported at IWWWFB38. We thank Professors J. Grue, T. Kristiansen and H. Bredmose for their comments on the work at the workshop. We thank Professor R. Eatock Taylor for his detailed comments and intriguing discussions with the authors. For the purpose of Open Access, the author has applied a CC BY public copyright licence to any Author Accepted Manuscript (AAM) version arising from this submission.
Funding
This research is funded by EPSRC grant EP/V050079/1. T.T. is also funded by Eric and Wendy Schmidt AI in a Science Postdoctoral Fellowship.
Declaration of interests
The authors report no conflict of interest.
Author credit statement
T.T.: conceptualization, methodology, experiment, software, validation, formal analysis, data curation, writing – original draft, visualization. H.D.: investigation, experiment, writing – review & editing. S.D.: experiment, investigation. J.Z.: methodology, resources, experiment, writing – review & editing, supervision, funding acquisition. P.H.T.: conceptualization, methodology, supervision, data curation, writing – review & editing. T.A.A.A.: methodology, resources, writing – review & editing, supervision, project administration, funding acquisition.


 Open access