Traumatic brain injury has commonly been reported as an experience of military personnel, and the prevalence of brain injury and its effects on general populations exposed to war violence has not been studied in recent years. Research on the neuropsychiatric sequelae of war focused on the prevalence of neurocognitive deficits in combat veterans (Reference Sutker, Winstead and GalinaSutker et al, 1991; Reference Bremner, Scott and DelaneyBremner et al, 1993; Reference Gurvits, Lasko and SchachterGurvits et al, 1993; Reference Uddo, Vasterling and BraileyUddo et al, 1993; Yehuda, 1995; Reference Barrett, Green and MorrisBarrett et al, 1996; Reference Sutker and AllainSutker & Allain, 1996) and prisoners of war (POWs) (Sutker, 1990a,b; Sutker et al, Reference Sutker, Winstead and Galina1991, Reference Sutker, Allain and Johnson1992, Reference Sutker, Vasterling and Brailey1995; Reference Sulway, Broe and CreaseySulway et al, 1996; Reference Sutker and AllainSutker & Allain, 1996). In a survey of the medical and psychiatric sequelae of torture, we found that brain injury was reported by international centres caring for survivors of torture as a significant psychiatric risk factor (Reference Goldfeld, Mollica and PesaventoGoldfeld et al, 1988). Rasmussen and his colleagues (Reference RasmussenRasmussen, 1990), in their clinical examination of 200 torture survivors, found neurological impairments in 64%, two-thirds of whom had experienced head injury.
The goal of this study was to examine the psychiatric effects of traumatic brain injury in a general civilian population that had experienced mass violence. The findings presented demonstrate the association between traumatic brain injury and the psychiatric symptomatology of major depression and post-traumatic stress disorder (PTSD) in a general population of Cambodian refugees who survived the Pol Pot regime of 1975-1979.
METHOD
Descriptions of the sampling design, interviewer recruitment, training and the cross-cultural validation of survey instruments, including validity and reliability of scales, have been previously published (Mollica et al, Reference Mollica, Donelan and Tor1993, Reference Mollica, McInnes and Poole1998b ; Smith-Fawzi, 1997). The survey interviewers were educated Cambodian refugees who were health and social service providers with extensive mental health training. Training was conducted by Harvard Program in Refugee Trauma (HPRT) staff, including senior Cambodian mental health workers with over a decade of clinical experience (Reference Mollica, Donelan and TorMollica et al, 1993). Quality assurance was guaranteed by ongoing supervision of all interviewers, including random spot checks, by the Khmer People Depression Relief Unit. Signed statements of informed consent were obtained from all participants. All participants interviewed met the United Nations definition of a displaced person. The participants had lived in the refugee camp (known as Site 2) for up to 10 years before this survey. The project was approved by the Human Subjects Committee of the Harvard School of Public Health and by the field medical ethics committee of the camp administrators, United Nations Border Relief Operation (UNBRO).
Sampling
Participants were selected by a multi-stage area sampling procedure that randomly assigned 100 sampling points to Site 2's five sub-camps in proportion to the numbers of households in each sub-camp (Reference LynchLynch, 1989). The starting-place within each point and the order of points within sub-camps were randomly assigned. When interviews were completed for ten households, a sampling point was completed. At each household, the interviewer completed a roster including the age and gender of each resident, and selected an adult person of 18 years of age or more at random to be the respondent for the household.
Assessment
The survey interviewers were volunteer residents of Site 2 with extensive mental health experience. They were equally distributed by gender and received 4 days of training. Each interviewer was assigned randomly to primary sampling units other than the one in which he/she resided. The interviews were conducted in Cambodian and took an average of approximately 90 minutes. A survey questionnaire (Reference Mollica, Donelan and TorMollica et al, 1993), previously used in Khmer populations, was adapted and translated specifically for this study. Translation methods were employed to construct the final version of the interview schedule using the standard methods of cross-cultural research (Reference WestermeyerWestermeyer, 1985; Reference Flaherty, Gaviria and PathakFlaherty et al, 1988). This also included back-translation by experts in American psychiatry and Khmer mental health.
The trauma history was derived from the Cambodian version of the Harvard Trauma Questionnaire (HTQ; Reference Mollica, Caspi-Yavin and BolliniMollica et al, 1992). Measures of cumulative trauma were constructed from responses to questions about trauma events in Cambodia during the Pol Pot era and in Site 2 during the year before the interview (1989-1990). For each time period, affirmative responses were summed for 28 trauma events.
The 28 trauma events were grouped before analysis according to the kinds of trauma experienced as follows: (a) material deprivation (three events: lack of food or water, lack of shelter, and ill health without access to medical care); (b) warlike conditions (three events: combat situation, forced evacuation under dangerous conditions, shelling or grenade attacks); (c) definite traumatic brain injury (three events: beatings to the head, near-drowning, near-suffocation with a plastic bag); (d) bodily injury (four events: rape, torture, knifing or axing, beatings to other parts of the body); (e) coercion (seven events: imprisonment, brainwashing, being lost or kidnapped, forced labour, forced marriage, extortion or robbery by armed bandits); (f) violence to others (nine events: witnessing the murder of a family member or friend, witnessing the murder of a stranger, witnessing torture, witnessing rape, witnessing knifing or axing, witnessing beatings to any part of the body, witnessing a suicide attempt, witnessing near-drowning, witnessing near-suffocation with a plastic bag).
Symptom scales
Two interview schedules were used to measure psychological symptoms: a 25-item section of the Hopkins Symptom Checklist (HSCL-25; Reference Mollica, Wyshak and DeMarneffeMollica et al, 1987) and a 31-item section of the HTQ (Reference Mollica, Caspi-Yavin and BolliniMollica et al, 1992). The HSCL-25 was developed as a measure of emotional distress. It comprises two sub-scales: a 10-item scale of anxiety symptoms and a 15-item scale of depressive symptoms. The post-traumatic stress symptom section of the HTQ consists of a scale made up of 16 of the 17 diagnostic criteria for PTSD (DSM-III-R and DSM-IV (American Psychiatric Association, 1987, 1994)) which measures symptoms of re-experiencing traumatic events, avoidance of stimuli associated with the trauma, numbing of general responsiveness and increased arousal. Physiological reactivity to events that symbolise or resemble the traumatic event, a symptom of arousal in the DSM-III-R, was omitted because of our inability to make appropriate physiological measurements.
The HTQ also includes a scale for culturally dependent symptoms, developed from clinical experience with Indochinese refugees, and a dissociation scale, scoring from 1 to 4 (high). In both schedules, respondents were asked to what extent they had been disturbed by each symptom during the past week.
Symptom scores for the HTQ and HSCL-25 are expressed as arithmetic means of these item-specific scores. Indochinese versions of the HSCL-25 and HTQ have been validated by the HPRT against clinical diagnoses in a sample of Indochinese refugee patients in a psychiatry clinic in the United States (Mollica et al, Reference Mollica, Wyshak and DeMarneffe1987, Reference Mollica, Caspi-Yavin and Bollini1992), and in community samples of Vietnamese and Cambodian persons living in eastern Massachusetts (Reference Caspi-YavinCaspi-Yavin, 1995). The psychometric properties of the Cambodian HSCL-2 and HTQ instruments have been well established (Mollica et al, Reference Mollica, Wyshak and DeMarneffe1987, Reference Mollica, Caspi-Yavin and Bollini1992). The HSCL sub-scale of anxiety symptoms, a nonspecific measure that overlaps with many anxiety disorders, was not included in the analysis because it had not been validated in Cambodian populations with the DSM-III-R, DSM-IV, the Structured Clinical Interview for DSM-IV-TR Axis I disorders (SCID-I/P), ICD-9 or ICD-10 (World Health Organization, 1978, 1992).
Analysis
All analyses were conducted on the SAS System, Release 6.08 for MicrosoftWindows (Cary, NC, USA). The main analyses were multiple linear regression modelling with two terms for each of the six trauma categories, one for trauma in the Pol Pot era and the other for trauma in the camp in the year before interview (1989-1990). In addition, all models included terms for age, years of education, marital status and gender. After the trauma categories were created, a principal components factor analysis (with varimax rotation) was conducted of the 28 trauma events. Five factors were identified. A grouping of the trauma events by their highest factor loadings (all loadings greater than 0.5) corresponded very closely to the a priori groupings and gave empirical support to their construct validity.
The main results analysing the relationship between the effects of the six categories of trauma events and psychiatric symptoms were based upon the symptom scores derived from the depression sub-scale of the HSCL-25 and DSM-IV. These results are reported as linear regression coefficients (slopes) representing the estimated change in symptom scores for an increase of one event in each category of trauma. The precision of these estimates is reflected by 95% confidence intervals. The estimates may be viewed as measurements of the ‘potency’ of each category of trauma on an event-by-event basis. Analyses were then conducted combining these point estimates with the frequency of reported trauma events, estimating the net effects of trauma events on psychiatric symptoms for each of the six trauma categories, and adjusting for group differences for each time period. Variables for age, education, marital status and gender were mean-centred.
RESULTS
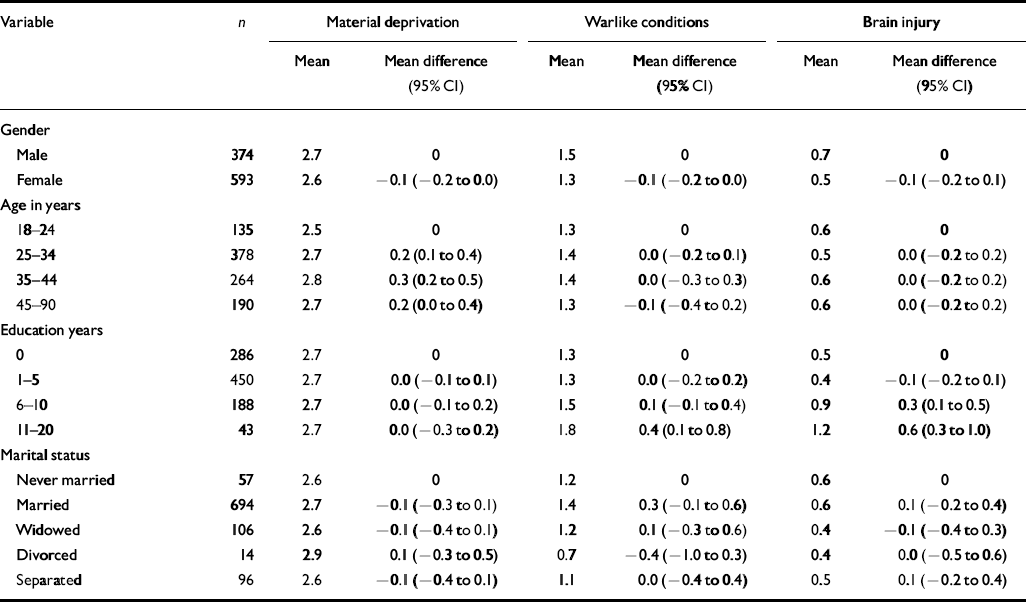
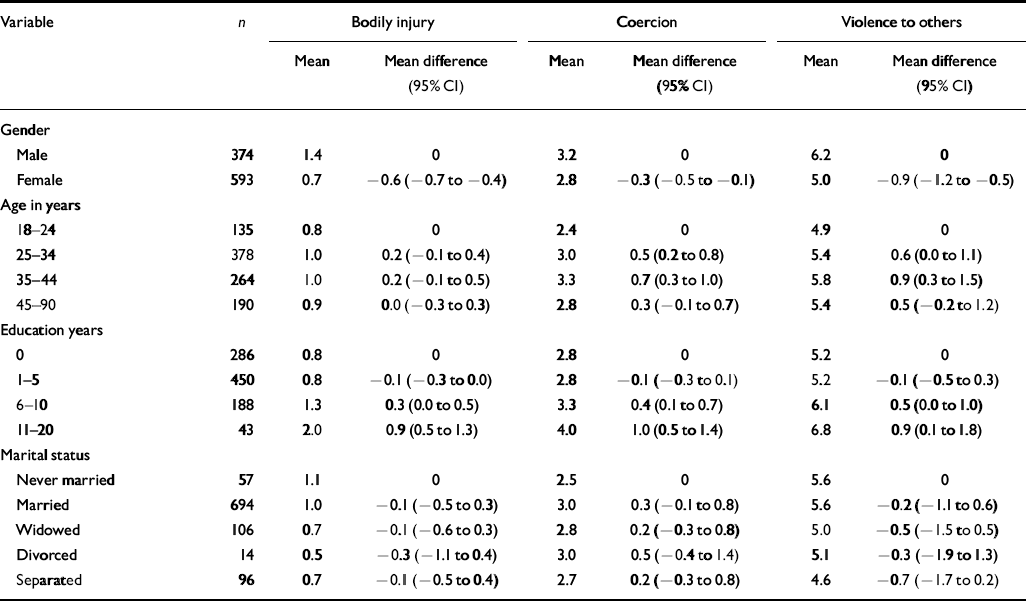
The analyses were based on 967 (97%) of the 993 participants, excluding 26 with unknown years of education. Tables 1 and 2 show the distribution of respondents by gender, age, education, marital status and the relationships with Pol Pot era trauma. The sample was approximately two-thirds female, primarily middle-aged adults, poorly educated, and predominantly married and living together with the spouse at the time of the interview. Trauma events from each of the six categories were evenly distributed by demography with a few significant increases in reported trauma by respondent sub-populations. Education was strongly associated with every kind of trauma except material deprivation, with the more highly educated persons experiencing higher levels of each category of trauma including traumatic brain injury. Males reported more bodily injury and violence to others; age was strongly related to coercion and violence to others, with the most frequent reports being made by persons who were 35-44 years old at the time of interview, and therefore 25-34 years old at the end of the Pol Pot era. Few, if any, appreciable associations were evident with marital status.
Table 1 Distribution and differences by gender, age, education and marital status of trauma from material deprivation, warlike conditions and brain injury in the Pol Pot era reported by 967 adult residents of Site 2, Thailand, 1990
| Variable | n | Material deprivation | Warlike conditions | Brain injury | |||
|---|---|---|---|---|---|---|---|
| Mean | Mean difference (95% CI) | Mean | Mean difference (95% CI) | Mean | Mean difference (95% CI) | ||
| Gender | |||||||
| Male | 374 | 2.7 | 0 | 1.5 | 0 | 0.7 | 0 |
| Female | 593 | 2.6 | -0.1 (-0.2 to 0.0) | 1.3 | -0.1 (-0.2 to 0.0) | 0.5 | -0.1 (-0.2 to 0.1) |
| Age in years | |||||||
| 18-24 | 135 | 2.5 | 0 | 1.3 | 0 | 0.6 | 0 |
| 25-34 | 378 | 2.7 | 0.2 (0.1 to 0.4) | 1.4 | 0.0 (-0.2 to 0.1) | 0.5 | 0.0 (-0.2 to 0.2) |
| 35-44 | 264 | 2.8 | 0.3 (0.2 to 0.5) | 1.4 | 0.0 (-0.3 to 0.3) | 0.6 | 0.0 (-0.2 to 0.2) |
| 45-90 | 190 | 2.7 | 0.2 (0.0 to 0.4) | 1.3 | -0.1 (-0.4 to 0.2) | 0.6 | 0.0 (-0.2 to 0.2) |
| Educations years | |||||||
| 0 | 286 | 2.7 | 0 | 1.3 | 0 | 0.5 | 0 |
| 1-5 | 450 | 2.7 | 0.0 (-0.1 to 0.1) | 1.3 | 0.0 (-0.2 to 0.2) | 0.4 | -0.1 (-0.2 to 0.1) |
| 6-10 | 188 | 2.7 | 0.0 (-0.1 to 0.2) | 1.5 | 0.1 (-0.1 to 0.4) | 0.9 | 0.3 (0.1 to 0.5) |
| 11-20 | 43 | 2.7 | 0.0 (-0.3 to 0.2) | 1.8 | 0.4 (0.1 to 0.8) | 1.2 | 0.6 (0.3 to 1.0) |
| Marital status | |||||||
| Never married | 57 | 2.6 | 0 | 1.2 | 0 | 0.6 | 0 |
| Married | 694 | 2.7 | -0.1 (-0.3 to 0.1) | 1.4 | 0.3 (-0.1 to 0.6) | 0.6 | 0.1 (-0.2 to 0.4) |
| Widowed | 106 | 2.6 | -0.1 (-0.4 to 0.1) | 1.2 | 0.1 (-0.3 to 0.6) | 0.4 | -0.1 (-0.4 to 0.3) |
| Divorced | 14 | 2.9 | 0.1 (-0.3 to 0.5) | 0.7 | -0.4 (-1.0 to 0.3) | 0.4 | 0.0 (-0.5 to 0.6) |
| Separated | 96 | 2.6 | -0.1 (-0.4 to 0.1) | 1.1 | 0.0 (-0.4 to 0.4) | 0.5 | 0.1 (-0.2 to 0.4) |
Table 2 Distribution and differences by gender, age, education and marital status of trauma from bodily injury, coercion and witnessing violence to others in the Pol Pot era reported by 967 adult residents of Site 2, Thailand, 1990
| Variable | n | Bodily injury | Coercion | Violence to others | |||
|---|---|---|---|---|---|---|---|
| Mean | Mean difference (95% CI) | Mean | Mean difference (95% CI) | Mean | Mean difference (95% CI) | ||
| Gender | |||||||
| Male | 374 | 1.4 | 0 | 3.2 | 0 | 6.2 | 0 |
| Female | 593 | 0.7 | -0.6 (-0.7 to -0.4) | 2.8 | -0.3 (-0.5 to -0.1) | 5.0 | -0.9 (-1.2 to -0.5) |
| Age in years | |||||||
| 18-24 | 135 | 0.8 | 0 | 2.4 | 0 | 4.9 | 0 |
| 25-34 | 378 | 1.0 | 0.2 (-0.1 to 0.4) | 3.0 | 0.5 (0.2 to 0.8) | 5.4 | 0.6 (0.0 to 1.1) |
| 35-44 | 264 | 1.0 | 0.2 (-0.1 to 0.5) | 3.3 | 0.7 (0.3 to 1.0) | 5.8 | 0.9 (0.3 to 1.5) |
| 45-90 | 190 | 0.9 | 0.0 (-0.3 to 0.3) | 2.8 | 0.3 (-0.1 to 0.7) | 5.4 | 0.5 (-0.2 to 1.2) |
| Education years | |||||||
| 0 | 286 | 0.8 | 0 | 2.8 | 0 | 5.2 | 0 |
| 1-5 | 450 | 0.8 | -0.1 (-0.3 to 0.0) | 2.8 | -0.1 (-0.3 to 0.1) | 5.2 | -0.1 (-0.5 to 0.3) |
| 6-10 | 188 | 1.3 | 0.3 (0.0 to 0.5) | 3.3 | 0.4 (0.1 to 0.7) | 6.1 | 0.5 (0.0 to 1.0) |
| 11-20 | 43 | 2.0 | 0.9 (0.5 to 1.3) | 4.0 | 1.0 (0.5 to 1.4) | 6.8 | 0.9 (0.1 to 1.8) |
| Marital status | |||||||
| Never married | 57 | 1.1 | 0 | 2.5 | 0 | 5.6 | 0 |
| Married | 694 | 1.0 | -0.1 (-0.5 to 0.3) | 3.0 | 0.3 (-0.1 to 0.8) | 5.6 | -0.2 (-1.1 to 0.6) |
| Widowed | 106 | 0.7 | -0.1 (-0.6 to 0.3) | 2.8 | 0.2 (-0.3 to 0.8) | 5.0 | -0.5 (-1.5 to 0.5) |
| Divorced | 14 | 0.5 | -0.3 (-1.1 to 0.4) | 3.0 | 0.5 (-0.4 to 1.4) | 5.1 | -0.3 (-1.9 to 1.3) |
| Separated | 96 | 0.7 | -0.1 (-0.5 to 0.4) | 2.7 | 0.2 (-0.3 to 0.8) | 4.6 | -0.7 (-1.7 to 0.2) |
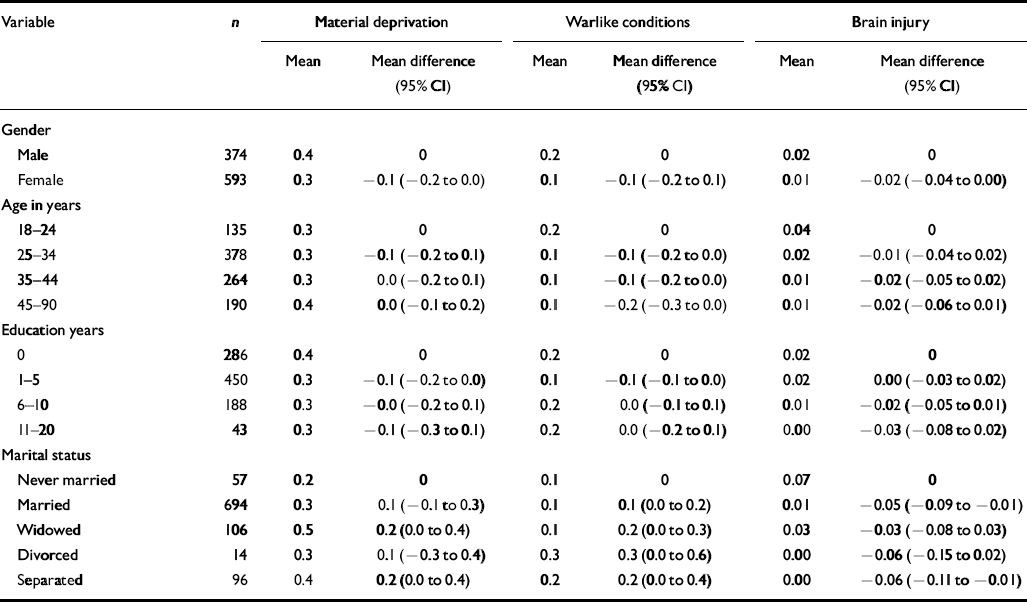
Tables 3 and 4 show the relationships between demographic characteristics and trauma in Site 2 during the year before interview. Each category of trauma events reveals a marked reduction in mean scores from the Pol Pot era trauma. Although there are some differences in the reporting of trauma events by demography, confidence intervals do not reveal significant differences within each trauma category, with the possible exception that respondents who had lost a spouse reported more material deprivation and warlike conditions. Traumatic brain injury events during this time period were not significantly different by demography although persons who had never been married reported less brain injury than did persons of any other marital status.
Table 3 Distribution and differences by gender, age, education and marital status of trauma from material deprivation, warlike conditions and brain injury in Site 2 during the year prior to interview reported by 967 adult residents of Site 2, Thailand, 1990
| Variable | n | Material deprivation | Warlike conditions | Brain injury | |||
|---|---|---|---|---|---|---|---|
| Mean | Mean difference | Mean | Mean difference | Mean | Mean difference | ||
| (95% CI) | (95% CI) | (95% CI) | |||||
| Gender | |||||||
| Male | 374 | 0.4 | 0 | 0.2 | 0 | 0.02 | 0 |
| Female | 593 | 0.3 | -0.1 (-0.2 to 0.0) | 0.1 | -0.1 (-0.2 to 0.1) | 0.01 | -0.02 (-0.04 to 0.00) |
| Age in years | |||||||
| 18-24 | 135 | 0.3 | 0 | 0.2 | 0 | 0.04 | 0 |
| 25-34 | 378 | 0.3 | -0.1 (-0.2 to 0.1) | 0.1 | -0.1 (-0.2 to 0.0) | 0.02 | -0.01 (-0.04 to 0.02) |
| 35-44 | 264 | 0.3 | 0.0 (-0.2 to 0.1) | 0.1 | -0.1 (-0.2 to 0.0) | 0.01 | -0.02 (-0.05 to 0.02) |
| 45-90 | 190 | 0.4 | 0.0 (-0.1 to 0.2) | 0.1 | -0.2 (-0.3 to 0.0) | 0.01 | -0.02 (-0.06 to 0.01) |
| Education years | |||||||
| 0 | 286 | 0.4 | 0 | 0.2 | 0 | 0.02 | 0 |
| 1-5 | 450 | 0.3 | -0.1 (-0.2 to 0.0) | 0.1 | -0.1 (-0.1 to 0.0) | 0.02 | 0.00 (-0.03 to 0.02) |
| 6-10 | 188 | 0.3 | -0.0 (-0.2 to 0.1) | 0.2 | 0.0 (-0.1 to 0.1) | 0.01 | -0.02 (-0.05 to 0.01) |
| 11-20 | 43 | 0.3 | -0.1 (-0.3 to 0.1) | 0.2 | 0.0 (-0.2 to 0.1) | 0.00 | -0.03 (-0.08 to 0.02) |
| Marital status | |||||||
| Never married | 57 | 0.2 | 0 | 0.1 | 0 | 0.07 | 0 |
| Married | 694 | 0.3 | 0.1 (-0.1 to 0.3) | 0.1 | 0.1 (0.0 to 0.2) | 0.01 | -0.05 (-0.09 to -0.01) |
| Widowed | 106 | 0.5 | 0.2 (0.0 to 0.4) | 0.1 | 0.2 (0.0 to 0.3) | 0.03 | -0.03 (-0.08 to 0.03) |
| Divorced | 14 | 0.3 | 0.1 (-0.3 to 0.4) | 0.3 | 0.3 (0.0 to 0.6) | 0.00 | -0.06 (-0.15 to 0.02) |
| Separated | 96 | 0.4 | 0.2 (0.0 to 0.4) | 0.2 | 0.2 (0.0 to 0.4) | 0.00 | -0.06 (-0.11 to -0.01) |
Table 4 Distribution and differences by gender, age, education and marital status of trauma from bodily injury, coercion and witnessing violence to others in Site 2 during the year prior to interview reported by 967 adult residents of Site 2, Thailand, 1990

| Variable | n | Bodily injury | Coercion | Violence to others | |||
|---|---|---|---|---|---|---|---|
| Mean | Mean difference | Mean | Mean difference | Mean | Mean difference | ||
| (95% CI) | (95% CI) | (95% CI) | |||||
| Gender | |||||||
| Male | 374 | 0.07 | 0 | 0.2 | 0 | 0.7 | 0 |
| Female | 593 | 0.04 | -0.04 (-0.09 to 0.00) | 0.1 | -0.1 (-0.1 to 0.0) | 0.5 | -0.2 (-0.3 to 0.0) |
| Age in years | |||||||
| 18-24 | 135 | 0.07 | 0 | 0.2 | 0 | 1.0 | 0 |
| 25-34 | 378 | 0.05 | -0.01 (-0.06 to 0.04) | 0.1 | -0.1 (-0.1 to 0.0) | 0.5 | -0.5 (-0.7 to -0.2) |
| 35-44 | 264 | 0.06 | -0.01 (-0.08 to 0.06) | 0.2 | 0.0 (-0.1 to 0.1) | 0.5 | -0.4 (-0.7 to -0.2) |
| 45-90 | 190 | 0.04 | -0.04 (-0.12 to 0.03) | 0.1 | -0.1 (-0.2 to 0.0) | 0.7 | -0.4 (-0.7 to -0.1) |
| Education years | |||||||
| 0 | 286 | 0.03 | 0 | 0.1 | 0 | 0.6 | 0 |
| 1-5 | 450 | 0.05 | 0.01 (-0.03 to 0.06) | 0.1 | 0.0 (0.0 to 0.1) | 0.6 | 0.0 (-0.2 to 0.1) |
| 6-10 | 188 | 0.08 | 0.03 (-0.02 to 0.09) | 0.1 | 0.0 (-0.1 to 0.1) | 0.7 | 0.1 (-0.1 to 0.3) |
| 11-20 | 43 | 0.12 | 0.08 (-0.02 to 0.18) | 0.3 | 0.2 (0.1 to 0.4) | 0.7 | 0.1 (-0.3 to 0.5) |
| Marital status | |||||||
| Never married | 57 | 0.11 | 0 | 0.2 | 0 | 1.0 | 0 |
| Married | 694 | 0.04 | -0.04 (-0.13 to 0.05) | 0.1 | 0.0 (-0.2 to 0.1) | 0.6 | -0.1 (-0.5 to 0.2) |
| Widowed | 106 | 0.10 | 0.06 (-0.05 to 0.17) | 0.1 | 0.0 (-0.1 to 0.2) | 0.7 | 0.1 (-0.3 to 0.5) |
| Divorced | 14 | 0.07 | 0.01 (-0.16 to 0.19) | 0.2 | 0.1 (-0.2 to 0.3) | 0.3 | -0.4 (-1.1 to 0.3) |
| Separated | 96 | 0.09 | 0.03 (-0.07 to 0.14) | 0.2 | 0.0 (-0.1 to 0.2) | 0.6 | -0.1 (-0.5 to 0.3) |
Examining the relationship between cumulative trauma during the Pol Pot era and the relative frequency of each of the specific trauma categories, it is apparent that the different kinds of trauma were not uniformly distributed throughout the range of cumulative trauma. At low levels of cumulative trauma, traumatic brain injury events and bodily injury were relatively uncommon, while material deprivation, coercion and warlike conditions tended to predominate. At the highest levels of cumulative trauma, the proportional frequency of material deprivation was greatly reduced; coercive trauma remained relatively high and traumatic brain injury and bodily injury rose to prominence. Thus, brain and bodily injury were disproportionately common among persons who experienced large numbers of trauma events overall.
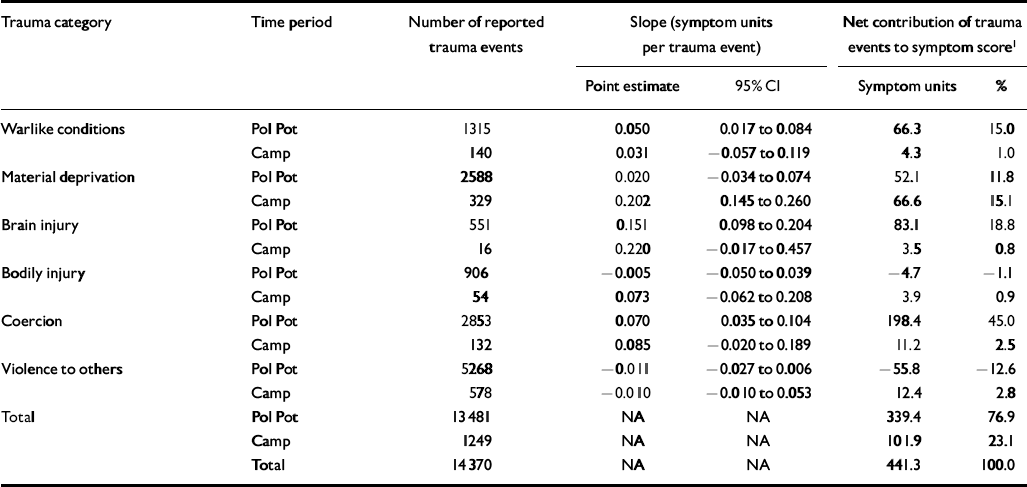
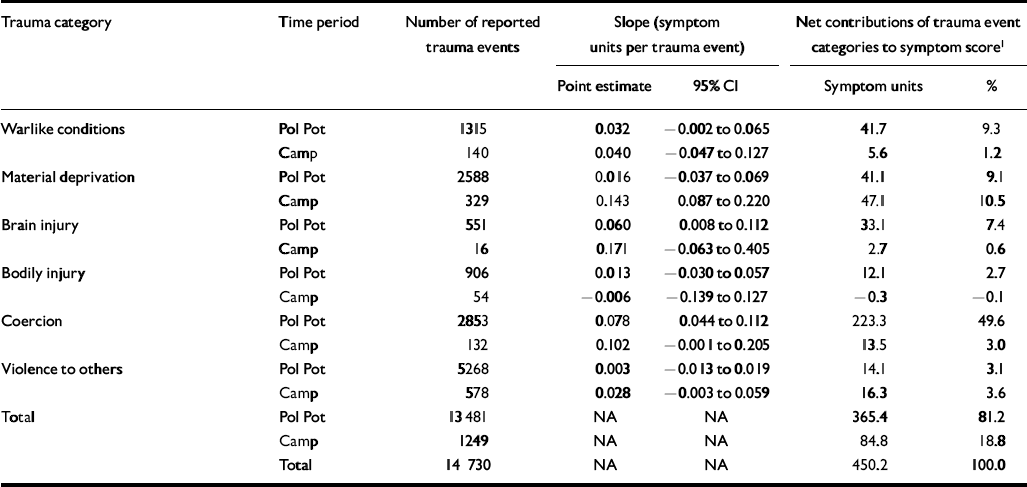
The point estimate or relative ‘potency’ for the different categories of trauma are shown in Table 5 for depressive symptoms and in Table 6 for the criterion symptoms of PTSD. The point estimates are much more precise for the more frequent trauma in the Pol Pot era than during the year before the interview, as reflected in the relative widths of the confidence intervals. The relationships between categories of trauma and symptoms of depression and PTSD are graphically illustrated in Figs 1a and 2a and 1b and 2b, respectively. For depressive symptoms, consistently strong associations with traumatic brain injury are apparent in both time periods. Depressive symptoms are also strongly associated with material deprivation in the year before the interview. For PTSD symptoms, the association with trauma categories is weaker. The strongest associations with this measure of symptomatology are between traumatic brain injury and coercion in both time periods (Figs 2a and b) and with material deprivation in the camp in the year before interview (Fig. 2b).
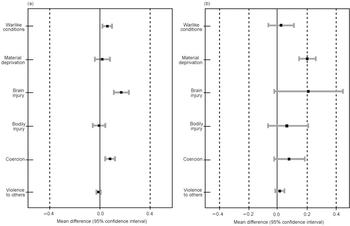
Fig. 1 Depressive symptoms in relation to categories of trauma (a) during the Pol Pot era, and (b) in Site 2 during the year before interview, reported by 967 adult residents of Site 2, Thailand, 1990. The mean differences are linear regression estimates of the effect of an increment of one additional event in each trauma category, controlling for gender, age, education, marital status and trauma (a) in Site 2 during the year before interview, and (b) during the Pol Pot era.
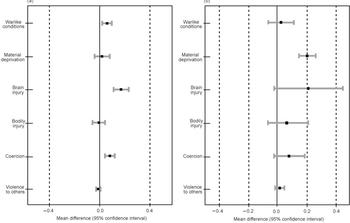
Fig. 2 Six criterion symptoms of post-traumatic stress disorder in relation to categories of trauma (a) during the Pol Pot era, and (b) in Site 2 during the year before interview, reported by 967 adult residents of Site 2, Thailand, 1990. The mean differences are linear regression estimates of the effect of an increment of one additional event in each trauma category, controlling for gender, age, education, marital status and trauma (a) in Site 2 during the year before interview, and (b) during the Pol Pot era.
Table 5 Absolute and proportional contributions of trauma categories to the total depressive symptom score among 967 adult residents of Site 2, Thailand, 1990
| Trauma category | Time period | Number of reported trauma events | Slope (symptom units per trauma event) | Net contribution of trauma events to symptom score1 | ||
|---|---|---|---|---|---|---|
| Point estimate | 95% CI | Symptom units | % | |||
| Warlike conditions | Pol Pot | 1315 | 0.050 | 0.017 to 0.084 | 66.3 | 15.0 |
| Camp | 140 | 0.031 | -0.057 to 0.119 | 4.3 | 1.0 | |
| Material deprivation | Pol Pot | 2588 | 0.020 | -0.034 to 0.074 | 52.1 | 11.8 |
| Camp | 329 | 0.202 | 0.145 to 0.260 | 66.6 | 15.1 | |
| Brain injury | Pol Pot | 551 | 0.151 | 0.098 to 0.204 | 83.1 | 18.8 |
| Camp | 16 | 0.220 | -0.017 to 0.457 | 3.5 | 0.8 | |
| Bodily injury | Pol Pot | 906 | -0.005 | -0.050 to 0.039 | -4.7 | -1.1 |
| Camp | 54 | 0.073 | -0.062 to 0.208 | 3.9 | 0.9 | |
| Coercion | Pol Pot | 2853 | 0.070 | 0.035 to 0.104 | 198.4 | 45.0 |
| Camp | 132 | 0.085 | -0.020 to 0.189 | 11.2 | 2.5 | |
| Violence to others | Pol Pot | 5268 | -0.011 | -0.027 to 0.006 | -55.8 | -12.6 |
| Camp | 578 | -0.010 | -0.010 to 0.053 | 12.4 | 2.8 | |
| Total | Pol Pot | 13481 | NA | NA | 339.4 | 76.9 |
| Camp | 1249 | NA | NA | 101.9 | 23.1 | |
| Total | 14370 | NA | NA | 441.3 | 100.0 | |
Table 6 Absolute and proportional contributions of trauma event categories to the total post-traumatic stress disorder symptom score among 967 adult residents of Site 2, Thailand, 1990
| Trauma category | Time period | Number of reported trauma events | Slope (symptom units per trauma event) | Net contributions of trauma event categories to symptom score1 | ||
|---|---|---|---|---|---|---|
| Point estimate | 95% CI | Symptom units | % | |||
| Warlike conditions | Pol Pot | 1315 | 0.032 | -0.002 to 0.065 | 41.7 | 9.3 |
| Camp | 140 | 0.040 | -0.047 to 0.127 | 5.6 | 1.2 | |
| Material deprivation | Pol Pot | 2588 | 0.016 | -0.037 to 0.069 | 41.1 | 9.1 |
| Camp | 329 | 0.143 | 0.087 to 0.220 | 47.1 | 10.5 | |
| Brain injury | Pol Pot | 551 | 0.060 | 0.008 to 0.112 | 33.1 | 7.4 |
| Camp | 16 | 0.171 | -0.063 to 0.405 | 2.7 | 0.6 | |
| Bodily injury | Pol Pot | 906 | 0.013 | -0.030 to 0.057 | 12.1 | 2.7 |
| Camp | 54 | -0.006 | -0.139 to 0.127 | -0.3 | -0.1 | |
| Coercion | Pol Pot | 2853 | 0.078 | 0.044 to 0.112 | 223.3 | 49.6 |
| Camp | 132 | 0.102 | -0.001 to 0.205 | 13.5 | 3.0 | |
| Violence to others | Pol Pot | 5268 | 0.003 | -0.013 to 0.019 | 14.1 | 3.1 |
| Camp | 578 | 0.028 | -0.003 to 0.059 | 16.3 | 3.6 | |
| Total | Pol Pot | 13481 | NA | NA | 365.4 | 81.2 |
| Camp | 1249 | NA | NA | 84.8 | 18.8 | |
| Total | 14 730 | NA | NA | 450.2 | 100.0 | |
Almost 15 000 separate trauma events were reported in the two time periods (Tables 5 and 6); over 90% (13 481/14 730=92.5%) of these events were experienced in the Pol Pot era. As Tables 5 and 6 show, the frequency of the different categories of trauma during each of the time periods when combined with their estimated potencies (point estimates) and adjusted for group differences reveals the net contribution of each trauma category to the total symptom scores of depression and PTSD. For both measures, approximately 450 symptom units were the net contribution of all trauma events to the estimated baseline symptom score that would have been present in the hypothetical absence of trauma. For depressive symptoms (Table 5), coercive trauma during the Pol Pot era (n=2853 events) had the greatest effect, contributing 198.4 symptom units or 45% of the total. In contrast, traumatic brain injury events, although six times less frequent than coercion during the Pol Pot era (n=551 events), contributed 83.1 symptom units or almost 20% of the total symptom score for depression. For PTSD symptoms, coercive events during the Pol Pot era again had the greatest effect, contributing 223.3 symptom units or almost 50% of the total; traumatic brain injury events contributed 33.1 symptom units or 7.4%. Similar patterns exist for PTSD and depression for the refugee camp period, reflecting a smaller net contribution of brain injury to the symptoms of PTSD and depression because there were only 16 brain injury events.
DISCUSSION
Our data support the conclusion that traumatic brain injury events as reported by our Cambodian respondents were relatively common experiences in this population, especially for educated persons, who had an average of one traumatic brain injury event each. In addition, of all six trauma categories, traumatic brain injury events revealed the strongest associations with depression and PTSD, with the one exception that coercive events were slightly more potent than traumatic brain injury events for PTSD. These results are remarkable since traumatic brain injury in refugee populations is not routinely recognised as a public health hazard.
The Cambodian respondents in our survey reported numerous episodes of head trauma severe enough to be associated with underlying brain injury by a number of described mechanisms (Reference CourvilleCourville, 1937; Reference Ommaya and GennarelliOmmaya & Gennarelli, 1974; Reference Kwentus, Hart and PeckKwentus et al, 1985; Reference MesulamMesulam, 1986). Our results suggest that traumatic brain injury events can lead to considerable psychiatric sequelae up to 10 years after the events have occurred. It is our hypothesis that the psychiatric effects from traumatic brain injury events described in traditional populations will be at least as severe in refugees, because of their compromised physical and mental status (Reference Mollica and JalbertMollica & Jalbert, 1989; Reference ReynellReynell, 1989). Because of the latter, refugee survivors of traumatic brain injury events might be especially vulnerable to psychiatric disorders. For example, a mild head injury event which had occurred during the Pol Pot era might lead to symptoms of depression (Reference Robinson and SzetelaRobinson & Szetela, 1981). Depressive symptoms and neurocognitive deficits might diminish the refugees' ability to cope with their new social realities, such as refugee camp life in Site 2. Investigations of neurocognitive changes and accompanying psychiatric symptoms in traditional traumatic brain injury research have shown that the psychiatric effects of traumatic brain injury only worsen with poor social performance and limited social supports (Reference Jennett and TeasdaleJennett & Teasdale, 1981; Dikmen et al, Reference Dikmen, Reitan and Temkin1983, Reference Dikmen, McLean and Temkin1986, Reference Dikmen, Temkin and Machamer1994, Reference Dikmen, Machamer and Winn1995, Reference Dikmen, Machamer, Savoie, Grant and Adams1996). This process may be of special concern in refugee populations where there is no recognition of the refugees' underlying traumatic brain injury events.
Our findings are consistent with recent work suggesting that the self-report of head injury is a risk factor for depression and the severity of depression in combat-exposed veterans (Reference Vasterling, Constans and Hanna-PladdyVasterling et al, 2000). The effect of head injury appeared also to be associated with PTSD but to a lesser degree; head injury predicted depression but not PTSD severity.
Limitations
A number of major limitations affect the validity of our hypothesis-building and interpretation of study results. The traumatic brain injury events in this study are based upon self-reports; the number of individual traumatic brain injury events and estimates of the severity of possible injury, were not obtained. Information regarding post-concussive states and objective evidence, such as neuroimaging and neuropsychological testing, of the traumatic brain injury experiences were not obtained. Torturers and perpetrators of mass violence rarely leave records of their actions that can be compared with respondents' reports. The general issues relating to the accuracy of these reports of trauma events have been presented in two major reviews (Reference Mollica and Caspi-YavinMollica & Caspi-Yavin, 1991; Reference WillisWillis, 1998). However, considerable attention was directed in this study to determining the accuracy of respondents' self-reports of trauma (Mollica et al, Reference Mollica, Donelan and Tor1993, Reference Mollica, Poole, Tor and Dohrenwend1998a , Reference Mollica, McInnes and Poole b ).
The relationship between traumatic brain injury events and specific neuropsychiatric sequelae was not established in this study. Neuropsychiatric assessments of each respondent might have revealed the neurocognitive deficits associated with traumatic brain injury events; the latter would have also helped establish the accuracy of self-reporting of traumatic brain injury events. The danger of interviewing the residents of Site 2 (which was in a war zone) as well as the limited applicability of culture-fair neuropsychological tests (with none currently validated for Cambodian populations) prevented an adequate assessment of potential traumatic brain injury effects (Reference Manuel-Dupont, Ardila, Rosselli, Puente and McCaffreyManuel-Dupont et al, 1992). Finally, the relationships between social support and the resiliency to head injury need to be further evaluated and established (Reference Mollica, Cui and McInnesMollica et al, 2002).
Future studies
Future prospective studies which begin closer to the initial period of victimisation will also help disentangle the relationship between traumatic brain injury events and traumatic brain injury effects (psychiatric symptoms and neurocognitive deficits) and their impact on social performance over time.
Culturally validated methods for the clinical evaluation of traumatic brain injury in survivors of mass violence have not been clarified. Approaches for disentangling the complicated clinical symptomatology of comorbid post-concussive syndrome, depression and PTSD have not been adequately researched. Further studies are needed to clarify the relative impact of traumatic brain injury and psychiatric, social and economic disability. It is possible that survivors of mass violence with traumatic brain injuries are the most chronically disabled psychiatric patients and the most difficult to treat.
Traumatic brain injury, depression and PTSD
Early identification of depression and PTSD together with possible traumatic brain injury is very important in the assessment of torture survivors and highly traumatised populations. Traumatic brain injury has potent effects and has an impact on neuro-psychological deficits and the course of illness, and may be associated with or even masked by depression (Reference Weinstein, Fucetola and MollicaWeinstein et al, 2001). If a traumatic brain injury is found, a neurocognitive evaluation (neurological examination, neuropsychological testing and neuroimaging studies) must be performed to determine the extent of the deficits. In a refugee camp, where neuropsychological testing is rarely available, an assessment of social and physiological functioning is important.
The psychological horror of mass violence combined with the physical damage of traumatic brain injury may have long-term negative medical and psychiatric effects on many survivors. These effects, however, can be ameliorated if there is proper recognition of their causes and consequences.
CLINICAL IMPLICATIONS
-
▪ Refugee survivors may have experienced traumatic brain injuries.
-
▪ Traumatic brain injury is strongly associated with symptoms of depression, and less so with symptoms of post-traumatic stress disorder (PTSD).
-
▪ Clinicians must always consider traumatic brain injury in refugee survivors with depression and PTSD, as psychiatric comorbidity may be masking an underlying head injury which, once identified, will call for a different approach and rehabilitation.
LIMITATIONS
-
▪ This was a retrospective examination of traumatic life experiences and no objective measures (magnetic resonance imaging, neuropsychological testing) were available to cross-validate reports of trauma.
-
▪ As this study was conducted several years after the mass violence, a cause-and-effect relationship could not be established between the violence and depression, PTSD and brain injury.
-
▪ The relationship of previous post-concussive states to current psychiatric comorbidity was not determined.
Acknowledgements
We thank the Ford Foundation, Pew Charitable Trust and an anonymous donor for their support in this project. We also acknowledge the following contributors to this study: Dr Douglas Bennett, Maudsley Hospital, London, UK; Dr Robert Blendon, Harvard School of Public Health, Boston, MA, USA; Dr Kirk Daffner, Behavioral Neurology, Brigham and Women's Hospital, Boston, MA, USA; Dr Karen Donelan, Harvard School of Public Health, Boston, MA, USA; James Lavelle, Harvard Program in Refugee Trauma, Cambridge, MA, USA; Dr Charles Poole, Department of Epidemiology and Statistics, Boston University School of Public Health, Boston, MA, USA; and Savuth Sath, Harvard Program in Refugee Trauma, Cambridge, MA, USA.


eLetters
No eLetters have been published for this article.