Introduction
A population's size, structure and ability to grow are key determinants of its extinction risk and conservation status. Because of this, long-term demographic studies provide essential information for development of conservation and management strategies (Caughley, Reference Caughley1977; Gaillard et al., Reference Gaillard, Festa-Bianchet and Yoccoz1998). Studies of individually identified animals are particularly important because individual identification ensures that the relationships between growth due to intrinsic (births and deaths) and extrinsic (immigration and emigration) sources are unambiguous. Such detailed studies are rare but are crucial for understanding the dynamics of long-lived vertebrates such as the African elephant Loxodonta africana. For such species, conservation management has to be carefully planned to have maximum effect with minimum disruption and hence depends on a thorough understanding of the relationships between demography and social structure.
Currently, some populations of African elephants are growing robustly but facing threats from habitat loss, high density and human–elephant conflict, while others are declining because of heavy poaching (Blanc et al., Reference Blanc, Barnes, Craig, Dublin, Thouless, Douglas-Hamilton and Hart2007). Recently published long-term studies of individually identified elephant populations, including a free-ranging population in Amboseli National Park, Kenya, which has not been poached (Moss, Reference Moss2001), and a fenced population in Addo National Park, South Africa (Whitehouse & Hall-Martin, Reference Whitehouse and Hall-Martin2000; Gough & Kerley, Reference Gough and Kerley2006), have demonstrated some of the flexibility in elephant demography under varying environmental conditions, population densities and population histories. Additional detailed studies can improve our understanding of elephant population dynamics, including fluctuations over time, variation between populations, and recovery potential following social disruptions such as poaching.
Here we present an analysis of the dynamics of an individually recognized elephant population in Tarangire National Park, Tanzania. Unchecked poaching outside the Park during the 1970s and early 1980s (Ecosystems Ltd, 1980) caused elephants to take refuge in Tarangire (Foley, Reference Foley2002), increasing the Park's elephant population from 440 in 1960 (Lamprey, Reference Lamprey1963) to c. 2,385 in 2000 (TWCM, 2000). Poaching heavily affected the population's structure by removing the majority of bulls over 30 years of age and females over 40, creating a young, strongly female-biased structure (Foley, Reference Foley2002). Previous research has illustrated strong long-term impacts on breeding in heavily poached populations (Poole, Reference Poole1989; Gobush et al., Reference Gobush, Mutayoba and Wasser2008). The Tarangire population therefore represents an opportunity to use detailed demographic data to assess the recovery ability of an elephant population after intense poaching. Specifically, our objectives were to (1) describe the population's size, structure and growth over the study period, (2) test the impact of rainfall and density on population growth, survival and reproduction, and (3) describe the demographic impacts of the population's poaching history.
Study area
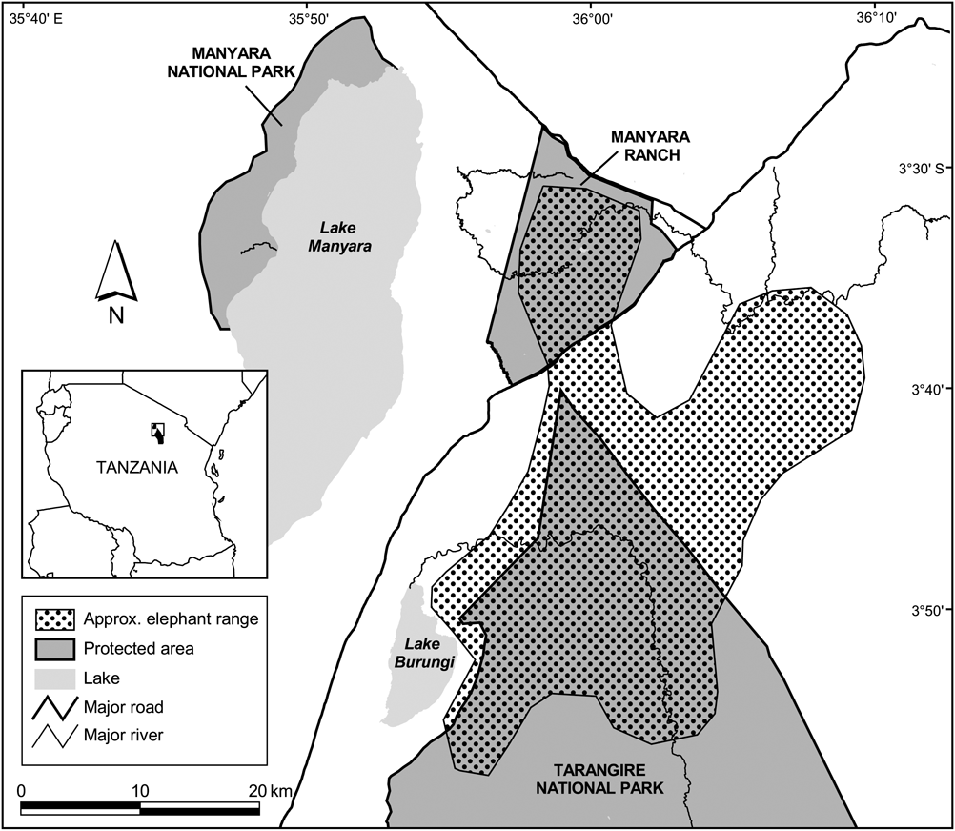
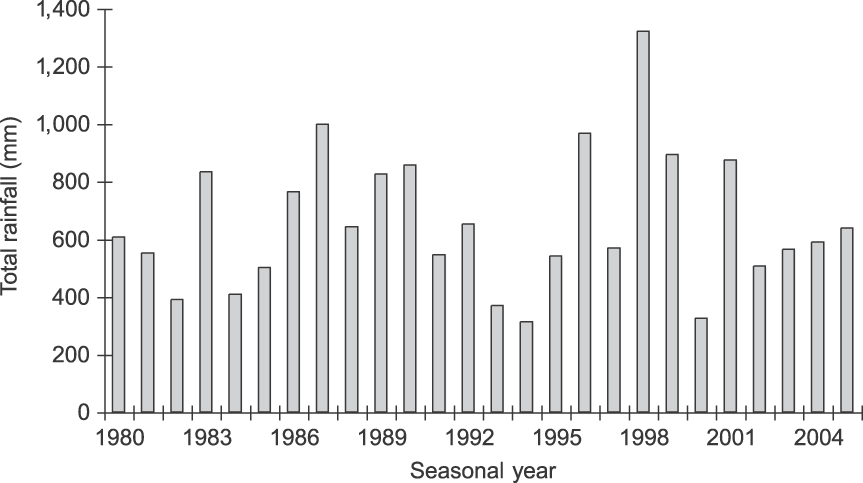
Tarangire National Park in north-eastern Tanzania (Fig. 1) is dominated by microphyll-wooded savannah. The Park protects 2,600 km2 of the larger 20,000-km2 ecosystem, and the Tarangire River within the Park provides one of the ecosystem's only dry-season water sources (Borner, Reference Borner1985). During the wet season the majority of large ungulates, including elephants, migrate to dispersal areas outside the Park, returning when ephemeral water in these areas disappears. Rainfall is variable, with a mean total annual rainfall of 656 mm (coefficient of variation = 36.4%, range 312.5–1,322.0, n = 26 years; Fig. 2). Rain occurs almost exclusively in November–January and March–May. All temporal analyses used seasonal year starting with the onset of the rains (1 November); e.g. 1980 refers to 1 November 1979 to 31 October 1980.

Fig. 1 The study site and the approximate home range of the northern subpopulation of elephants Loxodonta africana in Tarangire National Park. Shaded rectangle on the inset indicates the location of the main map in Tanzania.

Fig. 2 Total annual rainfall (mm) in Tarangire National Park (Fig. 1) during 1980–2004. Seasonal years are from 1 November to 31 October (e.g. 1980 is 1 November 1979 to 31 October 1980; see text for further details).
Methods
Data collection
At the last full census Tarangire National Park had an estimated total population of 2,385 elephants (TWCM, 2000). This includes three subpopulations; each is a distinct set of family groups that share wet-season ranges (Foley, Reference Foley2002). The focus of this study was 27 family groups (adult females and dependent offspring) of the northern subpopulation, which are resident in the Park for most of the year and have been continuously monitored since 1993. Family groups are defined as individuals that were seen together > 70% of the time (Archie et al., Reference Archie, Morrison, Foley, Moss and Alberts2006).
Data presented here were gathered between 1 November 1993 and 31 October 2005 by CAHF. Eighteen of the 27 family groups were identified by November 1993 and the rest by November 1994; because of this, analyses including 1993 data were adjusted appropriately to reflect only individuals known at the time. Starting in 1993, family groups were sighted a minimum of every 2 months and, during the most intense years of monitoring, 2–3 times per month.
Adult females were individually identified using unique ear features (notches and vein patterns), tusk characteristics and other morphological features (Douglas-Hamilton, Reference Douglas-Hamilton1972). Younger females and calves were also identified by association with known adult females. Males were monitored until they dispersed from their family group, usually at 7–9 years of age in this population. For simplification, analyses using male data were based only on males younger than 8 years.
Ages were estimated by CAHF using standards developed for the Amboseli Elephant Research Project (Moss, Reference Moss2001), with many initial estimates validated by Moss. For individuals born before 1989 (5 years or older in 1993) birth date could be estimated to within a 5-year interval (e.g. in 1993 a female could be estimated as 20–25 years old, and birth date was assigned as 1 July 1970 ± 2.5 years). For individuals born from 1989 to 1993, birth date was estimated to within a single year (1 July ± 6 months). For the 441 individuals born after 1993 birth date was generally known to a specific month (81%) or to the midpoint of multiple months (92% have estimated intervals of ≤ 3 months). Where relevant, conception date was calculated based on an assumed gestation length of 22 months subtracted from the birth date (Moss, Reference Moss2001).
Establishing an accurate date of death is challenging because deaths were rarely observed. Death was assumed (1) for a dependent calf if its mother was seen without it a minimum of three times or over a 6-month period, (2) for an adult female if her calf(s) were seen a minimum of three times with their family group without her, and (3) for a female and her dependent calf(s) if they were missing from a family group over a 6-month period and were not seen alone in other areas of the Park. Except for individuals that were seen to be ill or carcasses identified shortly after death, the death-date estimate interval was calculated based on the individual's last sighting and the first date the family group was seen without the individual, with the death date as the midpoint.
As of 31 October 2005 there were 668 individuals in the data set (254 males, 405 females and nine of unknown sex), including 75 dead individuals, 95 males older than 8 years that were no longer closely monitored, and 498 living individuals that were consistently monitored. Parentage (mother–offspring) assignment could be made for 81% of the individuals (n = 543) in the data set based on nursing behaviour, association patterns and social behaviour.
Demographic and statistical analysis
Average annual population growth rate over the study was determined by linear regression of the natural logarithm of the annual number of females Nt (Sibly & Hone, Reference Sibly and Hone2002). Estimates of annual growth rate from year to year were calculated as r = ln(Nt +1/Nt), and percentage population growth = (er−1)100. To test for density dependence in growth ln(Nt +1/Nt) was regressed against Nt, and to test for time lags in density dependence, ln(Nt +1/Nt) was regressed against Nt −1 and Nt −2 (Sibly & Hone, Reference Sibly and Hone2002).
Logistic regression was used to assess the impact of total rainfall and density in the conception year on a female's probability of conceiving. This analysis was limited to females eligible for conception, defined as females older than 8 years and not currently pregnant; 8 years is the youngest recorded age of a female reaching parturition (Moss, Reference Moss2001; Foley, Reference Foley2002). Linear regression was used to analyse the impact of density and average monthly rainfall during the interbirth interval (calculated as interval between the estimated birth dates of a female's two consecutive calves), with interbirth interval assigned to the second calf's conception year. Analyses were limited to intervals in which both calves had a birth date estimated to ≤ 1 month (n = 196). Both regression analyses used standardized independent variables to allow comparison between different scales. Kaplan–Meier product-limit analysis was used to analyse female's age at first birth (Klein & Moeschberger, Reference Klein and Moeschberger1997). This analysis was limited to females that were definitely nulliparous (< 3 years old in 1993 or born subsequently) that turned 8 years between 1993 and 2005 (n = 77 females). All had estimated birth date intervals ± 6 months or less.
For survival data Kaplan–Meier analysis was used to estimate female survivorship across the lifespan and male survivorship to age 8; a log-rank test was used to compare survivorship until age 8 between the sexes (Klein & Moeschberger, Reference Klein and Moeschberger1997). Mortality rates (number of deaths/number of individuals at risk of death) were calculated for females older than 8 years and calves younger than 8 years during each seasonal year (Caughley, Reference Caughley1977). Calf mortality rates were pooled for both sexes, based on the lack of difference between the sexes using the log-rank test (see Results). A one-tailed t-test was used to test for differences between average annual mortality of calves and adults, based on the null hypothesis that mortality of young is typically higher than that of adults. Logistic regression was used to assess the impact of total rainfall and density in the year of death on the probability of surviving for calves and adults; independent variables were standardized as described above.
Results
Population growth and density dependence
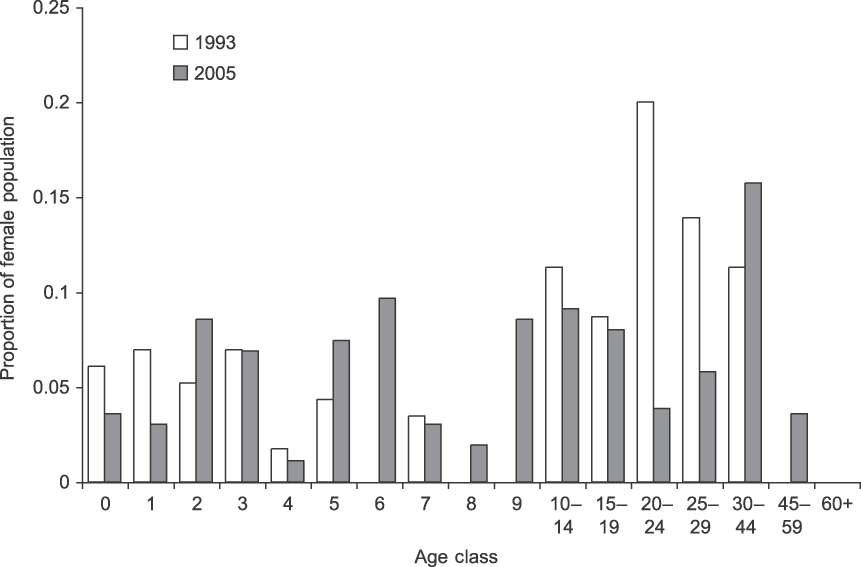
The population of females and dependent calves grew steadily from 226 individuals in 1993 to 498 individuals in 2005 (Table 1). The average annual population growth rate (r) over the period was 0.0684 (95% confidence interval 0.062–0.075) or 7.1% on average (range 2.0–16.9%). The population's age and sex structure changed (Fig. 3), with the number of calves (< 8 years) per adult female increasing from 0.97 to 1.43. The 27 family groups increased in mean size from 8.4 (SD = 3.6, range 3–16) to 18.3 (SD = 7.9, range 6–37) individuals. There was no evidence for direct or time-lagged effects of density on growth (Nt: R 2 = 0.088, P = 0.375; Nt −1: R 2 = 0.158, P = 0.255; Nt −2: R 2 = 0.004, P = 0.872).

Fig. 3 Starting and final female population structure of the northern subpopulation of elephants in Tarangire National Park (Fig. 1). In 1993 there were 156 females and in 2005 there were 364 females.
Table 1 Final annual population sizes, births, deaths, calf and adult mortality rates and rainfall for the focal subpopulation in Tarangire National Park (Fig. 1) for 1994–2005. Seasonal years are from 1 November to 31 October (see text for further details).

Reproductive data
Over the 13 years 441 births (206 males, 230 females and five of unknown sex) were recorded. Sex ratio at birth was not significantly different from parity (χ 2 = 1.12, df = 2, P = 0.291). Peaks in total births occurred at 3- to 4-year intervals (Table 1). Reproduction varied seasonally, with conceptions positively synchronized with peaks in rainfall (Fig. 4). Probability of conceiving was significantly positively affected by rainfall and an interaction term (rainfall × females; χ 2 = 70.99, df = 3, P < 0.001; Table 2). The mean interbirth interval was 3.3 years (SD = 0.7, median = 3.1, range 1.8–5.8). There was no relationship between rainfall, density and interbirth interval (F 3,190 = 1.603, P < 0.200, R 2 = 0.024). Median age at first birth was 11.1 years (mean = 11.2, range 8.7–13.3). Twenty-five percent of females had given birth by age 10 and 75% by 12.2 years.

Fig. 4 Monthly total number of conceptions across months, based on estimated conception dates for 367 births with birth date estimates of ≤ 1 month, and mean monthly rainfall, in Tarangire National Park (Fig. 1).
Table 2 Logistic regression analysis of the impact of rainfall and population density (number of females) on a female's probability of conceiving and on survival of calves.

Survival data
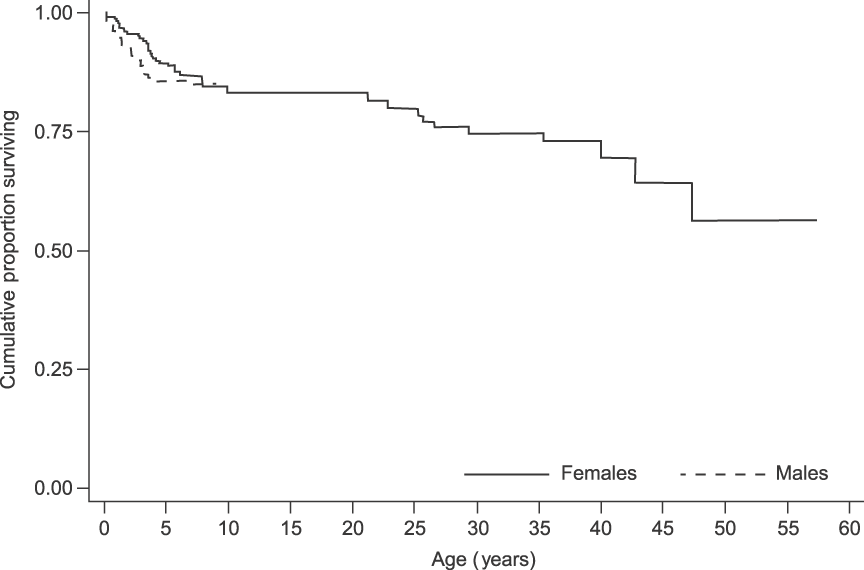
Over the 13 years 75 deaths (29 males, 40 females and six of unknown sex) were recorded, of which 63 (84%) were individuals younger than 8 years. Overall, survival was high in this population. There was no difference between the sexes in survivorship to age 8 (log-rank test statistic = 0.2, P = 0.655; Fig. 5). As the population is relatively young and few adult deaths have been recorded, both median life expectancy (where the cumulative proportion surviving in Fig. 5 would reach 0.5) and maximum longevity (57 ± 2.5 years) cannot yet fully characterize survival patterns (Moss, Reference Moss2001).

Fig. 5 Survival curves for the elephants in Tarangire National Park, Tanzania (Fig. 1). The male survival curve ends at 8 years because males were not followed after emigration from their natal group. For females, because the population is relatively young and few adult deaths have been recorded, both median life expectancy (where the cumulative proportion surviving would reach 0.5) and maximum longevity (57 ± 2.5 years) cannot yet fully characterize survival patterns.
Average annual mortality of calves (< 8 years old) was 3%, and average annual adult female mortality (≥ 8 years) was 1% (Table 1). Overall, these rates were low, although the calf rate is three times that of adults and the two were significantly different (t 22 = 1.997, P = 0.029). Calf survival was significantly predicted by the rainfall × females interaction term and the female term was close to significant (Table 2), with decreases in density causing increased risk of mortality. However, this effect is attributable to a single year's (1994) high mortality that occurred at the end of 2 years of drought and coincided with the time when the population was smallest; when excluded, there are no significant predictors of calf survival (χ 2 = 5.964, df = 3, P = 0.113). No variables significantly predicted survival in adults (χ 2 = 0.627, df = 3, P = 0.890).
Discussion
The Tarangire elephants illustrate the ability of a population to exhibit rapid intrinsic growth when experiencing favourable conditions. The high growth rate (7.03%) of the female northern subpopulation over the past 13 years is equivalent to the maximum possible growth rate for elephants calculated (based on a two-sex model population) at 7% per annum by Calef (Reference Calef1988). Tarangire's high annual growth is created by short interbirth intervals, early age at first birth and extremely low mortality. The rapid growth was probably influenced by three key factors: favourable environmental conditions, lack of density dependence and release from the stresses of heavy poaching.
Our study illustrates the strong impact of climatic variability on elephant reproductive biology. The relationship between probability of conceiving and rainfall has also been reported in other populations (Gough & Kerley, Reference Gough and Kerley2006; Wittemyer et al., Reference Wittemyer, Rasmussen and Douglas-Hamilton2007b). Although our study period included a severe drought (1993–1994), with concomitant low conception rate (9% in 1993), for most of the study rainfall was near or above average, driven in part by the 1998 El Niño Southern Oscillation. In these years of good rainfall, Tarangire elephants fed year-round on perennial grasses rather than switching to browse as is typical during the dry season, when elephants often cease growing and body condition declines (Malpas, Reference Malpas1977; Foley et al., Reference Foley, Papageorge and Wasser2001). This allowed them to maintain body condition and allocate energy to rapid reproduction, resulting in high conception rates (76% in 1998).
In accordance with previous results on ungulate survival patterns (Gaillard et al., Reference Gaillard, Festa-Bianchet, Yoccoz, Loison and Toigo2000) adult mortality in this population was low and unvarying from year to year. First-year mortality (2.2%) was minimal compared to observations of 10% in Amboseli (Moss, Reference Moss2001) and 4% in Addo (Gough & Kerley, Reference Gough and Kerley2006). Although there was no detectable effect of rainfall on calf or adult mortality, the highest single-year mortality rate for calves (14.8%) was in 1994 at the end of a severe drought.
We found no evidence that the population's growth rate or demographic parameters are affected by density dependence. At the end of the study the northern subpopulation had a density of c. 0.61 elephants km-2. Our results indicate that per capita food in Tarangire National Park is sufficiently abundant to avoid density-dependent impacts at current population levels, probably because of a combination of temporal variation in browsing pressure (ungulates leave the Park during the wet season), a productive habitat and benign environmental conditions.
Finally, the rapid growth is also probably related to improved protection. Poaching virtually ceased in the Park following the 1989 ivory ban and during the study there were no known poaching incidents in the northern subpopulation. The stresses that accompany poaching can negatively affect conception, and infant mortality increases as family groups move long distances to avoid humans or vulnerable feeding areas and waterholes during daylight (Barnes & Kapela, Reference Barnes and Kapela1991; Abe, Reference Abe1994). This signature can be seen in Tarangire's 2005 population structure (Fig. 3), which has low recruitment in age classes 5–10 (7.8% of the population) compared to 0–5 (27%). The 5- to 10-year-olds were born in 1983–1989 during intense poaching but average rainfall (Fig. 2) and clearly illustrate either lower fecundity or increased calf mortality in that period.
The Tarangire population's rapid recovery contrasts with other heavily poached populations. In Mikumi National Park (Tanzania) c. 75% of the population was poached prior to 1989; 15 years later, 33% of adult females were non-reproductive and group sizes were still extremely small (mean = 2.2 animals; 30% of groups had a single adult female; Gobush et al., Reference Gobush, Mutayoba and Wasser2008). The reason for the differences in recovery may lie in the severity of the poaching: only 14% of family groups in Mikumi had matriarchs > 30 years old in 1989 (Poole, Reference Poole1989) compared to 46% in Tarangire in 1993 (Foley, Reference Foley2002). It is possible that beyond a certain threshold of disruption the benefits of social affiliations are impaired and may retard growth for many years.
The results of this study have implications for other elephant populations that are recovering from poaching, are recently introduced into protected areas or are simply afforded better protection, illustrating the ability to enter a rapid growth phase that can last for an extended period. Such rapid growth rates may benefit wildlife managers in areas seeking to increase their elephant populations to create viable populations and/or tap into growing tourism and sport hunting markets. Conversely, in well-protected areas where elephant densities are approaching desired upper levels, such high levels of growth are likely to put increasing pressure on managers to take action to reduce elephant numbers or expand the area available to them (Wittemyer et al., Reference Wittemyer, Getz, Vollrath and Douglas-Hamilton2007a).
The Tarangire population is an example of one end of the spectrum in elephant population dynamics: a young population, greatly altered by poaching, which can grow nearly exponentially in a benign environment moderated only by temporal variation in climatic conditions. At the other end of the spectrum, populations at high densities have been recorded with different dynamics, including mean interbirth intervals of up to 9 years (Murchison Falls; Laws et al., Reference Laws, Parker and Johnstone1975) and mean age at first conception of up to 22 years (Budongo; Laws et al., Reference Laws, Parker and Johnstone1975). These studies illustrate the flexibility and complexity of elephant population dynamics over time and across ecological conditions. Knowledge of this demographic variability will be important in improving quantitative planning for elephant management options. Decision making based on models (Whyte et al., Reference Whyte, van Aarde and Pimm1998) is often used to determine the magnitude, cost and feasibility of potential management actions, such as culling, contraception or translocation. Rather than simply using average demographic parameters such models should explore the range of observed dynamics to ensure that worst and best case scenarios for demographic projections are considered. Our expanding body of knowledge of elephant population dynamics should help ensure that elephant management decisions are based on the best quantitative information available. Moreover, the elephant serves as an example for other long-lived vertebrates with complex social systems, such as many species of whales and primates, demonstrating that such populations may have more flexibility than expected, thus allowing them to recover rapidly from catastrophic events.
Acknowledgements
Lincoln Park Zoo, Woodland Park Zoo and the Wildlife Conservation Society provided funding for this research. CAHF thanks the Tanzania Wildlife Research Institute, the Tanzania Commission for Science and Technology and Tanzania National Parks for permission to work in Tarangire. This article was improved by comments from Lara Foley, Julia Chosy, Sarah Durant, Steve Thompson, Joanne Earnhardt, Dominic Travis, Nathalie Pettorelli, Aram Calhoun, J. Gaillard and two anonymous reviewers. We thank John Kortas for assistance with the preparation of figures.
Biographical sketches
Charles A.H. Foley is interested in large-mammal research and conservation in East Africa. He is the assistant country director for the Wildlife Conservation Society in Tanzania and co-director of the Tanzania Mammal Atlas Project. Lisa J. Faust’s research interests focus on demography of small or threatened animal populations. She uses historical analysis and modelling of future dynamics to identify threats to viability and to improve and clarify management options for both zoo and free-ranging wildlife populations.


