


1. Introduction
Prior studies have examined life annuity prices in various markets. Normally, this is done by comparing annuity prices to the present values of the annuities' expected payments (where the expectation accounts for the recipients' survival probabilities). The results of this comparison, commonly referred to as annuities' money's worth ratios (MWRs), typically depend on the choices of discount rates and mortality tables. It is not uncommon to see numbers for MWRs that vary by as much as 15% (e.g., between an MWR of 0.85 and 1) when different choices are made, leading to ambiguous conclusions.Footnote 1
In this paper, we employ an alternative approach in order to examine annuity price behavior in Canada. In particular, we study how quickly and fully annuity providers change annuity prices in response to changes in market conditions, specifically changes in market interest rates.Footnote 2 To do so, we use the approach employed by Charupat et al. (Reference Charupat, Kamstra and Milevsky2016), who propose an expression for durations of life annuities. The proposed annuity durations have the same logic as that of bond durations; i.e., to measure the sensitivity of annuity prices to changes in interest rates. One major advantage of this approach is that it does not require an assumption on a life table. This is because the estimation process does not involve pricing life annuities. Rather, the estimation deals with changes in observed market annuity prices.
We apply the duration approach to study the price adjustments of Canadian life annuities over the period from 2000 to 2019. In the process, we also investigate how annuity prices behaved during the 2008 financial crisis and its immediate aftermath. This is the period where a few prior studies report that there was a disconnect between annuity prices and the level of interest rates (Milevsky and Shao, Reference Milevsky and Shao2010; Koijen and Yogo, Reference Koijen and Yogo2015). Our main results are as follows. First, we find that while annuity price responses are not immediate, adjustments start to occur during the period between the second and the fourth weeks in response to changes in interest rates over the same period. The longer the period, the more substantial and more complete the adjustments become. For longer time horizons (up to 20 weeks), the price responses of most annuity combinations (annuitant age, gender, and guarantee periods) are close to, but still statistically significantly different from, their theoretical expectations. We conjecture, based on our conversation with insurance companies, that the slight delay in response may be due to the annuity providers' desire to smooth out the price changes (so as to avoid creating timing risk for potential buyers) and/or to wait to get a better idea of the rate movements.
Second, there is an asymmetry in annuity price responses between when interest rates decline and when interest rates increase. For almost all annuity combinations (and especially for annuitants of advanced ages), the duration estimates are higher when interest rates decline than when interest rates increase. That is, annuity providers raise prices faster when interest rates decline than reduce prices when the opposite occurs. These differences are generally statistically and economically significant. This pattern of response is disadvantageous to annuity customers and may be due to the fact that annuity providers guarantee their price quotes for a period of time.Footnote 3 This guarantee hurts them if in the meantime interest rates decline and they need to raise prices, but does not benefit them if the opposite occurs. Cooper (Reference Cooper1986) argues that this kind of price protection policy can cause businesses to raise prices more quickly than reduce them.
Third, when we separate the sample period into two subperiods of equal length, we initially find that the patterns of price responses are different between the two subperiods. In the first subperiod (2000–2009), the price adjustments appear to be slightly asymmetric in the direction that benefits consumers, but the asymmetry is not statistically significant. During the second subperiod (2010–19), the responses are similar to, but slightly stronger than, what we find for the whole sample (i.e., the asymmetry is in the direction that is disadvantageous to consumers). However, upon further investigation, we find that the results in the first subperiod are distorted by the price behavior during the period of the 2008 financial crisis and the period of the recession that immediately followed it. During this period, annuity providers did not raise annuity prices (i.e., reduce the payout rates) to compensate for the pronounced decline in interest rates, causing a disconnect between annuity prices and the level of interest rates. Once we remove the financial crisis period from the first subperiod, we no longer observe contrasting price behavior between the two subperiods.
Finally, when we match our sample period to that of Charupat et al. (Reference Charupat, Kamstra and Milevsky2016), who estimate price sensitivity of life annuities in the US market, we find that annuity prices in Canada are more sensitive to changes in interest rates. This is evidenced by both the speed and the magnitude of the price adjustments. In addition, while we find that the pattern of price adjustments in Canada are disadvantageous to annuity customers, the US price adjustments reported in Charupat et al. (Reference Charupat, Kamstra and Milevsky2016) are asymmetric in the direction that benefits consumers.
This paper contributes to the annuity literature in the following ways. This study provides an in-depth analysis of the behavior of the annuity prices in Canada. Prior studies have generally estimated the MWRs in the Canadian markets as part of multi-country comparisons.Footnote 4 Our data allow us to examine the pricing action of annuity providers. That is, we observe how the supply side of life annuities reacts to changes in market conditions. This is in contrast to the majority of annuity studies, which attempt to understand consumers' demand for annuity. In order to get a complete picture of the annuity price behavior, it is essential to also understand how annuity providers adjust prices in the presence of changes in interest rates (bond yields). The use of fine (weekly) annuity quotes data enables us to closely monitor the price movements.
Our results also contribute to the discussion in the actuarial-fairness strand of the annuity literature. In a recent study, Shu et al. (Reference Shu, Zeithammer and Payne2016) conduct choice-based conjoint analysesFootnote 5 to identify which annuity attributes have the strongest influence on consumer demand. They report that perceived fairness of annuities as a financial product is the strongest predictor of annuity demand, while traditional factors such as health conditions, life expectancy, income levels, bequest motives, and risk aversion are either insignificant or small in their effects. The higher the fairness perception an individual has, the more receptive he/she is to purchasing a life annuity. Our findings indicate that changes in Canadian annuity prices in response to interest rate movements are slightly to the disadvantage of annuity customers.
In addition, the delayed and asymmetric price response to new interest rate information has a practical implication for annuity customers. Depending on the direction of interest rate movements, the timing of an annuity purchase can affect the magnitude of welfare gains that an individual obtains from annuitization. This is particularly important because a purchase of a life annuity is an irreversible transaction and typically involves a substantial portion of their wealth.
The paper is organized as follows. In the next section, we present the expression for the durations of life annuities, and calculate their theoretical values. Empirical estimates of durations are done in Section 3. Then, in Section 4, we perform robustness checks. Finally, Section 5 concludes the paper.
2. Measure of life annuity price behavior
We use the duration approach developed in Charupat et al. (Reference Charupat, Kamstra and Milevsky2016) to measure the speed and the magnitude of changes in annuity prices in response to changes in market conditions, specifically changes in market interest rates. We concentrate on life annuities that are conditional on a single life, and whose payouts start immediately and last as long as the annuitant is alive, with a guarantee period of g years. In the continuous-time context, the actuarially fair price of this kind of annuity (assumed that the payouts are $1 per year) for an x-year-old individual is given as:

where r is the interest rate, which is assumed, for ease of exposition, to be constant for all terms (see the discussion at the end of this section), and p(x, t) is the probability that an x-year-old individual will survive to at least age x + t. The first term on the right-hand side of equation (1) is the present value of the guaranteed payouts, while the second term is the present value of the expected payouts after the guarantee period, where expectation is with respect to the survival probabilities.
The duration, D, of a life annuity is then defined as:

The expression is akin to the concept of modified duration in the fixed-income literature. D measures the sensitivity of life annuity prices with respect to changes in interest rates.
We use equations (1) and (2) to calculate theoretical prices and theoretical durations of life annuities respectively. To do so, we assume that mortality follows the widely used Gompertz law with the following parameters: m = 88.18 years and b = 10.50 years for males; and m = 92.63 years and b = 8.78 years for females. These values are calibrated by Milevsky and Young (Reference Milevsky and Young2007) to reflect the mortality statistics of people who buy life annuities (and who likely have longer life expectancies than that of the average population).Footnote 6 For interest rates, we use the Government of Canada long-term bond yields as the proxy for the rates of return that annuity providers earn on their investment portfolios.Footnote 7 While the Bank of Canada does not make explicit which maturity the term ‘long-term’ refers to, our reading of the Bank's documents indicates that it corresponds to the 30-year bonds.Footnote 8 The long-term nature of the yields corresponds closely to the long-term nature of the obligations that annuity providers have under their life annuities. We do not focus on corporate bond yields because the markets for Canadian corporate bonds are not very transparent or liquid.Footnote 9 In addition, prior studies have shown that high-grade corporate bonds behave in a similar manner to Treasury bonds (e.g., Kwan, Reference Kwan1996; Collin-Dufresne et al., Reference Collin-Dufresne, Goldstein and Martin2001). We also rule out the use of long-term mortgage rates because they themselves have been shown to exhibit ‘sticky’ behavior, whereby they adjust asymmetrically to changes in policy rates. They increase faster than they decline in response to rate movements (e.g., Haney, Reference Haney1988; Allen and McVanel, Reference Allen and McVanel2009; Dondeti and McGowan, Reference Dondeti and McGowan2014).
Tables 1 and 2 display the theoretical annuity factors (i.e., annuity prices based on payouts of $1 per year) and theoretical durations for life annuities for various annuitant ages guarantee periods. Panel A of both tables is for female annuitants, while panel B is for male annuitants. As to be expected, annuity prices are higher for younger annuitants than older ones (true for both sexes), and for women than for men (of the same age). This is due to survival probabilities being higher for younger people and for women. In addition, the longer the guarantee period, the more expensive the annuities.
Table 1. Theoretical annuity factors (in $) – female and male annuitants of various ages

Note: This table displays theoretical annuity factors for female (panel A) and male (panel B) annuitants of various ages and with various guarantee periods.
Table 2. Theoretical durations – female and male annuitants of various ages
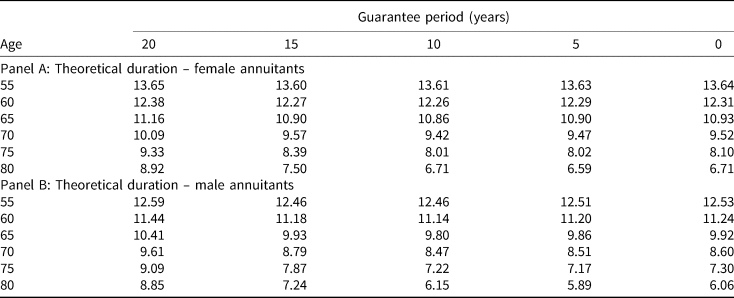
Note: This table displays theoretical durations for female (panel A) and male (panel B) annuitants of various ages and with various guarantee periods.
As for durations, they are higher for female annuitants than for male annuitants of the same age. That is, life annuities for women are more sensitive to changes in interest rates than life annuities for men. Durations are also higher for younger annuitants than for older ones, indicating that annuities for younger annuitants are more sensitive to interest rate movements. Again, both of these observations are due to the fact that women and younger annuitants are expected to live longer and so the streams of payments are longer.
Finally, we note that the assumption that interest rates are constant for all terms is made for ease of exposition. As shown in Charupat et al. (Reference Charupat, Kamstra and Milevsky2016), when the whole term structure is used to derive theoretical durations, the resulting duration values are generally very close to those obtained under the assumption that rates are constant for all terms. This is true under reasonable assumptions on possible changes in the term structure. As a result, the assumption has very minimal effects on the inferences of the tests that we will perform below.
As a robustness check, we also repeat the duration estimation using the Government of Canada 2-, 3-, 5-, 7-, and 10-year bond yields (i.e., different points on the term structure). The use of the alternative yields does not change the results in a substantial manner (see Section 4.2).
3. Empirical durations
3.1 Data description
Our data consist of weekly quotes of payouts of single-life, immediate life annuities that were available from various annuity providers in the Canadian market during the period from June 2000 to July 2019.Footnote 10 The quotes are in terms of monthly income that annuitants would get per $100,000 of annuity principal. The quotes are based on sex (female and male), annuitants' ages (55–80 years old, in increments of 5 years), and guarantee periods (0–20 years, in increments of 5 years). As a result, there are in total 30 different annuity combinations for female annuitants and another 30 combinations for male annuitants. However, due to lack of sufficient data, we exclude four combinations (for each sex). They are 75-year-old annuitants with a 20-year guarantee, and 80-year-old annuitants with a 10-, 15-, and 20-year guarantee. Accordingly, we are left with 26 annuity combinations for each sex (or 52 in total).
For each annuity combination and for every week in the sample period, we remove the highest and the lowest quoted payouts, and then average the remaining quotes. We do this to mitigate the impact of outliers. Outliers could exist because annuity providers may occasionally provide non-competitive quotes, presumably to avoid issuing new annuities if they face mismatched asset and liability mixes. Weeks that have missing quotes are removed from the sample.Footnote 11 Then, we multiply the resulting averages by 12 to annualize them. Next, we divide the annuity principal (i.e., $100,000) by the annualized payouts in order to obtain the price per $1 of annual payout (i.e., annuity factors) for that particular week. We do this for every week in the sample period and obtain a time series of weekly empirical annuity factors for every annuity combination, whose summary statistics are reported in Table 3 (panel A for female annuitants and panel B for male annuitants).
Table 3. Empirical annuity factors (in $) – male and female annuitants of various ages
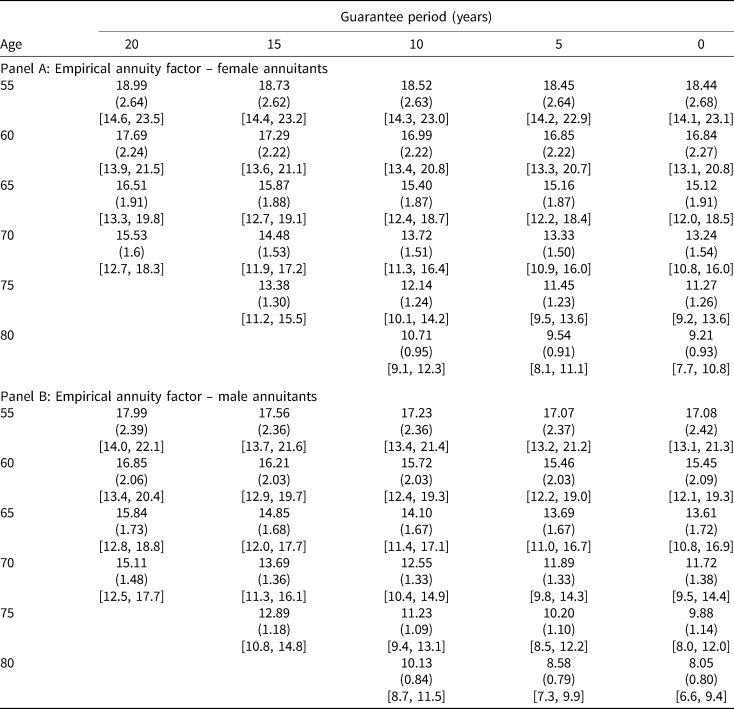
Note: This table displays the summary statistics on the empirical annuity factors for female (panel A) and male (panel B) annuitants of various ages and with various guarantee periods, over the period from 2000 to 2019. Standard errors are in parentheses. Minimums and maximums are in brackets.
In each cell (which corresponds to a combination of annuitant's age and guarantee period) of the two panels, the number in the top row is the time-series average of the empirical annuity factor, while the numbers in the second and third rows are its standard deviation and range, respectively. For example, for a 60-year-old female with a guarantee period of 10 years in Table 3, the annuity factor is, on average (over the sample period), 16.99. This is the price to pay for a stream of annual income of $1 per year that will last as long as she lives, with a minimum of 10 years. If she purchases $100,000 worth of this annuity, the amount of yearly income will be $100,000/16.99 = $5,885.82 (or a ‘payout rate’ of 5.8858% per year). Over the sample period, the annuity factor for this annuity combination has a standard deviation of 2.22, and ranges in values between 13.40 and 20.80.
The empirical annuity factors in Table 3 are very close to their theoretical counterparts in Table 1, indicating that our use of the Government of Canada long-term bond yields as the proxy for interest rates (or the rates of return that annuity providers earn on their investment portfolios) is reasonable. The empirical annuity factors also exhibit the same properties as those of their theoretical counterparts; i.e., annuities are more expensive for younger annuitants, for women than for men (of the same age), and for longer guarantee periods.
Finally, in terms of annuity payout rates, Figure 1 displays the time series of annuity payout rates for annuitants of various ages with no guarantee period (panel A for female, and panel B for male). In each panel, all series of annuity rates look to be parallel to one another, with the rates being lowest for the 55-year-old annuitants (consistent with the fact that annuities are more expensive for younger annuitants). Over the sample period, all series have the same pattern of downward trends. For comparison, we also include the time series of the Government of Canada long-term bond yields. The bond yields have a similar pattern of downward movements, but appear to be more volatile. We note also three other things. First, all annuity rates are higher than the bond yields, reflecting the mortality risks of the annuity payments. Second, annuity rates are lower for women than for men, reflecting the differences in their survival probabilities. Third, the period of the recession in 2008 was one of singular departure of annuity rates from the bond yield; over this period bond yields dropped precipitously but annuity rates actually went up.

Figure 1. Long-term Government of Canada bond yields and annuity payout rates: (a) female (no guarantee period) and (b) male (no guarantee period).
Note: Panels (a) and (b) display plots of the Government of Canada long-term bond yields and the annuity rates across age groups for female and male annuitants, with no guarantee period. The data period is from 2000 to 2019. In both panels, the recession period in 2008/09 is shaded for easy reference.
3.2 Sensitivity estimates
3.2.1 Methodology and summary statistics
We use a generalized method of moments (and robust standard errors) to estimate empirical durations (i.e., the sensitivity of empirical annuity factors to changes in interest rates). The dependent variable is the percentage change in the empirical annuity factors over a specified length of time (multiplied by −1 to account for the inverse relationship between annuity prices and interest rates), while the independent variable is the change in interest rates over the same length of time. Formally, let a i(x, g) be the empirical annuity factor for week i for an x-year-old annuitant with a guarantee period of g years. The percentage change in its value over k weeks is:

Also, let r i be the percentage interest rate for week i. The change in the rate over k weeks is:

Accordingly, our regression equation is:

We run regressions based on the above equation on all annuity combinations (i.e., annuitant ages and guarantee periods), where changes in the dependent and independent variables are measured over various lengths of time – from k = 1 week to 20 weeks (henceforth referred to as ‘measurement period’). The various measurement periods allow us to observe the speed of annuity price adjustments.
The summary statistics for dependent and independent variables of the regression are presented in Table 4. For the independent variable (panel A), during the sample period, the Government of Canada long-term benchmark bond yields have an average of 3.71% p.a., with a minimum of 1.60% p.a. and a maximum of 6.11% p.a. The average of the weekly (i.e., k = 1) changes in the yields is −0.0039% p.a. with a standard deviation of 0.0778% p.a. Over longer measurement periods (e.g., k = 5, 10, 15 and 20 weeks), the magnitude of the average changes in the yields grow approximately linearly, while the standard deviations also increase (but at a much slower rate). For example, the average change in the yields over a period of 20 weeks is −0.0750% p.a. (or about 19 times the average weekly change) with a standard deviation of 0.2999 (or about 3.9 times the standard deviation of the weekly changes). In absolute value terms, the average of the weekly changes is 0.0612% or 6.12 basis points, while the average of the changes over 20 weeks is 0.2497% or 24.97 basis points (not shown).
Table 4. Summary statistics of the Canadian long-term treasury bond yields and weekly percentage changes in annuity factors

Note: Panel A displays the summary statistics for weekly levels of the Government of Canada long-term bond yields over the period from 2000 to 2019, and also the changes in the yields over various lengths of periods. Panel B displays the summary statistics of weekly changes in annuity factors for female annuitants. Panel C displays the summary statistics of weekly changes in annuity factors for male annuitants. Standard errors are in parentheses. Minimums and maximums are in brackets.
For the dependent variable (panel B for female annuitants and panel C for male annuitants), the average weekly changes range from −0.027% and −0.051%, depending on the sex and annuity combinations. Recall that the dependent variable is defined as the negative of the rates of change in the annuity factors. This means that the average weekly changes in the annuity factors themselves are positive and lie between +0.027% and +0.051%. This is reasonable, considering that interest rates were for the most part declining during the sample period (see Figure 1). We note that the older the annuitants, the smaller and less volatile the weekly changes in annuity factors are.
3.2.2 Regression estimates
We obtain regression estimates for all annuity combinations and measurement periods (i.e., from k = 1 to 20 weeks). For measurement periods of longer than 1 week, overlapping observations are used in the regressions, and the Newey–West procedure is used in calculating the standard errors of the estimates. We note that longer measurement periods help to mitigate any non-synchronicity problems in matching the observations on annuity quotes (which are released on Wednesdays and are a firm commitment for several days, and bond rates observed at market close on Tuesdays).
The estimates for all annuity combinations follow a similar pattern. For example, Figures 2(a) and 2(b) display the patterns of duration estimates for annuities with no guarantee period for female and male individuals of five different ages (55–75) respectively. All the five lines on each figure have the same pattern, which is that the estimated durations are low when the measurement period is 1 week, then increase steeply when the measurement period is between 2 and 4 weeks, and subsequently increase gradually to reach their plateaus.Footnote 12

Figure 2. Duration estimates: (a) female annuitants with no guarantee period and (b) male annuitants of various ages with no guarantee period.
Note: Panels (a) and (b) display plots of the duration estimates for female and male annuitants of various ages with no guarantee period The sample period is from 2000 to 2019.
Next, we examine whether the duration estimates are similar to their theoretical values. To do so, we consider duration estimates for all annuity combinations when the measurement period is k = 20 weeks (i.e., at the plateaus). The estimates are presented in Table 5 (with R 2's in parenthesis). Panel A is for female annuitants, and panel B is for male annuitants. Depending on the annuity combinations, the estimates range from 4.50 to approximately 10. In percentage terms, these estimates are generally between 70% and 75% of their theoretical values in Table 2. The R 2's of all regressions are around 65%. The results indicate that while annuity price adjustments are more complete over a longer period of time in response to longer-term changes in interest rates, they (except in one case) are still significantly different from what the theoretical values suggest. The exception occurs with the annuity for an 80-year-old male and female with no guarantee period.
Table 5. Empirical durations of all annuity combinations: k = 20 weeks

Note: This table displays the estimated durations of life annuities and the model R 2's, derived from the following regression equation: ${-}Y = \alpha ^{x, g} + \beta ^{x, g}\Delta r_i( k ) + \varepsilon _i.$
The independent variable of the regressions is the lagged change in the Government of Canada long-term bond yields measured over a period of 20 week (k = 20). The dependent variable is the negative of the percentage changes in the annuity factors over the same measurement period for female and male annuitants of various ages and with various guarantee periods. All regressions are performed one at a time, estimated with GMM and HAC standard errors. To calculate the HAC standard errors, we follow Newey and West (1994). Bolded coefficients denote significance at the 0.05 level, based on two-sided tests, of a difference between the estimated duration coefficient and the theoretical value. R 2's are in parentheses.
To summarize, annuity providers do not adjust prices fully or immediately to respond to weekly changes in interest rates. Rather, the adjustment process is done over a long period of time in response to changes in interest rates over the same period. A sizable portion of the adjustment occurs during the period between the 2nd and the 4th weeks. Beyond 4 weeks, price adjustments continue, but at a more gradual rate. The longer the period, the more substantial the adjustments become, and the more the adjustments can be explained by interest rate changes. Nevertheless, regardless of the time horizons, the price changes are less than complete.
One possible explanation for the slightly delayed responses is that annuity providers do not want to change prices every time interest rates move. Doing so would make annuity prices more volatile and thus could create timing risk for potential buyers.Footnote 13 Instead, annuity providers wait slightly longer in order to get a better idea of the rate movements.Footnote 14 As discussed in Section 3.2.1, the changes in interest rates over longer periods are (monotonically) larger in magnitude, increasing at a linear rate, but their standard deviations are increasing at a much slower rate than linear. We interpret this as indicating that the uncertainty in the rate movements becomes smaller (relative to the size of the changes) as the waiting period grows longer. This is why we observe stronger price responses to longer-term changes in interest rates.
3.3 Sensitivity estimates: asymmetric responses
We now examine whether there is a difference in how annuity providers adjust annuity prices (or payout rates) when market interest rates increase versus when market interest rates decline. Charupat et al. (Reference Charupat, Kamstra and Milevsky2016) observe that US annuity providers respond to interest rate changes in an asymmetric fashion, but in the direction that benefits consumers. When interest rates increase, annuity providers reduce annuity prices (by increasing the payout rates) by a greater magnitude than what they do in the opposite direction when interest rates decline.Footnote 15
To find out whether such an asymmetric response also occurs in the Canadian annuity market, we modify our regression equation as follows:

where I Δr,neg is an indicator variable that takes on the value of one when interest rates decline (Δr i(k) < 0) and zero otherwise. As a result, $\beta _1^{x, g}$ is the estimated duration when Δr i(k) > 0, and $\beta _1^{x, g} + \beta _2^{x, g}$
 is the estimated duration when Δr i(k) < 0.
3.3.1 Estimated durations
For both directions of interest rate movements, the estimates for all annuity combinations generally follow a similar increasing pattern (as the measurement periods lengthen) to that of the symmetric case above. As a result, we choose to report in Table 6 the results for the measurement period of k = 20 weeks for all annuity combinations. Panels A–C are for female annuitants, and panels E and F are for male annuitants.
Table 6. Empirical durations of all annuity combinations: asymmetric regression, k = 20 weeks
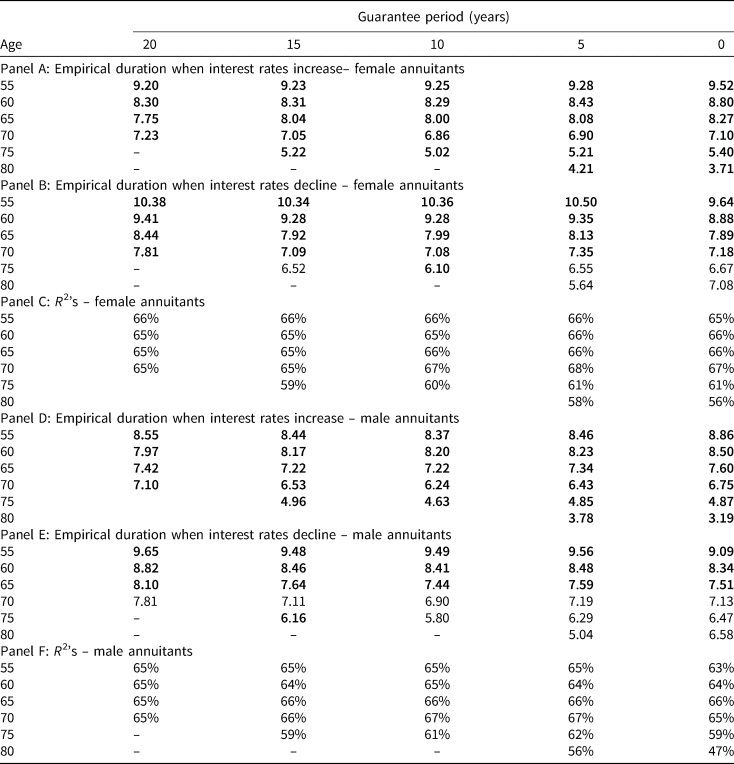
Note: This table displays the estimated durations of life annuities when interest rates increase or decline, together with the model R 2's, derived from the following regression equation: ${-}Y = \alpha ^{x, g} + \beta _1^{x, g} \Delta r_i( k ) + \beta _2^{x, g} \Delta r_i( k ) \cdot I_{\Delta r, neg} + \varepsilon _i.$
The independent variables of the regressions are the lagged change in the Government of Canada long-term bond yields, measured over a period of 20 weeks (k = 20), and this variable interacted with a dummy variable that takes on a value of one if the interest rate decreases. All regressions are performed one at a time, estimated with GMM and HAC standard errors. To calculate the HAC standard errors, we follow Newey and West (1994). Bolded coefficients denote significance at the 0.05 level, based on two-sided tests, of a difference between the estimated Duration coefficient and the theoretical value.
Comparison of the duration estimates between the two directions of interest rate movements (i.e., comparing panels A with B for female, and panels D with E for male) suggests that for almost all annuity combinations, the duration estimates are higher when interest rates decline than when interest rates increase. This is especially true for annuitants of advanced ages (i.e., female annuitants aged 75 and 80 and male annuitants aged 70, 75, and 80). In fact, for these annuities, the estimated durations for when rates decline are generally not significantly different from their theoretical values (i.e., unbolded values in Panels B and E). This is true not only for k = 20 weeks, but also for other measurement periods, starting from about k = 12 weeks (not shown). Thus, it appears that annuity prices in Canada are raised in a faster and more complete manner when interest rates decline, than they are reduced when interest rates increase. This pattern of response is indeed disadvantageous to annuity customers and is in the opposite direction to the response in the US market reported by Charupat et al. (Reference Charupat, Kamstra and Milevsky2016).Footnote 16
Note that, in Table 6, we do not report the coefficient that measures the difference in response between the two directions of interest rate movements, $\beta _2^{x, g}$ , but rather the sum of $\beta _1^{x, g} {\rm \;and\;}\beta _2^{x, g}$
 . However, we test the joint significance of the coefficient estimates $\beta _2^{x, g}$
 across age and guarantee periods by sex, double clustering standard errors by date and age/guarantee groups. We find that these regression coefficients are strongly statistically significant.Footnote 17
Economically, the differences are meaningful. For example, consider the annuity for a 55-year-old female with a 20-year guarantee period. The duration estimates (with k = 20 weeks) are 9.20 years when interest rates go up (panel A) and 10.38 years when interest rates go down (panel B), a difference of 1.18 years. For an annuity principal of $1,000,000 (which, based on the empirical annuity factor in Table 3, provides an annual income of $1,000,000/18.99 = $52,659 per year), the difference of 1.18 years translates to a difference in price adjustments of $1,000,000 × 1.18 × 0.002497 = $2,946, where 0.002497 (or 0.2497%) is the average of the absolute values of interest rate changes over a 20-week period (see Section 3.2.1).
4. Robustness check
To ensure that our results are robust, we perform several additional tests. First, in order to explore sub-sample stability, we split our sample into two periods of roughly equal lengths, and then repeat the duration analysis. Second, we explore the sensitivity of our results to the choice of the benchmark interest rate. Our results heretofore use the Government of Canada long-term bond yields, which correspond closely to the long-term nature of the obligations of life-annuity providers. To check whether this use affects our conclusions, we repeat our analyses using five other interest rates, which represent different points on the term structure. Finally, we compare our findings to the reported annuity pricing behavior in the US market.
4.1 Estimated sensitivity for subperiods
Our sample period spans 20 years – from 2000 to 2019. It is possible that the speed and magnitude of annuity price responses vary through time. To examine this possibility, we divide our sample period into two subperiods of roughly equal lengths. The first subperiod is from June 2000 to December 2009, while the second subperiod is from January 2010 to July 2019.Footnote 18
4.1.1 First subperiod (2000–2009)
The plots of duration estimates for annuities with no guarantee period for female annuitants of various ages for the first subperiod are shown in Figures 3(a) (for when interest rates increase) and 3(b) (for when interest rates decline). The plots for annuities with other guarantee periods or for male annuitants are qualitatively similar.

Figure 3. (a) Duration estimates when interest rates increase – female annuitants with no guarantee period (2000–2009). (b) Duration estimates when interest rates decline – female annuitants with no guarantee period (2000–2009).
Note: Panels (a) and (b) display plots of the duration estimates for female annuitants of various ages with no guarantee period, when interest rates increase and when interest rates decline, respectively. The sample period is from 2000 to 2009.
There are two notable differences between the two figures. First, when interest rates increase (Figure 3(a)), the estimates appear to reach their peaks when k = 9, and then slightly decrease. In contrast, when interest rates decline (Figure 3(b)), the estimates keep trending up as the measurement periods lengthen. Second, it appears that the magnitude of the estimates is slightly higher in Figure 3(a) than in 3(b). Taken together, the estimates raise the possibility that prices respond slightly more quickly and fully when interest rates increase than when interest rates decline. If this is the case, it would be beneficial to consumers.
To verify this, we examine the estimated values of $\beta _2^{x, g}$ for all annuity combinations and measurement periods (a total of 1,040 estimates; i.e., 26 combinations per sex, and k = 1–20). This coefficient captures the asymmetry or the differences in price responses between the two directions of interest rate movements (see equation (6)). The vast majority of the $\beta _2^{x, g}$
 estimates (937 out of 1,040) are negative (which means that the estimated durations are higher when interest rates increase). However, when we test the joint significance of the coefficient estimates $\beta _2^{x, g}$
 across age and guarantee periods by sex, double clustering standard errors by date and age/guarantee groups, these regression coefficients are statistically insignificant across all annuity combinations and measurement periods, for both females and males.
In summary, in the first subperiod, the duration estimates display a slight, but statistically insignificant, asymmetry. In terms of magnitude, the duration estimates, at their peaks, are close to the theoretical values, with some of them not being significantly different for the theoretical values (typically annuities for people aged 70 and older, with no or short guarantee periods).
4.1.2 Second subperiod (2010–19)
Figures 4(a) and 4(b) display the plots of duration estimates for annuities with no guarantee period for female annuitants of various ages for the second subperiod. One notable observation from the figures is that there appears to be an asymmetry in the price responses between the two directions of interest rate movements, but this time the duration estimates are slightly higher when interest rates decline (Figure 4(b)) than when interest rates increase (Figure 4(a)).

Figure 4. (a) Duration estimates when interest rates increase – female annuitants with no guarantee period (2010–19). (b) Duration estimates when interest rates decline – female annuitants with no guarantee period (2010–2019).
Note: Panels (a) and (b) display plots of the duration estimates for female annuitants of various ages with no guarantee period, when interest rates increase and when interest rates decline, respectively. The sample period is from 2010 to 2019.
As before, to verify this, we examine the estimated values of $\beta _2^{x, g}$ for all annuity combinations and measurement periods. The overwhelming majority of the $\beta _2^{x, g}$
 estimates (967 out of 1,040) are positive (which means that the estimated durations are higher when interest rates decline). When we test the joint significance of the coefficient estimates $\beta _2^{x, g}$
 across age and guarantee periods by sex, double clustering standard errors by date and age/guarantee groups, these regression coefficients are strongly statistically significant. This is consistent with the full sample result but very different from what we see for the first subperiod.
Accordingly, for the second subperiod, there is evidence that annuity price adjustments are asymmetric. When interest rates decline, annuity providers react more strongly (by increasing their prices more fully) than they do in the opposite direction (i.e., reducing the prices when interest rates increase). This pattern of response is disadvantageous to annuity customers.
4.1.3 Discussion
The results for the two subperiods appear to suggest that annuity price responses vary through time. Between 2000 and 2009, the price adjustments appear to be slightly asymmetric in the direction that benefits consumers, but the asymmetry is not statistically significant. During 2010–19, however, there is evidence of statistically significant asymmetry. The asymmetry is in the direction that is disadvantageous to consumers.
To see why there might be a difference in the results between the two subperiods, we examine the time series of the differences (or gaps) between annuity payout rates and interest rates (i.e., long-term government bond yields), as depicted in Figures 5(a) and 5(b). Figure 5(a) displays the trends of the gaps for female annuitants of various ages with no guarantee period, while Figure 5(b) displays the trends of the gaps for a 65-year-old female annuitant with various guarantee periods. As can be seen, the gaps suddenly increased in magnitude around September 2008, which is the month in which Lehman Brothers filed for bankruptcy and triggered a serious concern in the financial markets. The magnitude of the gaps remained unusually high until approximately the end of 2009.Footnote 19 This observation is consistent with the unusual price behavior during the same period that has been reported in a few previous studies (e.g., Milevsky and Shao, Reference Milevsky and Shao2010; Koijen and Yogo, Reference Koijen and Yogo2015).Footnote 20

Figure 5. (a) Differences between annuity rates and long-term bond yields for female annuitants of various ages with no guarantee period. (b) Differences between annuity rates and long-term bond yields for 65-year-old female annuitants with various guarantee periods.
Note: Panel (a) displays plots of the differences between the Government of Canada long-term bond yields and the annuity rates for female annuitants of various ages, with no guarantee periods. Panel (b) displays plots of the differences between the Government of Canada long-term bond yields and the annuity rates for female annuitants, age 65, with various guarantee periods. The data period is from 2000 to 2019. In both figures, the recession period in 2008/09 is shaded for easy reference.
We re-estimate the durations for the first subperiod, while leaving out the period from September 2008 to December 2009. The plots of the estimated durations for this ‘Pre-Crisis’ period for female annuitants with no guarantee period are shown in Figures 6(a) and 6(b). We can see that the patterns of duration estimates are different from the ones for the whole first subperiod in Figures 3(a) and 3(b). Here, the magnitude of the estimates appears to be slightly higher in Figure 6(b) than in 6(a), especially for longer measurement periods ($k{\kern 1pt} {\rm \geqslant }{\kern 1pt} 10$ weeks). In other words, the plots show that prices respond slightly more quickly and fully when interest rates decline than when interest rates increase. This is indeed the same pattern as the ones in the second subperiod.

Figure 6. (a) Duration estimates when interest rates increase – female annuitants with no guarantee period (2000–08/2008). (b) Duration estimates when interest rates decline – female annuitants with no guarantee period (2000–08/2008).
Note: Panels (a) and (b) display plots of the duration estimates for female annuitants of various ages with no guarantee period, when interest rates increase and when interest rates decline, respectively. The sample period is from June 2000 to August 2008.
Again, to verify this asymmetry, we examine the estimated values of $\beta _2^{x, g}$ for all annuity combinations and measurement periods. In a stark contrast to the results for the whole first subperiod (which includes the financial crisis period), a great majority of the $\beta _2^{x, g}$
 estimates (838 out of 1,040) are positive, which means that the estimated durations are higher when interest rates decline (not tabulated). However, most of them are small. As a result, the asymmetry is statistically insignificant by measure of the joint significance of the coefficient estimates $\beta _2^{x, g}$
 across age and guarantee periods by sex, double clustering standard errors by date and age/guarantee groups.
In summary, when the period of the 2008/09 financial crisis is excluded, we no longer observe contrasting price behavior between the two subperiods. Rather, we find that in both periods, annuity prices in general tend to respond more quickly and fully when interest rates decline than when interest rates increase. While this asymmetry is not statistically significant in the first subperiod, it is strongly significant in the second subperiod. This response pattern, regardless of the statistical significance, is economically meaningful and disadvantageous to consumers (see Section 3.3.1). We conjecture that the asymmetry may be due to the fact that Canadian annuity providers guarantee their price quotes for a period of time, which typically lasts for several days. This guarantee hurts them if in the meantime interest rates decline and they need to raise prices, but does not benefit them if the opposite occurs. This kind of price protection policy can cause businesses to raise prices more quickly than reduce them (Cooper, Reference Cooper1986).
4.2 Results using alternative interest rates
We repeat our estimates of empirical durations and the gaps between annuity payout rates and interest rates, using five other interest rates, which represent different points on the term structure. They are the 2-, 3-, 5-, 7-, and 10-year Government of Canada bond yields.
In both subperiods, the estimated durations under the five alternative interest rates exhibit the following patterns:
(i) The estimates are all lower than the corresponding estimates when the Government of Canada long-term bond yields are used. The R 2's of the regressions are also generally smaller.
(ii) For each alternative interest rate, the estimates for all annuity combinations generally follow the same increasing pattern that we witness earlier when the long-term bond yields are used (i.e., at first steeply and then gradually, as the measurement periods lengthen).
(iii) In general, the shorter the term of the bond yields used in the regressions, the smaller the estimated durations.
(iv) The same asymmetric pattern is observed. That is, annuity prices in general tend to respond more quickly and fully when interest rates decline than when interest rates increase. However, because the estimate durations under all five alternative interest rates are smaller, the asymmetry is generally weaker, especially for shorter rates.
In summary, the results suggest that the use of other bond yields does not change our findings in a substantial manner. The only difference of note is that the estimated durations are smaller, indicating that annuity prices are less responsive to changes in shorter-term interest rates than to changes in the long-term rates. We believe that this is to be expected because the yields on shorter-term bonds may not be as good a representative of the rates of return that annuity providers earn on their investment portfolios as the long-term bond yields are. Due to the long-term nature of their annuity liabilities, annuity providers try to invest in longer-term instruments in order to match the durations of their assets and liabilities.Footnote 21 Therefore, it appears unlikely that our use of the long-term bond yields produces significant bias on our findings.Footnote 22
4.3 Comparison to US results
Finally, we compare our sensitivity results to the findings of Charupat et al. (Reference Charupat, Kamstra and Milevsky2016), who estimate price sensitivity of life annuities in the US market. For proper comparison, we re-estimate the durations over the same sample period as theirs, which is from September 2004 to May 2012 without removing the 2008 financial crisis period. We use the asymmetric regression in equation (6). The results (not tabulated) display two major differences from the US results in Charupat et al. (Reference Charupat, Kamstra and Milevsky2016). First, annuity prices in Canada are more sensitive to changes in interest rates. This is evidenced by both the speed and the magnitude of the price adjustments. A sizeable portion of price changes in Canada occurs during the period between week 1 and week 4. In comparison, a large portion of price changes in the USA extends into week 6 (Figure 3 of Charupat et al., Reference Charupat, Kamstra and Milevsky2016). This suggests that the price responses in Canada are faster. Then, as the measurement periods lengthen, our estimated durations reach peak values that are between 70% and 80% of the theoretical durations, depending on the annuitant ages and the lengths of the guarantee periods. In contrast, the estimated durations for US annuities generally reach values that are only between 50% and 65% of the theoretical values (Tables 6 and 2 of Charupat et al., Reference Charupat, Kamstra and Milevsky2016). This suggests that the price responses in Canada are more complete.
The second major difference between our results and the US results is in the asymmetry of the price responses. For the US annuities, the estimated durations are higher (i.e., price adjustments are more complete) when interest rates increase than when interest rates decline (Table 7 of Charupat et al., Reference Charupat, Kamstra and Milevsky2016). This is advantageous to annuity customers. In contrast, as reported in the previous subsection, we observe the opposite asymmetric pattern in Canada (when the 2008 financial crisis period is removed from the sample). Canadian annuity providers tend to raise prices faster and more fully when interest rates decline than reduce prices when interest rates increase. This is especially true for annuities for older annuitants with no or short guarantee periods. This response pattern is disadvantageous to consumers.
5. Conclusions
We examine the behavior of Canadian life annuity prices over the period from 2000 to 2019 using the concept of annuity durations, which measure the sensitivity of annuity prices to changes in interest rates. Our main results are as follows. First, price adjustments are reasonably fast, starting from between the second and the fourth weeks in response to changes in interest rates over the same period. The longer the period, the more substantial and more complete the adjustments become. Second, for almost all annuity combinations (and especially for annuitants of advanced ages), the duration estimates are higher when interest rates decline than when interest rates increase. That is, annuity providers raise prices faster when interest rates decline than reduce prices when the opposite occurs. This pattern of response is disadvantageous to annuity customers. Third, when we compare our findings to those of Charupat et al. (Reference Charupat, Kamstra and Milevsky2016), who estimate price sensitivity of life annuities in the US market, we find that annuity prices in Canada are more sensitive to changes in interest rates. This is evidenced by both the speed and the magnitude of the price adjustments. In addition, while the pattern of price adjustments in Canada are disadvantageous to annuity customers, the US price adjustments reported in Charupat et al. (Reference Charupat, Kamstra and Milevsky2016) are asymmetric in the direction that benefits consumers.
In the process, we find that during the period of the 2008 financial crisis and the period of the recession that immediately followed it, annuity providers did not raise annuity prices (i.e., reduce the payout rates) to account for the pronounced decline in interest rates, causing a disconnect between annuity prices and the level of interest rates. This finding is consistent with those in a few prior studies (Milevsky and Shao, Reference Milevsky and Shao2010; Koijen and Yogo, Reference Koijen and Yogo2015).
Acknowledgments
We would like thank Moshe Milevsky, the two anonymous referees and the editor for their helpful comments. We are grateful to CANNEX Financial Exchange for providing us with the data. Narat Charupat's research is supported by a grant from the Social Sciences and Humanities Research Council of Canada. Mark J. Kamstra's research is supported by a grant from the Social Sciences and Humanities Research Council of Canada, and from the Canadian Securities Institute Research Foundation Limited Term Professorship.


