Suicide prevention is central to mental health policy in many countries (Reference Taylor, Kingdon and JenkinsTaylor et al, 1997; Department of Health, 2002). The strongest predictor of suicide is previous deliberate self-harm (Reference Sakinofsky, Hawton and Van HeeringenSakinofsky, 2000), which is found in 40–60% of suicides (Reference Hawton and FaggHawton & Fagg, 1988; Reference RygnestadRygnestad, 1988; Reference Suokas and LönnqvistSuokas & Lönnqvist, 1991; Reference Nordentoft, Breum and MunchNordentoft et al, 1993; Reference Foster, Gillespie and McClellandFoster et al, 1997). The most reliable figure for risk of suicide after deliberate self-harm in the UK was based upon a sample of patients identified in the early 1970s (Reference Hawton and FaggHawton & Fagg, 1988): 1% had died by suicide within a year. There are no recent statistics on the extent of risk. The incidence of deliberate self-harm has increased in the UK in recent years (Reference Hawton, Fagg and SimkinHawton et al, 1997), with an estimated 170 000 general hospital presentations per year (Reference Kapur, House and CreedKapur et al, 1998). In addition, the gender and age distribution for suicidal behaviour has altered, with marked increases in both suicide and self-harm in young men and a reduction in the female:male ratio for deliberate self-harm (Reference Hawton, Fagg and SimkinHawton et al, 1997; Reference Cantor, Hawton and Van HeeringenCantor, 2000). Little is known about how risk of suicide after self-harm varies with age, except that the risk increases with age in women (Reference Hawton and FaggHawton & Fagg, 1988; Reference Nordström, Samuelsson and ÅsbergNordström et al, 1995). Accurate and up-to-date detailed evidence on suicide risk after self-harm is important, especially in relation to targeting preventive efforts.
Using a long-term monitoring system for deliberate self-harm, we have investigated the short-term and longer-term risk of suicide following this behaviour. We have also examined the risk according to gender and age subgroups, and over time.
METHOD
Study sample
The sample was identified by means of the Oxford Monitoring System for Attempted Suicide, through which data are collected on all deliberate self-harm presentations to the general hospital in Oxford. This database includes non-admitted patients as well as those admitted to hospital, and those not assessed by the general hospital psychiatric service as well as those who are assessed (Reference Hawton, Fagg and SimkinHawton et al, 1997). The completeness of the case identification has been verified (Reference Sellar, Goldacre and HawtonSellar et al, 1990). The definition of deliberate self-harm includes intentional self-poisoning or self-injury, irrespective of motivation. The study sample consisted of all patients who presented during the 20-year period 1978–1997. Each patient's first episode during the study period was used as the index episode. The follow-up period was until the end of 2000.
Identification of suicides
Details of all individuals (name, gender and date of birth) who presented during the study period were submitted to the Office for National Statistics (ONS) for England and Wales. Tracing revealed whether these individuals were alive or dead on 31 December 2000. It also provided information (including the date) on those who had emigrated from England and Wales, moved to Ireland or Scotland, or left the register for other reasons. Further tracing was done through the Central Services Agency (Northern Ireland) and through the General Register Office for Scotland. Copies of death certificates were obtained for all those who had died. Deaths receiving a coroner's verdict of ‘suicide’ (ICD codes E950–E959; World Health Organization, 1992) were combined with those given a verdict of ‘undetermined cause’ (E980–E989) or ‘accidental poisoning’ (E850–E869) to create a ‘probable suicide’ group (henceforth referred to as ‘suicides’), because using suicide verdicts alone underestimates overall mortality from suicide (Reference Charlton, Kelly and DunnellCharlton et al, 1992). Cases for which no information was available on whether the person was alive or dead at any time during the follow-up period were excluded from the study.
Estimation of risk of suicide
Risk of suicide was calculated in terms of the number of persons entering a study period for whom outcome was known at the end of that period. Each person's first presentation within the study period was used in the calculation of risk over time. The risk of suicide within 1 year of deliberate self-harm was compared with general population rates of suicide in England and Wales. This comparison was restricted to suicides and deaths due to undetermined cause. Numbers of suicides and general population statistics categorised by gender and age groups for 1978, 1988 and 1998 were averaged and then applied to the study sample to compute expected numbers of deaths. The relative risk in the study sample was calculated as a ratio of actual v. expected numbers of deaths.
Statistical analyses
All patients traced by the ONS for any length of time from their first presentation were entered into a survival analysis. Kaplan–Meier curves were plotted and log rank tests used to test for differences in suicide risk between genders, age groups (10–24 years, 25–34 years, 35–54 years, 55 years and over) and 5-year index periods (1978–1982, 1983–1987, 1988–1992, 1993–1997). Risks of suicide at different time periods were estimated from this analysis, including 95% confidence intervals. Cox's regression models were fitted, assuming proportional hazards, to estimate risk over time and according to gender and age at index episode. Kaplan–Meier curves are shown in this paper truncated at 15 years of follow-up time, as numbers in some subgroups had by then fallen to less than 20% of the original sample (Reference Pocock, Clayton and AltmanPocock et al, 2002). Analyses were carried out using the Statistical Package for the Social Sciences version 10.0 (SPSS, 2000) and STATA version 7.0 (StataCorp, 2001).
RESULTS
The original sample included 12 666 patients. Because of lack of information on the patients' date of birth, 151 cases were not submitted to the ONS. Of the 12 515 cases submitted, the outcome in 929 cases could not be determined owing to incomplete or inaccurate information on name or date of birth, and 3 had unclassifiable information on date of death or underlying cause. Therefore a total of 11 583 cases for which information was available on the patient's mortality or survival were included in the investigation.
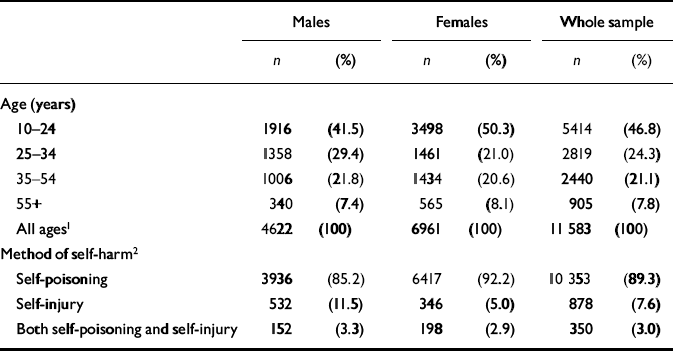
The majority of people in the sample were women and in the younger age groups (Table 1). Most self-harm episodes involved self-poisoning. The untraced patients did not differ significantly from the traced patients in terms of either gender or age. Somewhat fewer of the untraced patients had self-poisoned (84.3% v. 89.4%) and more had self-injured (11.7% v. 7.6%; χ2=23.85, d.f.=2, P<0.001). For those who were traced the follow-up time ranged from 1 day to 23 years, with a median of 10.8 years.
Table 1 Age, gender and method of deliberate self-harm at first presentation in the group of patients for whom survival information was available
| Males | Females | Whole sample | ||||
|---|---|---|---|---|---|---|
| n | (%) | n | (%) | n | (%) | |
| Age (years) | ||||||
| 10-24 | 1916 | (41.5) | 3498 | (50.3) | 5414 | (46.8) |
| 25-34 | 1358 | (29.4) | 1461 | (21.0) | 2819 | (24.3) |
| 35-54 | 1006 | (21.8) | 1434 | (20.6) | 2440 | (21.1) |
| 55+ | 340 | (7.4) | 565 | (8.1) | 905 | (7.8) |
| All ages1 | 4622 | (100) | 6961 | (100) | 11 583 | (100) |
| Method of self-harm2 | ||||||
| Self-poisoning | 3936 | (85.2) | 6417 | (92.2) | 10 353 | (89.3) |
| Self-injury | 532 | (11.5) | 346 | (5.0) | 878 | (7.6) |
| Both self-poisoning and self-injury | 152 | (3.3) | 198 | (2.9) | 350 | (3.0) |
Deaths
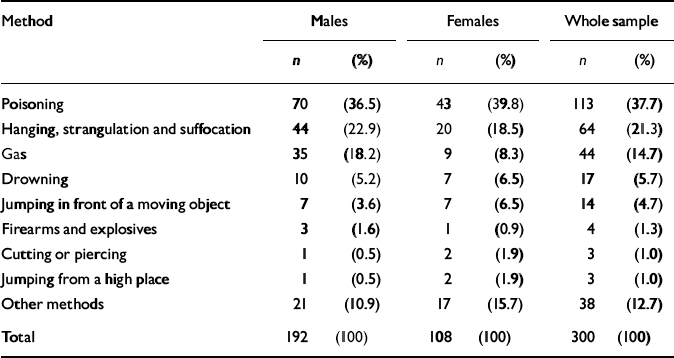
A total of 1187 (10.2%) persons had died by the end of 2000. Three hundred (2.6%) had died by suicide according to our definition. A suicide verdict was recorded for 177 (59.0% of these), an open verdict for 82 (27.3%) and an accidental poisoning verdict for 41 (13.7%). The most frequent method of suicide was self-poisoning, with little difference between the genders in the distribution of this and other methods of suicide (Table 2). The majority, however, had used a method different from that used in the index episode of self-harm, with hanging and gas (usually car exhaust) being the most frequent.
Table 2 Methods of suicide
| Method | Males | Females | Whole sample | |||
|---|---|---|---|---|---|---|
| n | (%) | n | (%) | n | (%) | |
| Poisoning | 70 | (36.5) | 43 | (39.8) | 113 | (37.7) |
| Hanging, strangulation and suffocation | 44 | (22.9) | 20 | (18.5) | 64 | (21.3) |
| Gas | 35 | (18.2) | 9 | (8.3) | 44 | (14.7) |
| Drowning | 10 | (5.2) | 7 | (6.5) | 17 | (5.7) |
| Jumping in front of a moving object | 7 | (3.6) | 7 | (6.5) | 14 | (4.7) |
| Firearms and explosives | 3 | (1.6) | 1 | (0.9) | 4 | (1.3) |
| Cutting or piercing | 1 | (0.5) | 2 | (1.9) | 3 | (1.0) |
| Jumping from a high place | 1 | (0.5) | 2 | (1.9) | 3 | (1.0) |
| Other methods | 21 | (10.9) | 17 | (15.7) | 38 | (12.7) |
| Total | 192 | (100) | 108 | (100) | 300 | (100) |
Effects of gender and age
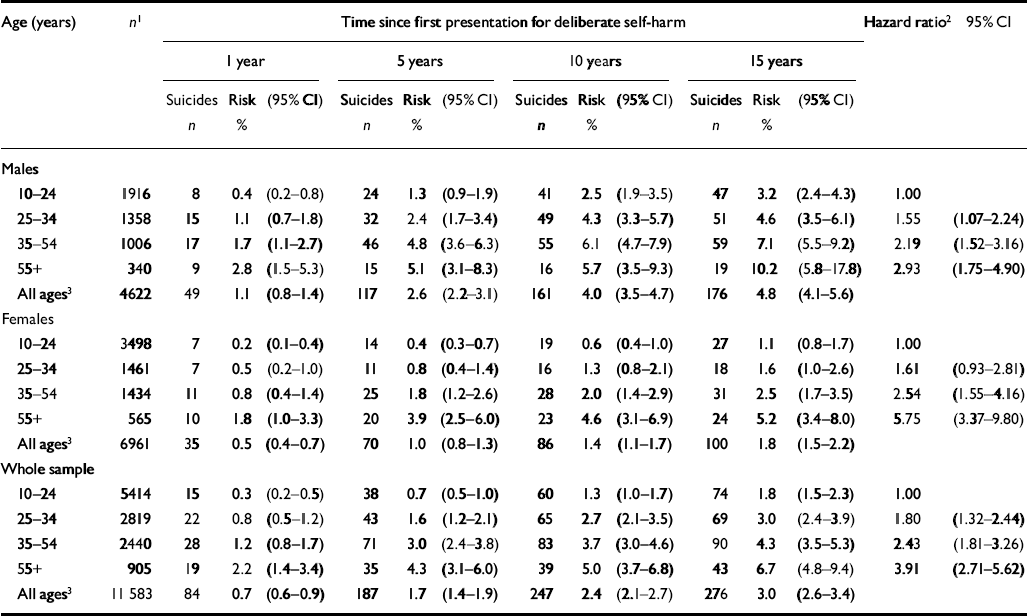
The overall risk of suicide within a year of deliberate self-harm (Table 3) was 0.7% (95% CI 0.6%–0.9%). It was far higher in males (1.1%) than in females (0.5%). The figures for suicides at 5 years and 10 years indicate continuing risk. After 15 years, 3.0% had died by suicide, including 4.8% of men and 1.8% of women. Survival analysis (Fig. 1) shows that the risk of suicide was markedly greater in males than in females throughout the follow-up period (log rank χ2=80.47, d.f.=1, P<0.0001). This remained significant after adjusting for age (log rank χ2=76.53, P<0.0001). A Cox model showed that over the 15-year follow-up period the hazard ratio for males relative to females was 2.8 (95% CI 2.2–3.6). Figure 1 also shows that the risk of suicide in both genders was highest during the period immediately following self-harm.
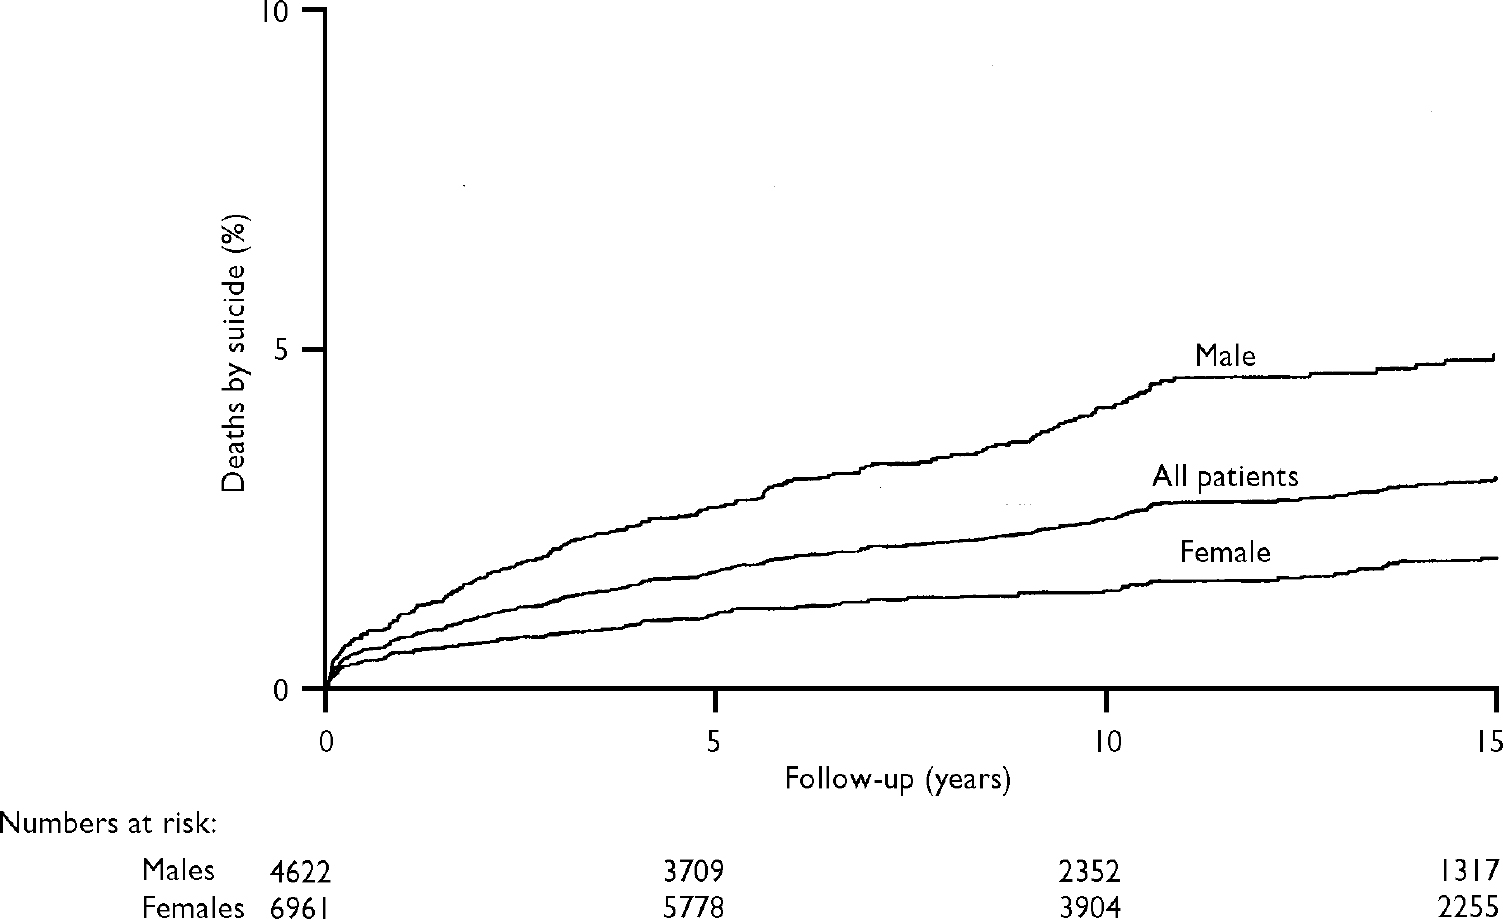
Fig. 1 Cumulative percentages of suicides over the 15-year follow-up period.
Table 3 Risk of suicide (based on Kaplan—Meier estimates) after 1 year, 5 years, 10 years and 15 years of follow-up, and hazard ratios for the total follow-up period
| Age (years) | n 1 | Time since first presentation for deliberate self-harm | Hazard ratio2 | 95% CI | |||||||||||
|---|---|---|---|---|---|---|---|---|---|---|---|---|---|---|---|
| 1 year | 5 years | 10 years | 15 years | ||||||||||||
| Suicides | Risk | (95% CI) | Suicides | Risk | (95% CI) | Suicides | Risk | (95% CI) | Suicides | Risk | (95% CI) | ||||
| n | % | n | % | n | % | n | % | ||||||||
| Males | |||||||||||||||
| 10-24 | 1916 | 8 | 0.4 | (0.2-0.8) | 24 | 1.3 | (0.9-1.9) | 41 | 2.5 | (1.9-3.5) | 47 | 3.2 | (2.4-4.3) | 1.00 | |
| 25-34 | 1358 | 15 | 1.1 | (0.7-1.8) | 32 | 2.4 | (1.7-3.4) | 49 | 4.3 | (3.3-5.7) | 51 | 4.6 | (3.5-6.1) | 1.55 | (1.07-2.24) |
| 35-54 | 1006 | 17 | 1.7 | (1.1-2.7) | 46 | 4.8 | (3.6-6.3) | 55 | 6.1 | (4.7-7.9) | 59 | 7.1 | (5.5-9.2) | 2.19 | (1.52-3.16) |
| 55+ | 340 | 9 | 2.8 | (1.5-5.3) | 15 | 5.1 | (3.1-8.3) | 16 | 5.7 | (3.5-9.3) | 19 | 10.2 | (5.8-17.8) | 2.93 | (1.75-4.90) |
| All ages3 | 4622 | 49 | 1.1 | (0.8-1.4) | 117 | 2.6 | (2.2-3.1) | 161 | 4.0 | (3.5-4.7) | 176 | 4.8 | (4.1-5.6) | ||
| Females | |||||||||||||||
| 10-24 | 3498 | 7 | 0.2 | (0.1-0.4) | 14 | 0.4 | (0.3-0.7) | 19 | 0.6 | (0.4-1.0) | 27 | 1.1 | (0.8-1.7) | 1.00 | |
| 25-34 | 1461 | 7 | 0.5 | (0.2-1.0) | 11 | 0.8 | (0.4-1.4) | 16 | 1.3 | (0.8-2.1) | 18 | 1.6 | (1.0-2.6) | 1.61 | (0.93-2.81) |
| 35-54 | 1434 | 11 | 0.8 | (0.4-1.4) | 25 | 1.8 | (1.2-2.6) | 28 | 2.0 | (1.4-2.9) | 31 | 2.5 | (1.7-3.5) | 2.54 | (1.55-4.16) |
| 55+ | 565 | 10 | 1.8 | (1.0-3.3) | 20 | 3.9 | (2.5-6.0) | 23 | 4.6 | (3.1-6.9) | 24 | 5.2 | (3.4-8.0) | 5.75 | (3.37-9.80) |
| All ages3 | 6961 | 35 | 0.5 | (0.4-0.7) | 70 | 1.0 | (0.8-1.3) | 86 | 1.4 | (1.1-1.7) | 100 | 1.8 | (1.5-2.2) | ||
| Whole sample | |||||||||||||||
| 10-24 | 5414 | 15 | 0.3 | (0.2-0.5) | 38 | 0.7 | (0.5-1.0) | 60 | 1.3 | (1.0-1.7) | 74 | 1.8 | (1.5-2.3) | 1.00 | |
| 25-34 | 2819 | 22 | 0.8 | (0.5-1.2) | 43 | 1.6 | (1.2-2.1) | 65 | 2.7 | (2.1-3.5) | 69 | 3.0 | (2.4-3.9) | 1.80 | (1.32-2.44) |
| 35-54 | 2440 | 28 | 1.2 | (0.8-1.7) | 71 | 3.0 | (2.4-3.8) | 83 | 3.7 | (3.0-4.6) | 90 | 4.3 | (3.5-5.3) | 2.43 | (1.81-3.26) |
| 55+ | 905 | 19 | 2.2 | (1.4-3.4) | 35 | 4.3 | (3.1-6.0) | 39 | 5.0 | (3.7-6.8) | 43 | 6.7 | (4.8-9.4) | 3.91 | (2.71-5.62) |
| All ages3 | 11 583 | 84 | 0.7 | (0.6-0.9) | 187 | 1.7 | (1.4-1.9) | 247 | 2.4 | (2.1-2.7) | 276 | 3.0 | (2.6-3.4) | ||
In both genders there was a marked escalation in risk of suicide with increasing age at the time of the initial self-harm episode (Table 3). Survival analyses (Figs 2, 3) show that the age differential in risk persisted throughout the follow-up period and was statistically significant for both men (log rank χ2=26.53, P<0.0001) and women (log rank χ2=51.73, P<0.0001). The increased risk with age was particularly marked in women aged 55 years and over. There was no significant interaction between gender and age (likelihood ratio test, χ2=2.71, P=0.1). Thus both male gender and increasing age appear to be independent risk factors.
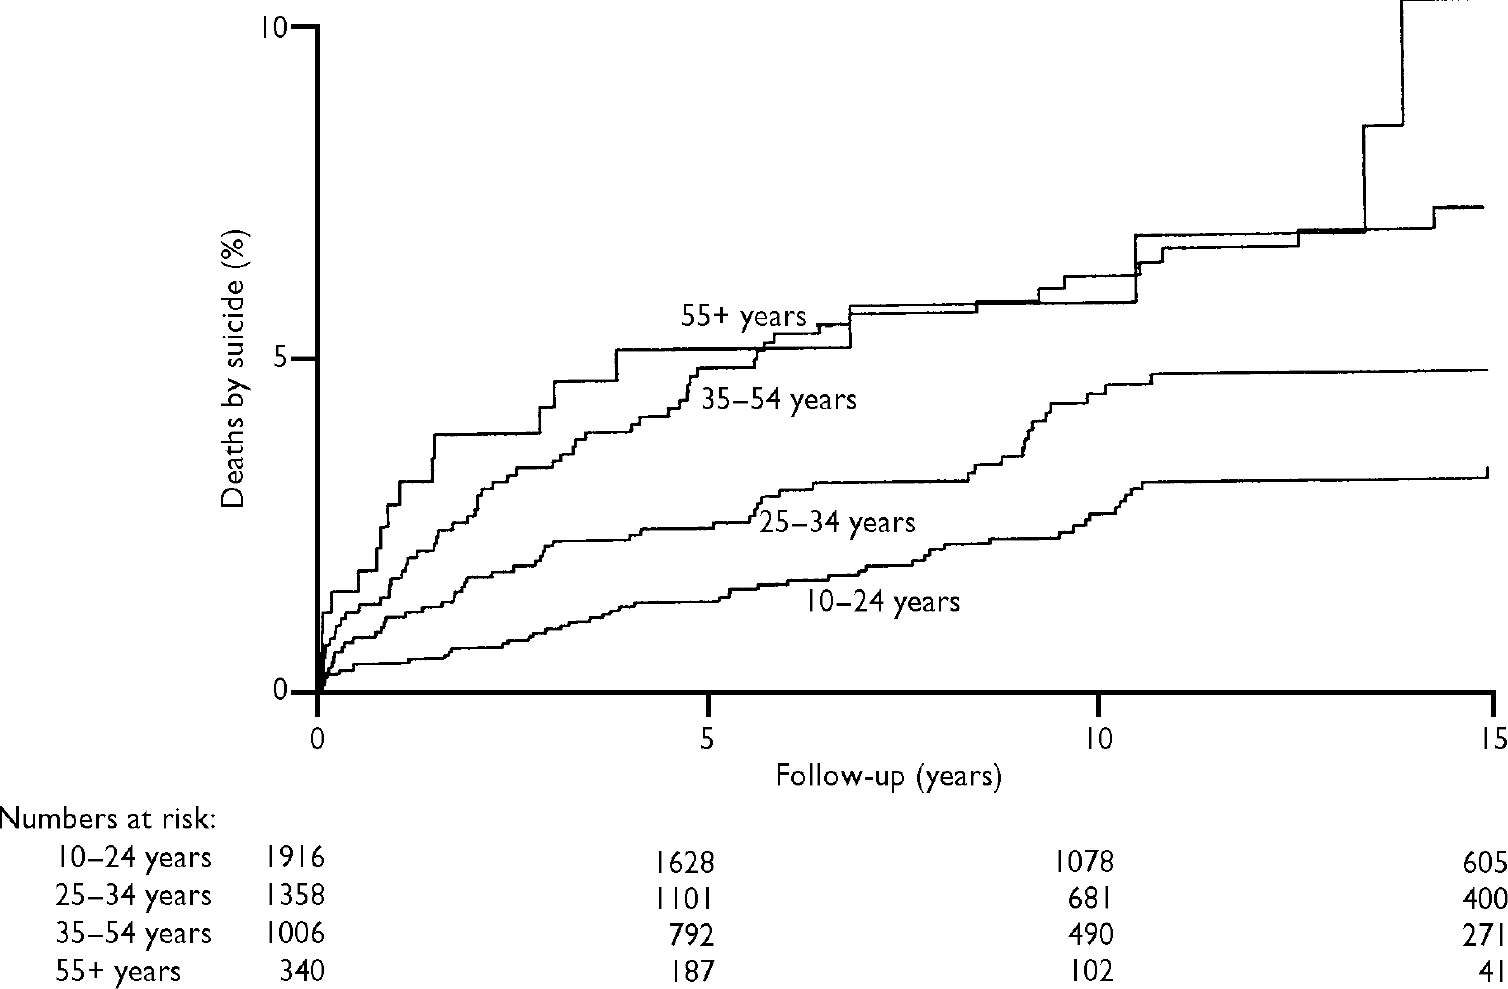
Fig. 2 Cumulative percentages of suicides over time in males, categorised by age group.
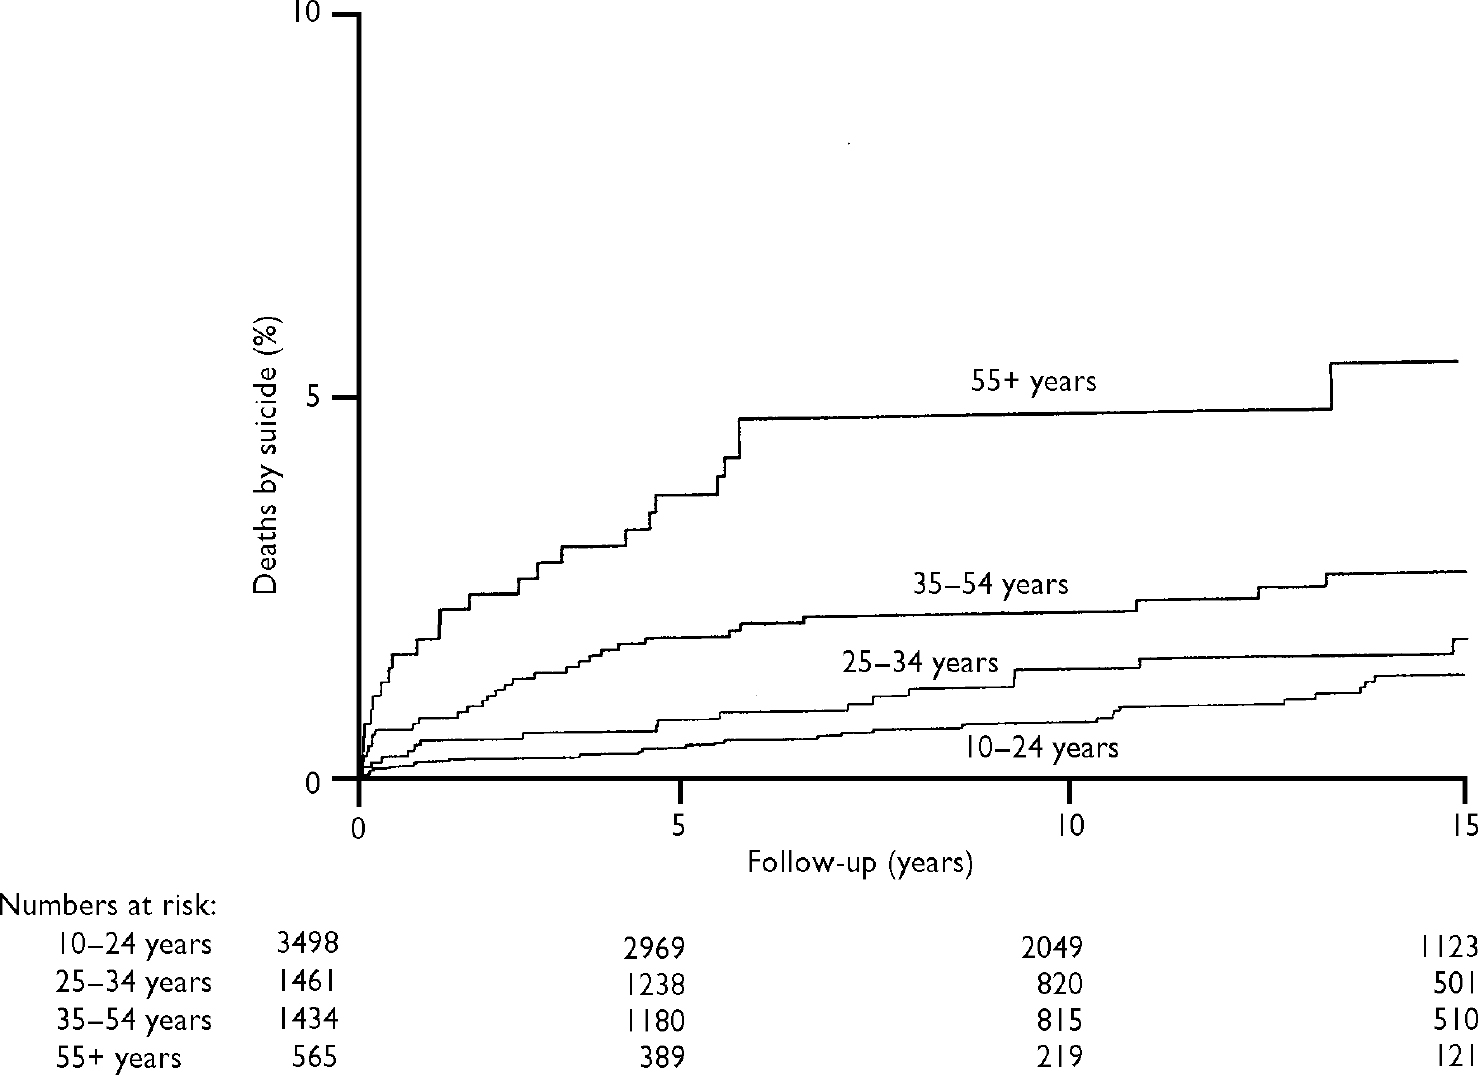
Fig. 3 Cumulative percentages of suicides over time in females, categorised by age group.
Risk and time period
We compared the risk of suicide during the follow-up period for patients who first presented during each of four 5-year periods (1978–1982, 1983–1987, 1988–1992, 1993–1997). There was little difference in risk (log rank χ2=1.08, P=0.78), indicating no major change in risk during the 20-year study period.
Risk of suicide in first year following deliberate self-harm
The overall age-standardised risk of suicide in the first year after self-harm was 66 (95% CI 52–82) times the annual risk of suicide in the general population of England and Wales during the study period (based on averaging rates for 1978, 1988 and 1998). In males it was 64 (95% CI 46–85) times the general population risk and in females it was 90 (95% CI 62–126) times the risk. The relative risk increased with age. In those aged 10–24 years at initial presentation the risk was 35 (95% CI 16–79) times the population risk in males and 75 (95% CI 35–157) times the risk in females, whereas in those aged 55 years and over the comparable figures were 131 (95% CI 68–252) for men and 158 (95% CI 85–294) for women.
DISCUSSION
We have examined mortality from suicide over a long follow-up period in a large sample of people presenting for treatment of deliberate self-harm. The results show that the risk of suicide following self-harm is considerable and persists in the long term. It also varies with gender and age. Reduction in this risk must be a core element in national suicide prevention strategies (Department of Health, 2002).
Methodological issues
Follow-up to death or to the end of the follow-up period was possible in 92.6% of cases submitted for tracing. The main reason for failure of follow-up was incomplete or inaccurate information on the individual's name or date of birth. We do not know the impact of this on the results. The untraced patients did not differ markedly from those who were traced with regard to age and gender. There was a significant but small difference between the two groups of patients in the methods of self-harm. The large sample size and high proportion of traced patients mean, however, that this would have had little impact on the results.
The identification of suicides through inclusion of death from undetermined cause and accidental poisonings as well as official suicides is accepted practice in suicide research (Reference Charlton, Kelly and DunnellCharlton et al, 1992). Few deaths will be misidentified by this procedure (Reference Linsley, Schapira and KellyLinsley et al, 2001). However, some suicides may be missed owing to their inclusion in other categories (e.g. lone driver road traffic accidents).
Risk of suicide compared with other studies
The risk of suicide in the first year following deliberate self-harm (0.7%) was somewhat lower than the 1% reported in an earlier study from the UK (Reference Hawton and FaggHawton & Fagg, 1988). One reason is that in our study we used survival analysis; using an analysis comparable to that of the earlier study, the risk would be 0.8%. Because of the much larger size of our study, the revised figure might be more accurate. Other possible explanations for the difference include changes in the characteristics of the self-harm population and improvements in clinical services.
The risk in the first year after self-harm was 66 times the annual risk of suicide in England and Wales, confirming the large degree of excess risk of suicide in these patients. Although risk of suicide is highest in the initial period following self-harm there is clearly a significant risk even many years later. The proportion of the sample dying from suicide following self-harm is lower than in many studies from other countries (Reference RygnestadRygnestad, 1988; Reference Suokas and LönnqvistSuokas & Lönnqvist, 1991; Reference Nordentoft, Breum and MunchNordentoft et al, 1993; Reference Sakinofsky, Hawton and Van HeeringenSakinofsky, 2000), and this has been confirmed in a recent systematic review (Reference Owens, Horrocks and HouseOwens et al, 2002). This probably reflects differences in the self-harm populations – such patients in the UK include more young people (Reference Schmidtke, Bille Brahe and De LeoSchmidtke et al, 1996), in whom we have shown that the risk is lower – and also differences in general population suicide rates.
Age and gender
In keeping with the findings of most earlier studies (Reference Nordström, Samuelsson and ÅsbergNordström et al, 1995; Reference Sakinofsky, Hawton and Van HeeringenSakinofsky, 2000; Reference Suokas, Suominen and IsometsaSuokas et al, 2001) the risk of suicide was far higher in men than in women throughout the follow-up period. We have shown that the risk increases markedly with age at the time of self-harm. The risk in those aged 55 years and over was seven times greater than in those aged 10–24 years in the first year of follow-up, and nearly that after 5 years. This was reflected in the risk relative to the general population rate in different age groups. This underlines the need for clinicians to be especially vigilant for suicide risk in older people presenting with deliberate self-harm.
Methods of suicide
The methods of suicide used by the people investigated in this study differed somewhat from suicides in general in the UK in that in males self-poisoning was more common. The fact that most of the latter had used self-poisoning in their initial self-harm episodes indicates that persistence with the original method is not uncommon. The majority of suicides, however, involved a method different from that used in the original episode.
Clinical Implications and Limitations
CLINICAL IMPLICATIONS
-
▪ The risk of suicide following deliberate self-harm emphasises the need for greater attention to reducing risk.
-
▪ The continuing risk even many years after deliberate self-harm highlights the need to take account of any previous episode in assessing risk.
-
▪ The increased risk in older people underlines the need for clinicians to be especially vigilant for suicide risk in these patients.
LIMITATIONS
-
▪ The study was based on patients presenting to only one general hospital.
-
▪ Not all patients could be traced.
-
▪ Some suicides will have been missed owing to their classification as other types of death.
Acknowledgements
The authors thank the staff of the Office for National Statistics for England and Wales, the General Register Office for Scotland and the Central Services Agency in Northern Ireland for their assistance with this project, and Douglas Altman for commenting on the manuscript. Staff at the Department of Psychological Medicine at the John Radcliffe Hospital in Oxford, and Elizabeth Bale and Alison Bond, assisted with original identification of the patients included in the study. The study was funded by a grant from the National Health Service Executive for England; K.H. is also funded by Oxfordshire Mental Healthcare Trust.


eLetters
No eLetters have been published for this article.