

Over the last two decades, economists and political decision makers have increasingly raised questions related to the set of indicators they relied upon to measure economic performance and social progress. In particular, “[…] the notion of sustainable development has expanded to become an encompassing concept absorbing all dimensions of present and future economic, social and environmental well-being.” (Stiglitz et al. Reference Stiglitz, Sen and Fitoussi2009, 57). Clearly, environmental conditions are part of the determinants of people's quality of life. Indeed, the idea of “greening” national accounts has been around for about two decades (e.g., Hamilton, Reference Hamilton1994). Nonetheless, many issues remain unresolved in the actual integration of environmental goods and services in measures of economic development, which starts with national accounts (World Bank, 2010). As identified by Stiglitz et al. (Reference Stiglitz, Sen and Fitoussi2009), the interactions between the sustainable use of natural resources, human well-being and development must be explicitly accounted. The concept of planetary boundaries, developed and described by Rockström et al. (Reference Rockström, Steffen, Noone, Persson, Chapin, Lambin, Lenton, Scheffer, Folke, Schellnhuber, Nykvist, de Wit, Hughes, van der Leeuw, Rodhe, Sörlin, Snyder, Costanza, Svedin, Falkenmark, Karlberg, Corell, Fabry, Hansen, Walker, Liverman, Richardson, Crutzen and Foley2009), seems promising in that respect. However, as apparent in the literature reviewed below, in economic studies investigating the issue of the (sustainable) use of natural resource, particularly at household level, the notion of utility fails to account for what Stiglitz et al. (Reference Stiglitz, Sen and Fitoussi2009) name “[…] social and environmental well-being […].”
One way to describe the interactions between sustainability, human well-being and development in a household model of natural resource use is to explore trade-offs between the household's “love of nature” and its current period consumption of use benefits, as preserving nature inevitably implies to forego the consumption of certain benefits (e.g., firewood, groundwater,…). Krautkraemer (Reference Krautkraemer1985) considered the impact of amenity values (i.e., the “love of nature”), whose flow depend on the remaining stock of natural environment, on the optimal growth of a (nonrenewable) resource dependent economy. He shows that under certain conditions, a long term preservation of the environment can be optimal and depends on the initial endowments of capital and natural resource stocks. To the best of our knowledge, such an approach at the household level, where most effective resource use decisions are taken, is not covered in the literature. Pfaff et al. (Reference Pfaff, Chaudhuri and Nye2004) investigate the relationship between environmental degradation and poverty (the Environmental Kuznets Curve) with an analytical household utility model with consumption and amenity values. In their model households are pure consumers and the amenity value is derived from pure public goods.
Other studies investigate the relation between household or individual utility, poverty and the use of the natural resource base. In particular, Bulte and van Soest (Reference Bulte and van Soest1999, Reference Bulte and van Soest2001) and Barbier (Reference Barbier2010) model and investigate the impact of imperfect factor markets on the allocation of time (or labor) to resource depletive and nondepletive activities. Anthon et al. (Reference Anthon, Lund and Helles2008) assess the impact of a tax on forest products on the depletive use of forests, using a similar approach of time allocation.
All these models consider household utility as a function of the consumption of market goods and leisure, as well as own-production in the case of Barbier (Reference Barbier2010). Similar to Krautkraemer (Reference Krautkraemer1985), market consumption depends here (through an income constraint) on the resource stock. Yet Krautkraemer (Reference Krautkraemer1985) adds the amenity value of the resource stock as a direct determinant of the utility. Considering alternative activities or different consumption choices, whose utility does not depend on the resource stock, misses a crucial trade-off in the households’ optimization problem: depleting the resource stock impacts not only on the future income from resource-based activities (and this can increase or decrease income in a given period, depending on prices), but can be strictly utility decreasing. The love of nature takes a central role in the lifestyle and livelihoods of people and communities who are closely connected to the environment. Hence, modeling their behavior entails the direct incorporation of nature/environment in their utility function. For instance, such bonds can extend beyond typical benefits (wild foods, fresh water, raw materials, energy, medicine,…) to include more “psychological” benefits in the form of cultural and spiritual values (Balmford et al. Reference Balmford, Rodrigues, Walpole, Brink, Kettunen and Braat2008).
Following a similar approach to Bulte and van Soest (Reference Bulte and van Soest2001), we present here an intertemporal model, with particular focus on the case of “economically isolated” communities depending on the natural resource base for their livelihoods. The economic isolation does not preclude the access to market goods, but crucially restricts the translation of surplus from natural resource exploitation into physical capital accumulation. Therefore, the total value of production and consumption, which includes utility drawn from their love of nature, are balanced in each period.
In the model, the households maximize the net present value of their own utility, which depends on the consumption of different types of goods. We categorize the goods as cash goods (rice, tinned fish, alcohol, etc.), bought on the distant markets, and traditional goods produced by the household itself. The latter are similar to the own production of farm households, with the exception that the goods can only be consumed by the household itself (i.e., no surplus sold on the market). However, in our model the stock of natural resource also enters directly the utility function, reflecting the idea of the “love of nature” and expanding the notion of well-being to social and environmental dimensions. Unlike Pfaff et al. (2008), this “amenity value” is not derived from the consumption of a public good and instead its value is directly related to the actions of the households. Further, the only option the households have to gain cash, and thus to consume market goods, is to extract forest products and sell them to exporting companies or their agents. This activity has two effects: it depletes the stock of forest resources and it consumes labor resources which otherwise could be allocated to traditional, nondepletive activities (e.g., pig hunting, fishing, and collecting fruits). Unlike Bulte and van Soest (Reference Bulte and van Soest2001), our producers only possessed their own labor at their disposal.
We analyze the model in terms of its equilibrium conditions and the impacts of price on the control and state variables (consumption and stock of forest) around the equilibrium, using comparative statics. The main findings of the paper are that in this setting, a decrease in price paid to the producers can induce a change in consumption choices as the marginal utility of marketed goods relative to the marginal utility of traditional goods decreases. Through a supply response mechanism, this can further lead to a decrease in resource extraction. The result, however, depends on the state of the resource stock. Hence, the case of a poverty-environmental degradation trap as described in Barbier (Reference Barbier2010), resulting from a combination of poor access to capital and input markets and constrained income opportunities, will not necessarily unfold.
As suggested in the above, our model is generic to communities depending on natural resources and their own labor as their only assets. The model is specific in its treatment of the forest stock as a generic case of nonrenewable resource: as many of the communities’ activities (including harvesting the forest product being traded) depend on the fact that this is an old-growth forest, nonrenewable over a generation's planning horizon and beyond. Indeed, we illustrate our model using the case of forest communities in the northwestern provinces of Papua New Guinea (PNG). Without loss of generality, we introduce specific elements of market structure and pricing mechanisms to link the model with relevant policy elements. Traditionally hunters and gatherers, the communities of northwestern PNG have since the late 1990s benefited from the discovery of Eaglewood, a rare and valuable nontimber forest product. The discovery of Eaglewood in the region has opened up economic prospects for these communities, who until then were largely disconnected from any market.
Finally, we calibrate a simulation model based on data gathered during field work in 2002 and various data sets and literature gathered since. The simulations help us to understand the paths of key variables away from equilibrium and the direction of comparative effects (stock effects on production and utility, substitution and income effects in consumption patterns), thus enabling us to draw further conclusions on the environmental and well-being affects of price signals.
In the next section, we describe the particular setting in which we use our model, i.e., the production of Eaglewood in PNG. We describe the production process, the basic household economics and the structure of the Eaglewood trade in PNG. In Section 3 we present the model, its objectives and assumptions, as well as its theoretical analysis. Section 4 details the theoretical affects of price distortions on the resource owners’ consumption patterns, and thus implicitly on the extraction rate of the natural resource. These results are supplemented by a closer look at the paths of key variables produced by a simulation model in Section 5. Finally, Section 6 concludes.
The Setting: The Eaglewood Trade in PNG
Eaglewood, or agarwood, is commonly known as gaharu in PNG. It is a heavy, resinous wood product resulting from the fungal contamination (mold) of specific species of trees in the Aquilaria and Gyrinops genera. Due to their rather small size, these trees hold no market value as timber. Eaglewood is a highly valuable product, traded and sold on markets in Southeast Asia, Hong Kong, and the Middle East in particular. Eaglewood and its derived products (e.g., Eaglewood oil) are treasured for their fragrance, used either as a luxury ambiance perfume or in religious ceremonies and traditional medicine. The size and shape of the hard resinous wood pieces also play a role in the price they command.Footnote 1 There is no consumption market for gaharu in PNG, which exports all of its production.
The extraction of gaharu in PNG only started in the late 1990s, as it was unknown to locals, and international traders were unaware of its existence under these longitudes. Gaharu is mostly found in the remote, often mountainous forests of PNG. Its extraction requires considerable effort: the producers leave one of their settlements for a few weeks at a time,Footnote 2 making their way through thick forest until they find potential host trees. The process of extraction itself is guided by the few external signs associated with a good probability of finding gaharu inside the tree. Most of the time, the segment of the tree thought to be infected cannot be removed without cutting down the whole tree. This practice is not sustainable, decreases the prospect of future gaharu stocks and implies substantial damage to the forest directly around the tree. Yet for practical reasons, it is often not avoidable. Once the tree has been extracted, the gaharu is harvested by carving it out of the flesh of the tree. Pieces of gaharu typically weigh between a few grams to a few hundred grams; in rare cases it can go up to a couple of kilograms. The processing of gaharu does not take place in PNG (e.g., oil extraction, and sculptures), the resinous wood is sold soon to avoid any weight loss due to evaporation.
For the communities engaged in the extraction of gaharu in PNG, this represents a unique chance for cash income. During group interviews in seven villages of the East Sepik and Sandaun provinces, it was clearly expressed that income levels have risen significantly in those villages since the start of the gaharu trade. By 2003, this trade accounted for 70 percent up to 100 percent of their cash income.Footnote 3
The market structure of gaharu trade in PNG is characterized by a large number of producers (hundreds of families harvest gaharu), whilst official records of exports show that only two export companies operated simultaneously (a third one was operating briefly in the early stages). Information about the quality of the gaharu, which can only be assessed post extraction, is strongly biased in favor of the traders: they have access to the international market, know how different characteristics besides oil content (approximated by density and weight) can affect prices and are the sole source of information for the forest owners. Between producers and traders in PNG, gaharu is priced per kilogram according to quality grades: Super-A, A, B, C and D.Footnote 4
The gaharu trade in PNG remained unregulated until early 2002, when the government introduced a 10% ad valorem export tax. Based on the short time series at our disposal, which shows the total quantity and value of exports from PNG between 1999 and 2008, as well as the detailed export permits collected between 2002 and 2004, we observe a change in the composition of exports towards increased quantities of lesser grades and decreased quantities of higher grades (Figure 1). As higher grades command prices several orders of magnitude higher and no one except the traders can attest of the exact grade, this is hardly surprising. From a developmental and natural resource perspective, this tax evasion has implications for the producers: in offering lower grade prices for higher grade products, traders impact on the producers’ supply and utility functions, as well as on the natural resource stock. We aim to capture such interactions and impacts in our model in the next section.

Figure 1. Gaharu Exports in PNG, 1999–2008
The Model
The objective of the model is to show how the direct utility of the stock of nature and depletive natural resource use can be balanced through the consumption choices of natural resource dependent communities. We illustrate and guide our model development based on our experience of the gaharu extraction and trade in PNG.
Without loss of generality, we simplify the setting by considering two grades for gaharu: high and low. They command prices ph and pl , respectively. We assume that gaharu, given its growth dependence on the natural conditions prevailing in an old-growth forest in PNG, is a nonrenewable resource over the people's planning horizon.Footnote 5 Further, there is no opportunity to transform surpluses from natural resource use into capital, and their consumption expenditures are met through the revenue of gaharu sales in each period. The proportion of high-quality gaharu present in the forest is fixed and unobserved pre-harvest, and therefore dependent on the proportion of high-quality gaharu in the whole harvest. Finally, we assume that the decrease in the stock of old-growth forest mainly occurs from harvesting gaharu. The harvest of gaharu has a compound effect on the stock of forest, as the process entails the extraction of multiple surrounding trees.
The buyer, which we describe as a monopsonist, can “cheat” and purchase some of the high quality at the low price.Footnote 6
The proportion of high quality in the forest (and in the extracted gaharu) is π, the proportion of low quality is 1 − π (0⩽π⩽1). The share of the high-quality harvest that the monopsonist purchases at p l is α, the share of high quality harvest that he purchases at p h is 1 − α (0⩽α⩽1). Given the total harvest q, (1 − α)πq is the share of the total harvest that is purchased at high price, (απ + (1 − π))q is the share purchased at low price.Footnote 7
The producer's objective function is:
 $$\max U = \int\limits_0^\infty {u\lpar x\lpar t\rpar \comma \; c\lpar t\rpar \comma \; s\lpar t\rpar \rpar e^{ - rt} dt\comma \; } $$
with N identical producers, each owning an identical share of the total resource privately, thus internalizing the effects of resource extraction on his or her share of the stock.Footnote 8 Consumption enters the utility function as the consumption levels of two distinct classes of goods: the cash goods (c) can be bought on the market away from the village, and the traditional goods (x) are produced/exchanged or in any other way procured by undertaking traditional activities in and around the community. The different characteristics of these two groups of goods justify the need to keep them separate in the utility function, and emphasize the importance of traditional activities and goods to the local populations (e.g., the production of masks, of sago palm cake, or of “bush meat”). Substitution between the two classes of goods is calculated through the allocation of labor.Footnote 9 Capital is absent from the objective function and from the rest of the model, because the producers have no means of substitution between capitals due to the “primitive” nature of the economy; everything in the model is determined by labor allocation, which is in turn is determined by the actions of the monopsonist.
The objective function is subject to the equation of motion of the state variable (stock),
 $$\dot s = - mq(t),$$
with q(t) the harvest in period t and m the strictly positive constant, denoting the impact on the stock of forest per harvested kilogram of gaharu. As mentioned above, gaharu grows in old-growth forests. Its growth rate, like the natural growth rate of the old-growth forest, is considered to be nil over the lifetime of the producers. Therefore, the stock of the forest is only a function of the harvest of gaharu (Conrad, Reference Conrad1999, Chap. 4.6).
The producers have a choice variable, the level of consumption of traditional goods, x, which is a vector of nonmarketed goods (including their leisure time), and a control variable, c, which represents their consumption vector of all marketed goods. As the only source of income available to the producer is the sale of gaharu, the total value of the marketed goods consumed in each period is constrained by the total value of gaharu sales in the same period. Thus,
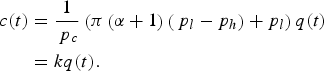 $$\eqalign {c(t) &= \displaystyle{1 \over {\,p_c}}\left( {\pi \left( {\alpha + 1} \right)\left( {\,p_l - p_h} \right) + p_l} \right)q(t) \cr &= kq(t).}$$
So the budget constraint above provides the link between the resource extraction and the consumption of cash goods.Footnote 10 As we have one cash good (or class of goods, c(t)), its consumption is equal to a fixed proportion of the harvest, this proportion being a price ratio of the goods consumed and of the goods produced (qualities of gaharu). Naturally, the harvest function is also a function of the stock of the resource, q(t) = q(s(t)), so that c(t) is an indirect function of the stock level. Production and consumption must be balanced in each period (as in Bulte and van Soest, Reference Bulte and van Soest2001), because the goods x are not marketable, and the income derived from the production of c is not invested, but consumed. For this particular case of gaharu in PNG, this follows anecdotal evidence collected in the fieldFootnote 11 and further assumes that no cash resulting from the sale of gaharu is kept for future consumption.
By determining the amount of cash and traditional consumption, the producer determines the level of labor he invests into collecting gaharu or into traditional activities. The total labor (or time, or effort) available to the producer in each period, l(t), is normalized to 1. Thus the substitution between x and c is constrained by the effort function:
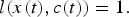 $$l(x(t),c(t)) = 1.$$
The current value Hamiltonian for the optimal control problem of the producer isFootnote 12
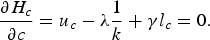
 $$H_c\left( {x,c,s,\lambda ,\gamma ;\alpha } \right) = u\left( {x,c,s} \right) + \lambda \left[ { - \displaystyle{1 \over k}c} \right] + \gamma \left[ {l(x,c) - 1} \right].$$
The optimal conditions are:
-
1. x(t) and c(t) maximize H c (x, c, s, λ, γ;α) for all t, so
 $$\displaystyle{{\partial H_c} \over {\partial x}} = 0$$
and
$$\displaystyle{{\partial H_c} \over {\partial c}} = 0$$
,
$$\displaystyle{{\partial H_c} \over {\partial x}} = 0$$
and
$$\displaystyle{{\partial H_c} \over {\partial c}} = 0$$
, -
2.
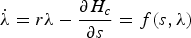
$\dot \lambda = r\lambda - \displaystyle{{\partial H_c} \over {\partial s}} = f(s,\lambda )$
, -
3.
$\dot s = - q(t)$
, -
4.
$s(0) = s_0$
, and -
5.
$\mathop {lim}\limits_{t \to \infty} \lambda (t)e^{ - rt} = 0$
.


Solving condition 1.:
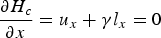 $$\displaystyle{{\partial H_c} \over {\partial x}} = u_x + \gamma l_x = 0$$
and
 $$\displaystyle{{\partial H_c} \over {\partial c}} = u_c - \lambda \displaystyle{1 \over k} + \gamma l_c = 0.$$
Solving condition 2.:
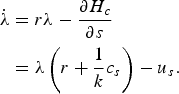 $$\eqalign{\dot \lambda &= r\lambda - \displaystyle{{\partial H_c} \over {\partial s}} \cr & = \lambda \left( {r + \displaystyle{1 \over k}c_s} \right) - u_s.} $$
Combining equations 3 and 4 to eliminate γ, and isolating λ, we get
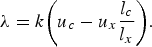 $$\lambda = k\bigg({u_c - u_x \displaystyle{{l_c} \over {l_x}}}\bigg).$$
As l c is the increase in effort requirement caused by a marginal increase in the consumption of c (and similarly for x), l c /l x is the marginal rate of effort substitution (MRS), i.e., the rate at which effort is transferred from harvesting gaharu to undertaking traditional activities when a marginal quantity of x is substituted for a marginal quantity of c.
Differentiating equation 4 with respect to time gives
 $$u_{cc} \dot c - \dot \lambda \displaystyle{1 \over k} = 0.$$
Isolating
 $\dot \lambda$
and equating to equation 5 leads to, after substituting λ by equation 6,
$\dot \lambda$
and equating to equation 5 leads to, after substituting λ by equation 6,
 $$ku_{cc}\dot c = \left( {u_c - u_xMRS} \right)\left( {r + \displaystyle{1 \over k}c_s} \right)k - u_s.$$
From this equation, we derive that
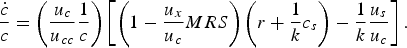 $$\displaystyle{{\dot c} \over c} = \left( {\displaystyle{{u_c} \over {u_{cc}}}\displaystyle{1 \over c}} \right)\left[ {\left( {1 - \displaystyle{{u_x} \over {u_c}}MRS} \right)\left( {r + \displaystyle{1 \over k}c_s} \right) - \displaystyle{1 \over k}\displaystyle{{u_s} \over {u_c}}} \right].$$
In order to have some intuitive interpretation of this equation, we assume a steady state equilibrium. This leads to
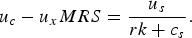 $$u_c - u_x MRS = \displaystyle{{u_s} \over {rk + c_s}}. $$
This equation makes the link between the utility of consumption on the LHS and the stock management arguments on the RHS. It also gives indications on the different dynamics of our problem around the equilibrium. For instance, the RHS is different from zero provided that the producers care about nature (i.e., if u
s
>0). If the producers do not care about nature, then the only capital they can allocate is their labor endowment, and in this case
 $\displaystyle{{u_c} \over {u_x}} = \displaystyle{{l_c} \over {l_x}}$
, meaning that the relative marginal utility of goods x and c is entirely driven by the labor allocation they imply. In the more general case where producers do care about nature: starting from the equilibrium, if the producers increasingly value nature, then the RHS increases (as u
s
increases), and thus
$\displaystyle{{u_c} \over {u_x}} = \displaystyle{{l_c} \over {l_x}}$
, meaning that the relative marginal utility of goods x and c is entirely driven by the labor allocation they imply. In the more general case where producers do care about nature: starting from the equilibrium, if the producers increasingly value nature, then the RHS increases (as u
s
increases), and thus
 $\displaystyle{{u_c} \over {u_x}} \gt \displaystyle{{l_c} \over {l_x}}.$
This in turn means that as the depletive activity is decreased, its marginal utility increases relative to the marginal utility of the nondepletive activity.
$\displaystyle{{u_c} \over {u_x}} \gt \displaystyle{{l_c} \over {l_x}}.$
This in turn means that as the depletive activity is decreased, its marginal utility increases relative to the marginal utility of the nondepletive activity.
Formally, defining η as the constant elasticity of the marginal utility of c with respect to its level of consumption (η<0), and rewriting equation 7, we get the following system of differential equations:
 $$\dot c = \displaystyle{c \over \eta }\left[ {\left( {u_c - u_x{\displaystyle{{l_c} \over {l_x}}}} \right)\left( {rk + c_s} \right) - u_s} \right]\displaystyle{1 \over {ku_c}}$$
 $$\dot s = - \displaystyle{1 \over k}c.$$
We can get the elements of J
E
, the Jacobian matrix of the reduced linearized system (evaluated at the equilibrium). Defining
 $\dot c = f(c,s)$
and
$\dot c = f(c,s)$
and
 $\dot s = g(c,s)$
,
$\dot s = g(c,s)$
,
 $$J_E = \left \vert {\matrix{ {\,f_c} & {\,f_s} \cr {g_c} & {g_s} \cr}} \right \vert. $$
The different elements of the Jacobian are:
 $$f_c = \displaystyle{1 \over \eta }\displaystyle{1 \over {ku_c}}\left[ {\left\{ {\left( {u_c - u_x{\displaystyle{{l_c} \over {l_x}}}} \right)\left( {rk + c_s} \right) - u_s} \right\}\left\{ {1 - \displaystyle{{cu_{cc}} \over {u_c}}} \right\} + cu_{cc}\left( {rk + c_s} \right)} \right]$$
 $$f_s = \displaystyle{1 \over \eta }\displaystyle{c \over {ku_c}}\left[ {\left( {u_c - u_x{\displaystyle{{l_c} \over {l_x}}}} \right)c_{ss} - u_{ss}} \right]$$
 $$g_c = - \displaystyle{1 \over k}$$
 $$g_s = 0$$
such that the determinant of the Jacobian is
 $$\left\vert {J_E} \right\vert = - \displaystyle{1 \over \eta }\displaystyle{c \over {k^2u_c}}\left[ {\left( {u_c - u_x{\displaystyle{{l_c} \over {l_x}}}} \right)c_{ss} - u_{ss}} \right],$$
while the trace of the Jacobian is trJ E = f c . The sign of the determinant |J E | is ruled by the expression in the square brackets, as the terms outside of them are positive. A negative determinant would ensure the equilibrium is a saddle point, whereas |J E | >0 could yield a stable or unstable equilibrium, depending on the sign of the trace.
The Impacts of Price Distortions
In this section, we investigate the impacts of the monopsonist's distorted price signals (i.e., the “cheating” described earlier) on the producers’ consumption of market goods (i.e., the “developmental” impact).
Looking at the system (9), we start from the equilibrium, where
 $\dot c = 0$
and
$\dot c = 0$
and
 $\dot s = 0$
. This yields the following:
$\dot s = 0$
. This yields the following:
 $$\Big({u_c - u_x {\displaystyle{{l_c} \over {l_x}}}} \Big)\lpar{rk + c_s} \rpar- u_s = 0$$
 $$ - \displaystyle{1 \over k}c = 0.$$
Based on this system we can analyze the variations in consumption and natural resource stock around the equilibrium. We then take the total differential of each of these equations with respect to c, s and α. After rearranging, dividing through by dα and rewriting all remaining differentials as partial derivatives, we can organize the solution in the following matrix form:
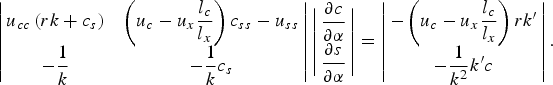 $$\left\vert {\matrix{ {u_{cc}\left( {rk + c_s} \right)} & {\left( {u_c - u_x{\displaystyle{{l_c} \over {l_x}}}} \right)c_{ss} - u_{ss}} \cr { - \displaystyle{1 \over k}} & { - \displaystyle{1 \over k}c_s} \cr } } \right\vert\left\vert {\matrix{ {\displaystyle{{\partial c} \over {\partial \alpha }}} \cr {\displaystyle{{\partial s} \over {\partial \alpha }}} \cr } } \right\vert = \left\vert {\matrix{ { - \left( {u_c - u_x{\displaystyle{{l_c} \over {l_x}}}} \right)rk^{\prime}} \cr { - \displaystyle{1 \over {k^2}}k^{\prime}c} \cr } } \right\vert.$$
We will then apply Cramer's rule to calculate the comparative static impacts of α on the extraction (through the impact on consumption c) and the stock. To that effect, we first calculate the determinant of M E , the Jacobian matrix of the system (evaluated at the equilibrium):
 $$\left\vert {M_E} \right\vert = - u_{cc}\left( {rk + c_s} \right)\displaystyle{1 \over k}c_s + \displaystyle{1 \over k}\left[ {\left( {u_c - u_x{\displaystyle{{l_c} \over {l_x}}}} \right)c_{ss} - u_{ss}} \right].$$
The sign of the determinant |M E | must be negative to ensure concavity and thus a maximum. This determines that the expression in the square brackets must be negative, a result which will be useful later on. Applying Cramer's rule, we get:
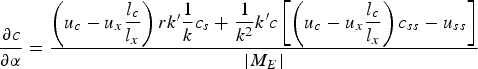 $$\displaystyle{{\partial c} \over {\partial \alpha }} = \displaystyle{{\left( {u_c - u_x{\displaystyle{{l_c} \over {l_x}}}} \right)rk^{{\prime} }\displaystyle{1 \over k}c_s + \displaystyle{1 \over {k^2}}k^{\prime}c\left[ {\left( {u_c - u_x{\displaystyle{{l_c} \over {l_x}}}} \right)c_{ss} - u_{ss}} \right]} \over {\left\vert {M_E} \right\vert}}$$
Assuming a saddle point, and remembering that |M
E
| <0, we can see the following. As the second term of the numerator contains c it should dominate the first term of the numerator, which is negative, so that
 $\displaystyle{{\partial c} \over {\partial \alpha }} \lt 0:$
for stock levels below a critical value
$\displaystyle{{\partial c} \over {\partial \alpha }} \lt 0:$
for stock levels below a critical value
 $\bar S$
, the absolute value of the square brackets (which is determined by the second derivatives of c and u with respect to stock) is high enough so that in combination with the consumption level they dominate the numerator. If such is the case, an increase in the proportion of high-value gaharu paid at the low-grade price (α) leads to a reduction in the consumption level, through a decrease in the production of gaharu. For high values of the stock, i.e.,
$\bar S$
, the absolute value of the square brackets (which is determined by the second derivatives of c and u with respect to stock) is high enough so that in combination with the consumption level they dominate the numerator. If such is the case, an increase in the proportion of high-value gaharu paid at the low-grade price (α) leads to a reduction in the consumption level, through a decrease in the production of gaharu. For high values of the stock, i.e.,
 $s \gt \bar S$
, the second term of the numerator becomes very small (eventually tends to zero) as the second order derivatives c
ss
and u
ss
tend to zero themselves as s → ∞. Thus, for
$s \gt \bar S$
, the second term of the numerator becomes very small (eventually tends to zero) as the second order derivatives c
ss
and u
ss
tend to zero themselves as s → ∞. Thus, for
 $s \gt \bar S$
the first term in the numerator dominates and
$s \gt \bar S$
the first term in the numerator dominates and
 $\displaystyle{{\partial c} \over {\partial \alpha }} \gt 0$
.
$\displaystyle{{\partial c} \over {\partial \alpha }} \gt 0$
.
Intuitively, these two results can be interpreted as follows: at stock levels below a critical stock
 $\bar S$
, the opportunity cost of extracting more resource in terms of x and in terms of the producers’ “love of nature” is prohibitively high (higher than the marginal benefit of increasing consumption c) and the producers substitute x for c, thus decreasing extraction. The “substitution effect” is stronger than the “income effect.” When the stock is sufficiently high, i.e., higher than
$\bar S$
, the opportunity cost of extracting more resource in terms of x and in terms of the producers’ “love of nature” is prohibitively high (higher than the marginal benefit of increasing consumption c) and the producers substitute x for c, thus decreasing extraction. The “substitution effect” is stronger than the “income effect.” When the stock is sufficiently high, i.e., higher than
 $$\bar S$$
, the inverse is true: as the opportunity cost of increasing extraction is low in terms of forest stock, more gaharu is extracted to compensate the lower prices, i.e., the “income effect” dominates the “substitution effect.”Footnote
13
$$\bar S$$
, the inverse is true: as the opportunity cost of increasing extraction is low in terms of forest stock, more gaharu is extracted to compensate the lower prices, i.e., the “income effect” dominates the “substitution effect.”Footnote
13
To formalize this discussion, we look into the impact of the stock s on
 $\displaystyle{{\partial c} \over {\partial \alpha }}$
. Renaming the numerator in equation 12 as A,
$\displaystyle{{\partial c} \over {\partial \alpha }}$
. Renaming the numerator in equation 12 as A,
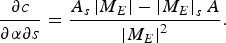 $$\displaystyle{{\partial c} \over {\partial \alpha \partial s}} = \displaystyle{{A_s \left \vert {M_E} \right \vert - \left \vert {M_E} \right \vert _s A} \over {\left \vert {M_E} \right \vert ^2}}. $$
The sign of this expression is determined by the numerator, as the denominator is by definition positive. Hence, we compute (keeping in mind that cross derivatives are all zero and further assuming that third level derivatives are also zero)
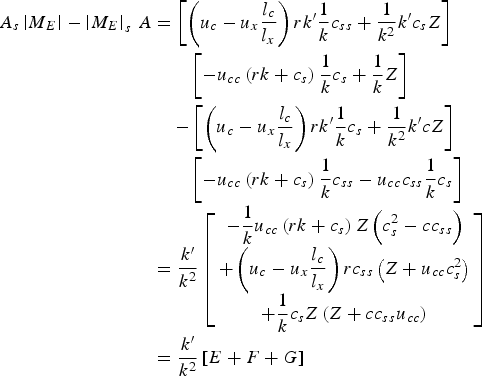 $$\eqalign{A_s\left \vert {M_E} \right \vert - \left\vert {M_E} \right\vert_s\,A &= \left[ {\left( {u_c - u_x{\displaystyle{{l_c} \over {l_x}}}} \right)rk^{{\prime} }\displaystyle{1 \over k}c_{ss} + \displaystyle{1 \over {k^2}}k^{\prime}c_sZ} \right]\cr &\qquad \left[ { - u_{cc}\left( {rk + c_s} \right)\displaystyle{1 \over k}c_s + \displaystyle{1 \over k}Z} \right] \cr &\quad- \left[ {\left( {u_c - u_x{\displaystyle{{l_c} \over {l_x}}}} \right)rk^{{\prime} }\displaystyle{1 \over k}c_s + \displaystyle{1 \over {k^2}}k^{\prime}cZ} \right]\cr &\qquad \left[ { - u_{cc}\left( {rk + c_s} \right)\displaystyle{1 \over k}c_{ss} - u_{cc}c_{ss}\displaystyle{1 \over k}c_s} \right] \cr&= \displaystyle{{k^{\prime}} \over {k^2}}\left[ {\matrix{ { - \displaystyle{1 \over k}u_{cc}\left( {rk + c_s} \right)Z\left( {c_s^2 - cc_{ss}} \right) } \cr {+ \left( {u_c - u_x{\displaystyle{{l_c} \over {l_x}}}} \right)rc_{ss}\left( {Z + u_{cc}c_s^2 } \right)} \cr {+ \displaystyle{1 \over k}c_sZ\left( {Z + cc_{ss}u_{cc}} \right)} \cr } } \right] \cr &= \displaystyle{{k^{\prime}} \over {k^2}}\left[ {E + F + G} \right]}$$
The term E is negative, F is positive, while G is negative (applying the logic that terms with c dominate terms counting only first and second order derivatives). As k′ is negative, and applying the same logic (dominance of the magnitude of c over derivatives of c and u, i.e., the dominance of E + G over F), we find that
 $$\displaystyle{{\partial c} \over {\partial \alpha \partial s}} \gt 0$$
. Two cases must be considered separately here:
$$\displaystyle{{\partial c} \over {\partial \alpha \partial s}} \gt 0$$
. Two cases must be considered separately here:
-
•
$\displaystyle{{\partial c} \over {\partial \alpha }} \lt 0$
: in this case (
$s \lt \bar S$
), a marginal increase in the stock level leading to an increase in
$\displaystyle{{\partial c} \over {\partial \alpha }}$
is interpreted as the negative relationship between c and α becoming less strong. -
•
$\displaystyle{{\partial c} \over {\partial \alpha }} \gt 0$
: in this case (
$s \gt \bar S$
), the positive relationship between c and α becomes stronger, producers will harvest increasing amounts of gaharu to compensate for the loss in revenue and to increase their consumption. Nonetheless, as E + F + G → 0 as s → ∞, the impact of a marginal change in stock on
$\displaystyle{{\partial c} \over {\partial \alpha }}$
vanishes (i.e.,
$\displaystyle{{\partial c} \over {\partial \alpha }}$
remains constant). The maximum value by which a marginal change in α can increase c is equal to the sales value of harvesting out the remainder of the stock, which we call
$\bar c$
. Figure 2 gives a graphical interpretation of
$\displaystyle{{\partial c} \over {\partial \alpha \partial s}}$
.
Figure 2. The Relationship Between S and ∂c/∂α


Simulations
In this section, with the help of numerical analysis, we attempt to show how the gaharu producers choose their path of wellbeing in terms of consumption of marketable and nonmarketable goods given different levels of cheating of the buyer. The monopsonist buyer in the model has the ability to deprive the gaharu producers by paying them the price for low quality gaharu to the high quality gaharu harvested by labelling the product wrongly. In the numerical analysis, we have considered three different scenarios with different levels of cheating (high, medium and low), which is defined as the ratio of high quality gaharu the monopsonist purchases as low quality to the total amount of high quality of gaharu actually produced. The harvest of gaharu trees is assumed to follow a Cobb-Douglas production function of stock and labor with its coefficients denoting the output elasticities of labor and stock. We have assumed two different stock effects (high and low), i.e., two different output elasticities of stock, to investigate how stock effects can influence the labor allocation and the consumption of marketable and non -marketable goods.Footnote 14 Further, we assumed different functional forms for the utility function: an additively separable utility function and a “Cobb-Douglas” type of utility function, but we kept the parameter values constant across the different forms.Footnote 15 Naturally, the two functional forms have different implications in terms of the marginal utilities of the goods c, x and the resource stock s: the separable form implies that these marginal utilities are strictly independent of the other variables, the “Cobb-Douglas” form allows for such interactions. In other words, under the separable utility function the consumption choice (between c and x) is made myopically with respect to its impact on resource depletion. We believe this is representative of the reality. As trade-offs exist, even if not acutely perceived by the gaharu producers, the resource stock indirectly affects consumption choices through the budget constraint. In the Cobb-Douglas utility function, the resource stock should affect consumption choices more directly, through the cross terms of the derivatives.
The parameter values, shown in Table 1 are intended to be representative of actual values. We have used the @ Risk software to simulate and optimize. Monte Carlo simulations account for risk in the model: we fit a probability distribution for the quantity and quality of gaharu in a given tree and let the simulation runs converge to a most probable outcome after 1000 runs. The producers are maximizing the present discounted value of utility by choosing their labor allocation to gaharu production.Footnote 16
Table 1. Simulations: Parameter Definitions and Values

We now compare changes in the decision variables of the producers (l, c, s and x) based on the change (increase) in the share of high quality gaharu purchased as low quality, from low to medium and from medium to high, referred to as low and high increase in cheating (α) respectively. We compare the results under these scenarios given low and high stock effects in Table 2, the “stock effect” referring to the impact of the stock of old-growth forest on gaharu production (parameter “a” in Table 1). The motivation for this comparison is that the stock effect appeared to be the most important parameter behind the simulation results, and we thus test for its impact on the results. We base this comparison on the percentage changes in the values assumed by the decisions variables in a given year, then take the average of these percentages over 50 years. The reason for using percentage changes is that they eliminate scaling effects in our simulations, which might distort the comparisons while merely reflecting the sometimes arbitrary nature of the choice of initial values of the decision variables, parameter values and measurement units. Taking the average value eliminates the random component embedded in the optimal value of the decision variables in any given period.
Table 2. Impacts of Pricing on Labor, Consumption Types, and Resource Stock

The results based on the additive utility function indicate that under a low stock effect of old-growth forest on the production of gaharu (i.e., a low stock effect “a” as defined in Table 1), an increase in the level of cheating by the monopsonist decreases the allocation of labor to gaharu production. This is irrespective of that change happening at the lower end of cheating (α = 0.2 to α = 0.35) or at the higher end (α = 0.35 to α = 0.6).Footnote 17 So as the average price of gaharu decreases, the marginal utility of labor allocated to gaharu production decreases and labor is rather allocated to traditional activities. The rate of this reallocation increases on average for higher cheating ratios (−9% for the low-end increase, −16% for the high-end increase). The only other significant result is a 3% decrease in the consumption of market goods under the low increase in cheating. The decrease in consumption is due to the price effect (both income and substitution effect). These simulations do not pick up a significant impact of an increase in cheating on the decision variables under the low stock effect.Footnote 18 It is hard to understand intuitively why a strong effect of decreased average prices on the allocation of effort or labor is transmitted neither to the stock nor to consumption (of market or nonmarket goods). Yet the fact is that with the average year on year changes close to zero for c, s and x, we cannot hypothesize on the relative sizes of the stock, income and substitution effects, we can only observe that their combined effect is close to zero. For instance, the stock may affect simultaneously harvest and thus cash income and consumption, the utility derived from traditional activities and goods, and the direct utility expressed as care for nature.
In the case of a high stock effect, we observe a direct impact of a decrease in average prices as an increase in the allocation of labor to gaharu production, at low and high levels of cheating. The increase in labor allocation is very substantial in both cases. It is interesting to see such a strong dichotomy of impact on labor allocation between the low and high stock effect scenarios, suggesting that policy instruments to regulate the gaharu activity (through price controls in particular) need to pay close attention to the driving factors of production efforts. Comparatively to the impact on labor, under the high stock effect the impacts on market consumption, stock and nonmarket goods are smaller, but consistently negative.Footnote 19 Again, the cross-dynamics behind the changes in the decision variables are too complex to attempt to single out substitution, income and stock effects (on production and on well-being). It seems however that under this scenario, the stock effects dominate the combinations of substitution and income effects: more labor allocated to gaharu production does not translate into more real income (the consumption of market goods decreases). Naturally, as labor is diverted to gaharu production, the stock of forest and the consumption of traditional good and activities decrease.
Under the Cobb-Douglas utility function, an increase in cheating produces a decrease in labor allocation to gaharu production only at low stock effect and a high increase in cheating. In all other cases, decreased average prices for gaharu lead to more labor allocation to gaharu extraction, with the expected decreases (3 to 6%) in traditional consumption and in stock, but without increased consumption of market goods (dominance of the stock effect over the combined substitution and income effects, as discussed above). This further emphasizes the potential difficulty regulating the gaharu activity through price controls, as impacts on stock and well-being depend on the complex interactions of the stock income and substitution effects.
Finally, we also explore how the relationship between the consumption of market goods and the level of cheating is influenced by the stock level. In our theoretical model, by developing equation 13 we found that
 $\displaystyle{{\partial c} \over {\partial \alpha \partial s}} \gt 0$
, which can be interpreted in two ways: with
$\displaystyle{{\partial c} \over {\partial \alpha \partial s}} \gt 0$
, which can be interpreted in two ways: with
 $s \lt \bar S$
, the negative relationship between c and α is less strong for higher stock levels or, with
$s \lt \bar S$
, the negative relationship between c and α is less strong for higher stock levels or, with
 $s \lt \bar S$
, the positive relationship between c and α is stronger for higher stock levels. Table 3 shows that under the additive utility function, a low stock effect weakens the negative relationship between the consumption of market goods and the increase in the level of cheating for higher stock levels, as predicted.Footnote
20
This is equivalent to our theoretical results for
$s \lt \bar S$
, the positive relationship between c and α is stronger for higher stock levels. Table 3 shows that under the additive utility function, a low stock effect weakens the negative relationship between the consumption of market goods and the increase in the level of cheating for higher stock levels, as predicted.Footnote
20
This is equivalent to our theoretical results for
 $s \lt \bar S$
. We find similar results under the high stock effect scenario, so in our simulations it seems we are never above the critical stock as defined in our theoretical model. These results are rather robust to the definition of the “higher” or “lower” stock values.Footnote
21
These observations broadly hold under the Cobb-Douglas utility function, except in the case of the low stock effect, low increase in cheating and high stock level. It seems that much of the labor reallocation towards gaharu that was observed in Table 2 under this scenario takes place when the stock level is high (i.e., in the earlier periods). This allows the income effect to dominate (and thus consumption to increase) momentarily, at the cost of accelerating the resource depletion, until a certain stock level is reached. Thereafter, the stock effect dominates and we fall back on the dynamics discussed above (the two types of consumption decrease).
$s \lt \bar S$
. We find similar results under the high stock effect scenario, so in our simulations it seems we are never above the critical stock as defined in our theoretical model. These results are rather robust to the definition of the “higher” or “lower” stock values.Footnote
21
These observations broadly hold under the Cobb-Douglas utility function, except in the case of the low stock effect, low increase in cheating and high stock level. It seems that much of the labor reallocation towards gaharu that was observed in Table 2 under this scenario takes place when the stock level is high (i.e., in the earlier periods). This allows the income effect to dominate (and thus consumption to increase) momentarily, at the cost of accelerating the resource depletion, until a certain stock level is reached. Thereafter, the stock effect dominates and we fall back on the dynamics discussed above (the two types of consumption decrease).
Table 3. Impacts of Stock Levels on Consumption

Conclusion: Policy Recommendations
The main feature of our model is to combine nondepletive traditional goods, the love of nature and market goods in the objective function of the resource owners/users. This feature ensures a new type of results and dynamics in the relation between poor access to (productive) capital and the depletion of the natural resource base: depending on the state of the resource stock, the impact of the average resource price paid to the producers (here through the monosponist's cheating measured by α) on their consumption of market goods can be either positive or negative. At high stock levels, i.e., above a critical level
 $\bar S$
, lower prices lead to increased market consumption, which can only be achieved by accelerating resource extraction. At low stock levels, lower prices lead to decreased market consumption and therefore more resource conservation.
$\bar S$
, lower prices lead to increased market consumption, which can only be achieved by accelerating resource extraction. At low stock levels, lower prices lead to decreased market consumption and therefore more resource conservation.
In contrast with others (e.g., Barbier Reference Barbier2010), these results show that a poverty - environmental degradation trap is not inevitable in our setting, despite the producers’ poor access to assets, markets and income opportunities. The mechanism of effort allocation between depletive and nondepletive activities is triggered by the relative marginal utility of traditional and market consumption, the latter being indirectly linked to resource extraction. Further, as long as the critical stock level
 $\bar S$
defined in this paper is above the minimum viable stock, complete resource depletion will not happen. The nonlinear relationship between poverty and degradation reflects the notion of an environmental Kuznets curve (see Pfaff et al. Reference Pfaff, Chaudhuri and Nye2004). Such results illustrate the importance of including interactions between the use of natural resources, human well-being and development in the context of sustainable development policies.
$\bar S$
defined in this paper is above the minimum viable stock, complete resource depletion will not happen. The nonlinear relationship between poverty and degradation reflects the notion of an environmental Kuznets curve (see Pfaff et al. Reference Pfaff, Chaudhuri and Nye2004). Such results illustrate the importance of including interactions between the use of natural resources, human well-being and development in the context of sustainable development policies.
The theoretical results above are largely confirmed by our simulations, which are calibrated on field data and observations. The simulation results highlight the impact of the stock effect of old-growth forest on the different decision variables of the gaharu producers. Through the interplay of decision variables described above, the effect of the stock of forest on the production of gaharu determines the income and the substitution effects of a decrease in gaharu prices (an increase of the share of high-quality gaharu paid at the low-quality price). Our results imply that the policies aimed at the economic development of the forest communities and at forest conservation should consider the different scenarios described here. For instance, PNG authorities started to educate forest authority (PNGFA) and customs officers about gaharu grading and pricing in the early 2000s. Such measures might reduce what we call “cheating” in our model, especially if information spills over to producers, and increase the price they receive (though it would not remove the monopsonistic nature of the market in PNG). Crucially, our results show that depending on the stock level of old-growth forest, such interventions can have positive or negative effects on the income of producers and on the extraction of the resource. We expect that our model is applicable and testable where the extraction of other nonrenewable resources can be substituted by nondepletive activities, in communities who attach a high ” existence” or ” amenity” value to the environment they live in. An example coming to mind is the mining of minerals in isolated indigenous communities in tropical forests. Future research work may include attempts to investigate explicitly the link between such policies and producers’ well-being and to endogenize the monopsonist's behavior, or to generalize the model by relaxing the assumption of economic isolation and zero capital accumulation.


 Open access