INTRODUCTION
Ever since delayed recall was shown to be more sensitive than initial learning for diagnosing dementia (Welsh et al., Reference Welsh, Butters, Hughes, Mohs and Heyman1991), the conventional practice has been to rely on retention measures rather than learning measures for identifying mild cognitive impairment (MCI) and dementia. This practice was challenged by an analysis of MCI participants from the Alzheimer’s Disease Neuroimaging Initiative (ADNI) cohort grouped according to their learning and retention scores on the Rey Auditory Verbal Learning Test (Chang et al., Reference Chang, Bondi, Fennema-Notestine, McEvoy, Hagler, Jacobson and Dale2010). Though retention is typically measured using delayed free recall (DFR), in these analyses, DFR was adjusted for the amount of initial learning. Participants with impairments on both learning and retention measures showed the highest conversion rate to clinical dementia over 2 years. Furthermore, participants with learning deficits regardless of retention level showed a higher conversion rate than those with retention deficits regardless of learning level. Relying on retention measures alone, therefore, may miss an important subset of older adults at risk for developing Alzheimer’s disease (AD) (Chang et al., Reference Chang, Bondi, Fennema-Notestine, McEvoy, Hagler, Jacobson and Dale2010). Comparing predictive validity is one approach to identifying measures sensitive to early AD.
Change point methods provide another approach for identifying measures that signal cognitive decline in the predementia phase of AD. These models align participants at the time of dementia diagnosis and look backwards in time to describe prediagnostic cognitive trajectories using a series of piece-wise linear components separated by knots (change points). These change points delineate times of accelerating decline in the predementia phase of AD (Hall et al., Reference Hall, Ying, Kuo, Sliwinski, Buschke, Katz and Lipton2001, Reference Hall, Ying, Kuo and Lipton2003). This approach was applied to a previous sample from the Baltimore Longitudinal Study of Aging (BLSA) (Grober et al., Reference Grober, Hall, Lipton, Zonderman, Resnick and Kawas2008) in which learning was defined by the sum of free recall (SumFR) on the picture version of the Free and Cued Selective Reminding Test with Immediate Recall (pFCSRT+IR) (Buschke, Reference Buschke1984; Grober & Buschke, Reference Grober and Buschke1987). Seven years before clinical dementia diagnosis, there was an accelerated decline in SumFR in 92 incident AD cases that developed from 1985 to 2000 with no detectable free recall decline before then (Grober et al., Reference Grober, Hall, Lipton, Zonderman, Resnick and Kawas2008). After this first change point, there was a decline of 1.48 items per year (out of 48) that continued until a second acceleration 2.6 years before dementia diagnosis when the rate of decline doubled.
Retention was also assessed using the pFCSRT+IR in a case-control study of BLSA participants (Grober & Kawas, Reference Grober and Kawas1997). Learning was defined by the SumFR. Retention was a savings index defined by DFR divided by third trial free recall. Twenty incident AD cases displayed impaired learning but intact retention relative to 60 matched controls at baseline. Three years later, retention was impaired and learning had deteriorated further (Grober & Kawas, Reference Grober and Kawas1997).
Administration of the pFCSRT+IR has continued in the BLSA, and the number of preclinical AD cases that have developed dementia has increased from 92 to 217 since our previous publication. In the present study, using this expanded data set, we describe and contrast the trajectories of decline in learning and retention during the preclinical onset of AD using change point models. We compared change points and slopes for measures of learning and retention in the predementia phase. Learning was measured by the SumFR over the three test trials (max = 48). Retention was measured in two ways: by DFR tested approximately 15–20 min later and by the savings index.
There were three objectives. The first was to extend our earlier findings on the trajectories of learning, as measured by SumFR, during the predementia phase of AD using change point models (Grober et al., Reference Grober, Hall, Lipton, Zonderman, Resnick and Kawas2008). The second objective was to characterize the trajectories of retention, as measured by DFR, during the predementia phase of AD. If DFR was more sensitive to early disease, we predicted that its change point would occur earlier in the course of preclinical AD; under this hypothesis, we would expect accelerated decline in DFR would begin more years prior to dementia diagnosis than the accelerated decline in SumFR. Alternatively, if SumFR was more sensitive to early disease, it should accelerate first, with a longer interval from acceleration to dementia diagnosis than shown for DFR. The final objective was to examine the trajectory of the savings index. In prior work, when retention was measured by savings, incident AD cases displayed intact retention 3 years before clinical diagnosis (Grober & Kawas, Reference Grober and Kawas1997).
METHODS
Participants
The analyses were based on data from 217 BLSA participants who developed clinical AD between January 1985 and December 2015 and underwent longitudinal assessments with the pFCSRT+IR. All available visits meeting these requirements were included in the analysis, including data acquired after the onset of AD symptoms. The BLSA study is approved by the local institutional review board, and all participants gave written informed consent before each assessment.
Dementia Diagnosis
Clinical and neuropsychological data from each participant were reviewed at a consensus case conference if their Clinical Dementia Rating Score (CDR) was greater or equal 0.5 or if they had more than three errors on the Blessed Information-Memory-Concentration Test (BIMC: Blessed et al., Reference Blessed, Tomlinson and Roth1968). Participants in the autopsy study (about half) were also evaluated by case conference upon death or withdrawal. Diagnoses of dementia and clinical AD were based on criteria outlined in the Diagnostic and Statistical Manual of Mental Disorders, third edition, revised (American Psychiatric Association, 1987) and the National Institute of Neurological and Communication Disorders and Stroke – AD and related disorders (McKhann et al., Reference McKhann, Drachman, Folstein, Katzman, Price and Stadlan1984). The diagnosis of dementia relied on clinical history, informant report, and a broad battery of neurocognitive tests that included pFCSRT+IR scores.
pFCSRT+IR
Before the pFCSRT+IR was administered, the 16-line drawings used in the test were presented for naming. The study phase followed in which participants were asked to search a card containing four of the drawings (e.g., grapes) for an item that goes with a unique category cue (e.g., fruit). After all four items were identified, immediate recall of just those four items was tested by free recall, followed by cued recall for missed items. When cued recall failed, the participant was told the name of the item. The study phase was repeated for all 16 drawings. The test phase consisted of three trials of free recall each followed by cued recall for items not retrieved by free recall. The sumFR was the learning measure (maximum = 48). There were two retention measures: DFR tested 15–20 min after learning without representation of the items (maximum = 16) and savings defined by DFR divided by third trial free recall.
Statistical Analyses
To determine the number and timing of change points, three mixed effect models with increasing complexity were fit to the data with sumFR, DFR, and the savings measures as the separate outcomes, and the time (years) to diagnosis of AD was the main predictor. The three models are: (1) No-change point model, (2) one-change point model, and (3) two-change point model. The models were estimated using maximum likelihoodmethod. Model selections were based on likelihood ratio test and Akaike information criterion (AIC) (Burnham & Anderson, Reference Burnham and Anderson2002). The best fitting model indicates how many change points (if any) are there and estimates the timing of the change points and longitudinal trajectories at each stage.
The two-change point model function is given by
 $${Y_{ij}} = {\beta _0} + {b_{0i}} + {\beta _1}tim{e_{ij}} + {\beta _2}{(tim{e_{ij}} - {c_1})_ + } + {\beta _3}{(tim{e_{ij}} - {c_2})_ + } + {\varepsilon _{ij}}$$
where (x)+ = x, x > 0 and (x)+ = 0, x < 0.
c 1 is the first change point and c 2 is the second change point. b 0i is a random effect that follows a normal distribution with mean 0 and standard deviation of σ.
To test if the timings of the change points are statistically different between learning and retention, we bootstrapped the final change point models on 500 random samples.
All the analyses were conducted in SAS 9.4 (Cary, NC).
Results
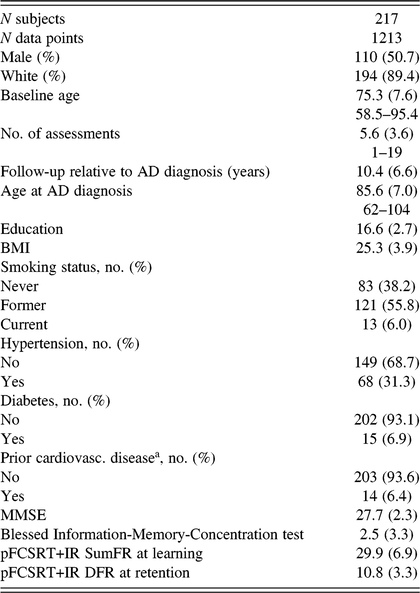
The sample that developed clinical AD had a mean age at baseline of 75.3 (SD = 7.6) and was 49.3% women. The cohort had up to 19 pFCSRT+IR assessments with an average of 5.6 (SD = 3.6) assessments and up to 23 years of longitudinal follow-up with an average of 8.8 (SD = 6.0) years. Mean follow-up from baseline to the development of dementia was 10.4 years (SD = 6.6). The cohort is described in Table 1.
Table 1. Baseline demographics and sample characteristics for persons who developed incident AD in the BLSA

a Defined as myocardial infarction or congestive heart failure.
Table 2 shows the model fit statistics, including included AIC and likelihood ratio tests. These indices and tests show that the two-change point model fits the data best for learning and DFR and the one-change point model for savings.
Table 2. Model fit statistics

AIC = Akaike information criterion; −2 LL = −2 log likelihood; DF = degree of freedom.
a p-value is from likelihood-ratio test comparing the current model with the previous model, significance means that the current model is significantly better than the previous model.
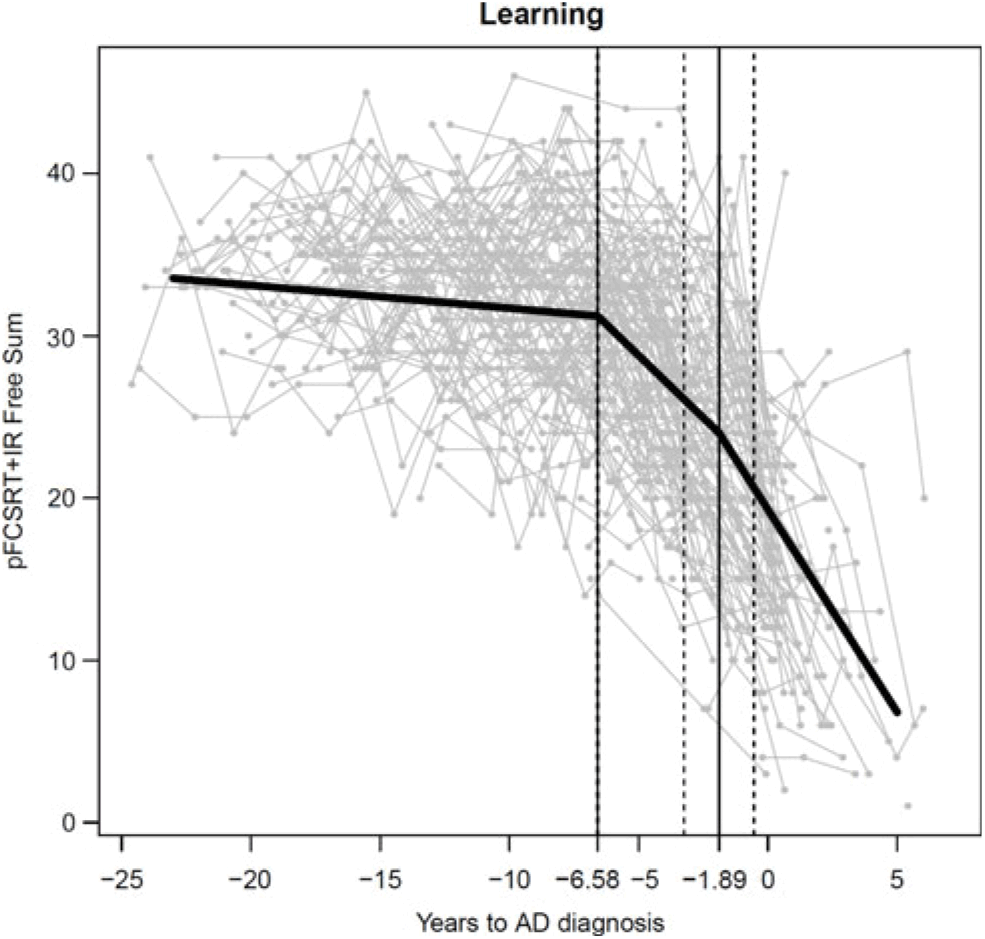
For learning, the first change point is 6.58 years (95% confidence intervals (CI) = 6.56, 6.60) before diagnosis, and the second change point is 1.89 years (95% CI = 0.54, 3.24) before diagnosis. The two change points result in three segments of trajectories whose rates of decline are −0.14 per year (p = .0017) before the first change point, −1.54 per year (p <.0001) between the first and second change points, and −2.50 per year (p <.0001) after the second change point. At the first change point, sumFR is 31.2 and at the second it is 24.0. Figure 1 shows the model fit trajectory for learning with 95% CI around the two change points.

Fig. 1. Learning trajectory
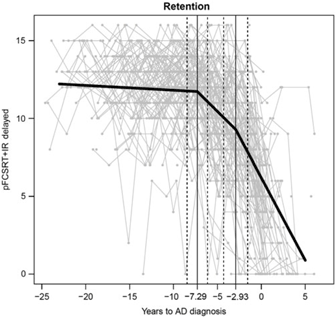
For DFR, the first change point is 7.29 years (95% CI = 6.13, 8.46) before the diagnosis and the second change point is 2.93 years (95% CI = 1.56, 4.30). The two change points result in three segments of trajectories whose rates of decline are −0.031 per year (p = .24), −.56 per year (p <.0001), and −1.06 per year (p <.0001), respectively. At the first change point, DFR is 11.7 and at the second it is 9.2. Figure 2 shows the model fit trajectory for DFR with 95% CI around the two change points.

Fig. 2. Retension trajectory
The bootstrapping results showed that the first and second change points for DFR did not differ statistically from those for learning (p = .38 and .30, respectively). Approximately 4 years separated the first and second change points in both the learning and retention trajectories.
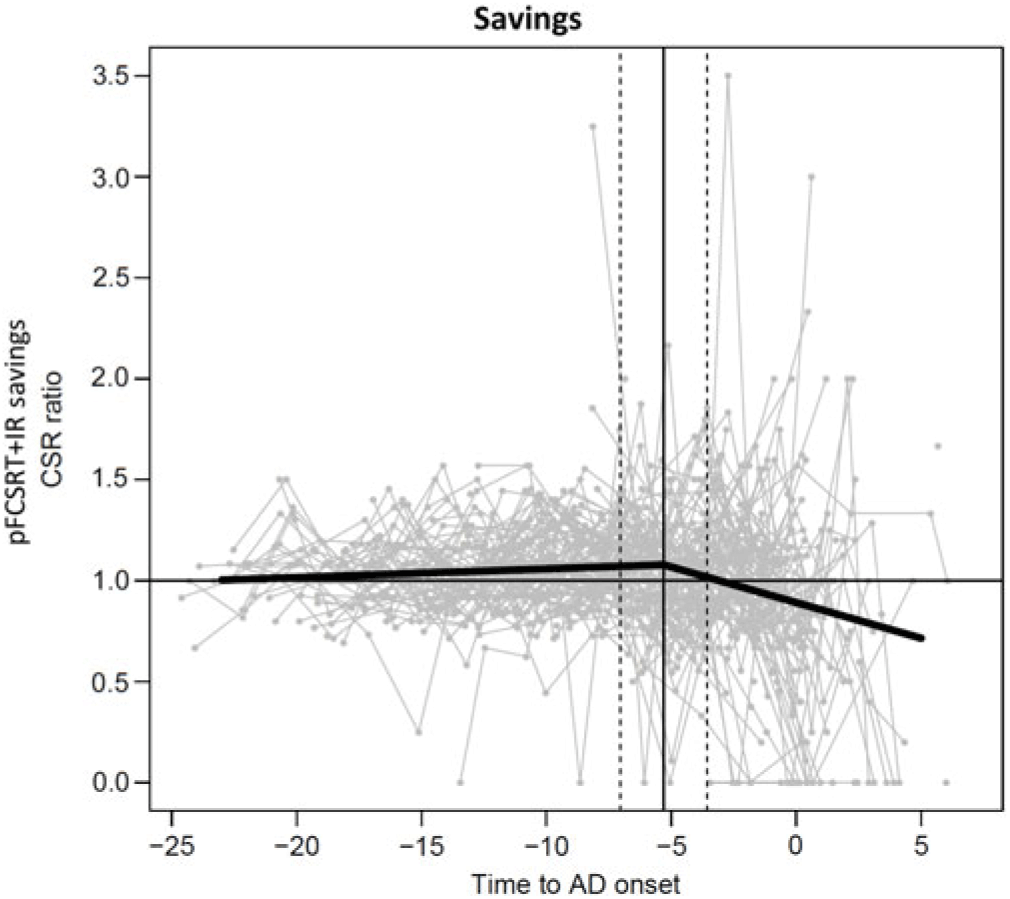
There was only one change point for the savings index 5.30 years before diagnosis (95% CI: 3.56, 7.04) (Figure 3). The change point resulted in two segments whose rates of decline were 0.0042 (p = .15) before and −0.035 (p <.0001) after the change point.

Fig. 3. Savings trajectory
DISCUSSION
Our goal was to compare the temporal unfolding of learning and retention deficits in the predementia phase of AD. The trajectories of learning (SumFR) and retention (DFR) displayed by 217 incident AD cases from the BLSA were similar: for each measure, there are two change points: the first at 6.6–7.3 years before diagnosis, followed by accelerated decline over the next 4 years. Beginning 1.9–2.9 years prior to diagnosis, there was an incremental acceleration of decline for indices of both learning and retention. Though the change points for DFR occurred earlier than SumFR, the differences were not significant. The time between the first and second change points was 4 years for both learning and retention.
The trajectory of learning deficits in the current cohort replicates and extends the findings from the earlier BLSA incident AD cohort (Grober et al., Reference Grober, Hall, Lipton, Zonderman, Resnick and Kawas2008). The timing of the two change points for the SumFR and the score at each point in that study were used to define the stages of objective memory impairment (SOMI) system that identifies transitional stages in the emergence of episodic memory impairment in the predementia phases of AD (Grober et al., Reference Grober, Veroff and Lipton2018). SOMI was developed on the literature mapping FCSRT performance to clinical outcomes and biological markers, and on profiles of decline in free and total recall in longitudinal studies following cognitively normal older adults over many years, until some develop AD and other dementias. The SOMI system includes four sequential predementia stages and one clinical stage. The SOMI identified incipient dementia with excellent sensitivity and specificity (>90%). Consistent with SOMI model predictions, time to diagnosis in the incident AD group was 7 years when learning was intact (sumFR > 30).
The decline of learning years before clinical diagnosis is consistent with recent studies demonstrating that pFCSRT+IR may be particularly useful in secondary prevention trials aimed at reducing the progression of clinical symptoms in clinically normal (CN) individuals with biomarker evidence of AD. In one study, out of nine neuropsychological tests, learning (sumFR) on the pFCSRT+IR was the only measure to demonstrate impairment at baseline in cognitively normal individuals (CDR = 0) with the Cerebral Spinal Fluid (CSF) AD profile (Schindler et al., Reference Schindler, Jasielec, Weng, Hassenstab, Grober, McCue, Morris, Holtzman, Xiong and Fagan2017). Further evidence that impaired learning is an early signal comes from studies of the preclinical Alzheimer cognitive composite (PACC) that includes the pFCSRT+IR (Donohue et al., Reference Donohue, Sperling, Salmon, Rentz, Raman, Thomas, Weiner and Aisen2014; Mormino et al., Reference Mormino, Papp, Rentz, Donohue, Amariglio, Quiroz, Chhatwal, Marshall, Donovan, Jackson and Gatchel2017; Papp et al., Reference Papp, Rentz, Mormino, Schultz, Amariglio, Quiroz, Johnson and Sperling2017). The other PACC components include delayed story recall, a timed measure of executive function (DSST), and a measure global cognition (MMSE). CN individuals were divided into two groups on the basis of amyloid imaging (Mormino et al., Reference Mormino, Papp, Rentz, Donohue, Amariglio, Quiroz, Chhatwal, Marshall, Donovan, Jackson and Gatchel2017). Aβ-related change in each PACC component and the impact of adding or eliminating components were assessed. Examining effect sizes across all PACC combinations revealed that all combinations including free recall resulted in larger effect sizes over 3 and 5 years of follow-up. To determine whether progression contributed to Aβ-related PACC decline, Aβ+ group was divided into those that progressed to CDR 0.5 versus those that remained stable. Free recall was the only individual component to show differences between these two groups at baseline. Furthermore, the Aβ+ stable group did not differ from the Aβ− group across any PACC combinations or individual PACC components except for free recall.
For the savings index, there was only one change point, occurring 5.3 years before diagnosis, making it less sensitive to early disease than DFR. The difference in their trajectories is interesting but one that requires further investigation in the context of a larger sample including cognitively normal controls and multiple measures on the pFCSRT+IR. Except for our earlier study (Grober & Kawas, Reference Grober and Kawas1997), we are not aware of any studies that examined savings using the FCSRT.
Various patterns of learning and retention decline in predementia AD cohorts have been observed. When learning and retention were studied using the California Verbal Learning Test in a BLSA cohort similar to the current one (Bilgel et al., Reference Bilgel, An, Lang, Prince, Ferrucci, Jedynak and Resnick2014), learning declined before DFR among cognitively normal participants and those who progressed to MCI or AD. However, delayed recall declined more rapidly than learning as the disease progressed, crossing the threshold for impairment before learning.
Using the Consortium to Establish a Registry for Alzheimer’s Disease list learning test 8 years before MCI was diagnosed, impaired retention was present while impaired learning was identified 4 years later (Mistridis et al., Reference Mistridis, Krumm, Monsch, Berres and Taylor2015). When immediate and delayed story recall were assessed, accelerated decline of both began about 3 years prior to MCI diagnosis and rates of decline did not differ by measure (Howieson et al., Reference Howieson, Carlson, Moore, Wasserman, Abendroth, Payne-Murphy and Kaye2008). Finally, amnestic MCI progressors displayed a gradual decline in learning on the word version of the FCSRT+IR 4 years before the diagnosis of AD dementia; decline in DFR, though starting at the same time, accelerated 1 year before diagnosis (Cloutier et al., Reference Cloutier, Chertkow, Kergoat, Gauthier and Belleville2015). These inconsistencies are not surprising when the factors that determine predictive value are considered: where an individual is in the multiyear process of cognitive decline that precedes dementia (Bilgel et al., Reference Bilgel, An, Lang, Prince, Ferrucci, Jedynak and Resnick2014); the psychometric properties of the particular test being used (Grober et al., 2009); and the composition of the sample that does not go on to develop dementia.
Patterns of decline on measures of learning and retention are likely test dependent. For the pFCSRT+IR, in contrast with some other tests, learning and retention do not differ in their sensitivity for detecting accelerated decline. Perhaps this is because the pFCSRT+IR uses controlled learning (searching for items based on category cues) which ensures semantic processing of the to-be-remembered items. Cognitive control during the study phase promotes robust learning during the test phase. Measuring retention of inadequately learned material because the learning conditions are uncontrolled adds another factor contributing to contradictory results in the pattern of learning and retention decline in predementia phase of AD.
There are several study limitations. The same pFCSRT+IR list of items has been administered at the biennial assessments. A sensitivity analysis was conducted to assess whether practice effects due to use of the same list influenced when change points occur and rate of decline. The model included an additional practice effect term presumed to occur between the first and second assessment where the greatest practice effect occurs, though we recognize that practice effects can continue in subsequent assessments. The results show that while the practice effect is statistically significant for both learning and DFR, the main results are not materially different from the original results in terms of the number and timing of the change points. We acknowledge that this approach does not fully control for practice effects which might be expected to improve performance and reduce estimates of trajectories of decline.
Another study limitation is that pFCSRT+IR scores were used in diagnostic case conferences through 2010 which relied on clinical history, informant report, and a broad battery of neurocognitive tests. While this raises the possibility that the diagnostic procedures influenced the timing of the change points, this seems unlikely since the first change points occurred about 7 years before participants met clinical criteria for dementia and the second change point occurred almost 2 years prior to diagnosis. Importantly, in the previous BLSA sample of incident AD cases (Grober et al., Reference Grober, Hall, Lipton, Zonderman, Resnick and Kawas2008), dementia diagnosis was determined independently of pFCSRT+IR scores, yet the timing and the corresponding score at each change point were similar to those reported in the current study.
Another limitation is the high-educational level of the cohort. Consistent with the cognitive reserve hypothesis (Stern, Reference Stern2002), some studies have found that persons with greater education experienced accelerated memory decline closer to the time of dementia diagnosis than persons with lower education (Hall et al., Reference Hall, Derby, LeValley, Katz, Verghese and Lipton2007; Soldan et al., Reference Soldan, Pettigrew, Cai, Wang, Wang, Moghekar, Miller and Albert2017). Thus, caution should be exercised when generalizing the temporal trajectories of learning and retention in our study to a less-educated cohort. The strength of our data set is the sizable and well-characterized cohort of incident AD cases and the large number of assessments available over more than 20 years of follow-up.
We have described trajectories of both learning and retention on a sample level. A point worth noting is that there were considerable variabilities in these trajectories at the individual level. The investigation of these variabilities and their potential predictors, though beyond the scope of this manuscript, is important and may shed light on the prognostic value of the measures on an individual level.
Is it necessary to include a retention measure in observational cohort studies and in interventional trials? If the study purpose is to map learning and retention processes onto the brain substrates that support them, then both measures should be collected as their impairment is associated with distinct patterns of regional brain atrophy (Chang et al., Reference Chang, Bondi, Fennema-Notestine, McEvoy, Hagler, Jacobson and Dale2010). However, adding a retention test to a neuropsychological battery increases participant burden and limits the testing performed between learning and retention to nonverbal material so as not to contaminate the retention measure. Moreover, retention is a less-reliable measure than learning (max = 16 vs. 48). For identifying persons at high risk of AD, impaired learning on the pFCSRT+IR outperformed delayed recall on both logical memory and the CERAD list learning (Wagner et al., Reference Wagner, Wolf, Reischies, Daerr, Wolfsgruber, Jessen, Popp, Maier, Hüll, Frölich, Hampel, Perneczky, Peters, Jahn, Luckhaus, Gertz, Schröder, Pantel, Lewczuk, Kornhuber and Wiltfang2012). Ultimately, the decision to include a retention measure will depend on the goals of the study.
In conclusion, we have shown that both learning and retention decline years before the onset of clinical symptoms of AD.
Acknowledgments
The FCSRT+IR is copyrighted by the Albert Einstein College of Medicine and is made freely available for noncommercial purposes. Dr. Ellen Grober receives a small percentage of any royalties on the FCSRT+IR when it is used for commercial purposes. Dr. Yang An has no disclosures other than being an employee of the NIA. Dr. Susan Resnick has no disclosures other than being an employee of the NIA. Dr. Claudia Kawas has no disclosures. Dr. Richard B. Lipton is the Edwin S. Lowe Professor of Neurology at the Albert Einstein College of Medicine in New York. He receives research support from the NIH: 2PO1 AG003949 (Program Director), 5U10 NS077308 (PI), RO1 NS082432 (Investigator), 1RF1 AG057531 (Site PI), RF1 AG054548 (Investigator), 1RO1 AG048642 (Investigator), R56 AG057548 (Investigator), K23 NS09610 (Mentor), K23AG049466 (Mentor), and 1K01AG054700 (Mentor). He also receives support from the Migraine Research Foundation and the National Headache Foundation. He serves on the editorial board of Neurology, as a senior advisor to Headache, and as an associate editor to Cephalalgia. He has reviewed for the NIA and NINDS, holds stock options in eNeura Therapeutics and Biohaven Holdings; serves as consultant, advisory board member, or has received honoraria from American Academy of Neurology, Alder, Allergan, American Headache Society, Amgen, Autonomic Technologies, Avanir, Biohaven, Biovision, Boston Scientific, Dr. Reddy’s, Electrocore, Eli Lilly, eNeura Therapeutics, GlaxoSmithKline, Merck, Pernix, Pfizer, Supernus, Teva, Trigemina, Vector, and Vedanta. He receives royalties from Wolff’s Headache 7th and 8th Edition, Oxford Press University, 2009, Wiley and Informa. This study was supported in part by the Intramural Research Program, National Institute on Aging, NIH and the Einstein Aging Study, National Institutes of Health (AG03949), NIH.


