


The global landscape of existing utility model rights is a helpful starting point to the discussion on utility model innovation policy at the country level as well as company strategy. WIPO data indicates that approximately 3 million utility model applications were filed globally in 2022, a growth rate of 2.9 percent from the previous year and close to the global total of 3.5 million applications for standard patents.Footnote 1 Only about one-half of the world’s countries provide for utility model systems, yet companies from around the world acquire these rights. Utility models are important players in the intellectual property (IP) environment, and the unique qualities of the system and differential representation require specific analysis.
In this chapter, we review existing empirical data and present additional data regarding utility model filings and litigation worldwide. Our purpose is to provide background and context for the more detailed discussion in the remaining chapters in this book.
2.1 Representation of Utility Model Systems across the World
As detailed in subsequent chapters, utility model systems are generally less harmonized than standard patent rights in terms of subject matter coverage, length of protection and the process for securing the rights. Such differences might lead one to suspect that utility models are marginalized as a global right. To be sure, the right is conspicuously absent in major IP markets such as the United States, Canada, the United Kingdom and India. On the other hand, utility models are protected in seventy-five countries and regional patent offices.Footnote 2 Although many of these countries are small, together they represent a significant portion of the global economy. Specifically, utility models are in force in countries generating about one-half of the world’s economic output by GDP.Footnote 3 Although not ubiquitous, utility model protection can hardly be described as rare (see Figure 2.1).

The creation of a utility model system is a matter of national choice. Utility models are not mentioned in the primary international IP treaty, the 1994 TRIPS Agreement.Footnote 4 The Paris Convention for the Protection of Industrial Property does recognize the existence of utility models but does not oblige members of that treaty to provide such protection.Footnote 5
Even within major trading regions, there is disparity. For example, the United States, Canada and Mexico share sufficient trade synergies to have entered into the North American Free Trade Agreement (NAFTA)Footnote 6 and, more recently, the US-Mexico-Canada Agreement (USMCA),Footnote 7 but only Mexico has a utility model system.Footnote 8 Several members of the European Union (EU), such as Luxembourg and Sweden, do not have utility model systems, but others, such as Germany, France and Italy, do.Footnote 9 Although trading regions may share some goals for IP protection, they do not necessarily see eye-to-eye with respect to utility model protection.
2.2 Descriptive Statistics on Utility Models
2.2.1 Existing Studies
Over the years, a small amount of empirical literature concerning utility models has emerged.Footnote 10 Suthersanen (Reference Suthersanen2006) offers empirical data on utility model filings in Germany, Japan, Korea, China, Malaysia and Taiwan. Suthersanen et al. (Reference Suthersanen, Dutfield, Suthersanen, Dutfield and Chow2007) collect contributions including empirical data on utility model filings in Singapore, Australia, Japan, Korea, China, various ASEAN nations and Mexico. Both of these foundational works seek to assess the effectiveness of utility model systems as promoters of local innovation, particularly in emerging economies. Relatedly, Heikkilä (Reference Heikkilä and Peltoniemi2023) develops a set of key performance indicators (KPIs) for utility model systems based on a literature review and the public statements of governmental issuing offices.
Utility models have also been the subject of a handful of more recent studies focusing on business strategy and innovation theory. Kim et al. (Reference Kim, Lee, Park and Kineung2012) analyze Korean utility model filings to assess their contribution to firm performance. Cao et al. (Reference Cao, Lei and Wright2014) compare firms’ filing behavior for inventions protected in both the United States and China. Heikkilä and Lorenz (Reference Heikkilä and Lorenz2018) study the strategic utilization of utility models by German firms, while Heikkilä and Verba (Reference Heikkilä and Verba2018) explore the structures and characteristics of European patent families that include utility models. Cahoy and Oswald (Reference Cahoy and Oswald2021) use US patent priority data to assess the degree to which firms elect to pursue patent versus utility model protection for similar innovations. Finally, Zhang (Reference Zhang2022) investigates the frequency with which utility models are litigated in China and the characteristics that make both patents and utility models more likely to be litigated.
2.2.2 Utility Model Filings by Country
To provide an updated picture of the global utility model landscape, we used data provided by the World Intellectual Property Organization (WIPO)Footnote 11 as well as the IPLytics platform (now a part of Lexis-Nexis).Footnote 12 As an official United Nations organization, WIPO makes available filing data from the patent offices of its 193 member states.Footnote 13 The IPLytics database includes patent and utility model filing data from 98 national and regional patent offices.Footnote 14 These databases were queried between March and May 2023.
From 1990 to 2021, inclusive, approximately 23 million applications for utility models were filed, with approximately 17.7 million filed between 2012 and 2021, inclusive (Table 2.1).
Table 2.1 Top 20 utility model applicants, 2021 and cumulative 1990–2021Footnote a
| Country | 2021 rank | 2021 utility model | 1990–2021 rank | 1990–2021 utility models(n = 23,515,896) |
|---|---|---|---|---|
| ChinaFootnote b | 1 | 2,852,219 | 1 | 19,839,834 |
| Taiwan | 2 | 15,162 | 5 | 515,008 |
| Germany | 3 | 10,576 | 4 | 569,205 |
| Russia | 4 | 9,079 | 6 | 234,215 |
| Australia | 5 | 7,844 | 12 | 42,943 |
| Japan | 6 | 5,238 | 3 | 679,994 |
| Ukraine | 7 | 4,425 | 7 | 147,980 |
| Turkey | 8 | 4,490 | 11 | 53,555 |
| KoreaFootnote c | 9 | 4,009 | 2 | 806,739 |
| Thailand | 10 | 3,762 | 13 | 42,039 |
| Indonesia | 11 | 3,249 | 18 | 15,844 |
| Spain | 12 | 3,091 | 8 | 96,124 |
| Brazil | 13 | 2,578 | 9 | 92,245 |
| Italy | 14 | 2,019 | 10 | 88,093 |
| Philippines | 15 | 1,799 | 17 | 22,316 |
| Czech Republic | 16 | 1,104 | 15 | 39,134 |
| Poland | 17 | 779 | 14 | 40,415 |
| Mexico | 18 | 706 | 19 | 15,556 |
| France | 19 | 673 | 24 | 8,910 |
| Hong Kong | 20 | 552 | 23 | 9,032 |
a All data sourced from WIPO, other than data for Taiwan, which is sourced from IPLytics.
b References to “China” refer to the Peoples Republic of China, excluding the special administrative areas Hong Kong and Macau and Taiwan (Republic of China).
c References to “Korea” refer to the Republic of Korea.
As indicated in Table 2.1, China is by far the jurisdiction in which the most utility models are filed. In 2021 alone, there were 2.8 million Chinese utility model filings out of a global total of 2.9 million (97.6 percent), and from 1990 to 2021, collectively, there were 19.8 million Chinese utility model filings out of a global total of 23.5 million (84.4 percent). The growth of Chinese utility model filings is discussed in greater detail below.
Other than China, several jurisdictions, including Germany, Korea, Japan, Taiwan and Russia, have consistently had significant numbers of utility model filings. Figure 2.2 shows the top 10 jurisdictions for utility model filings in 2021, as well as cumulative utility model filings for the period 1990–2021.
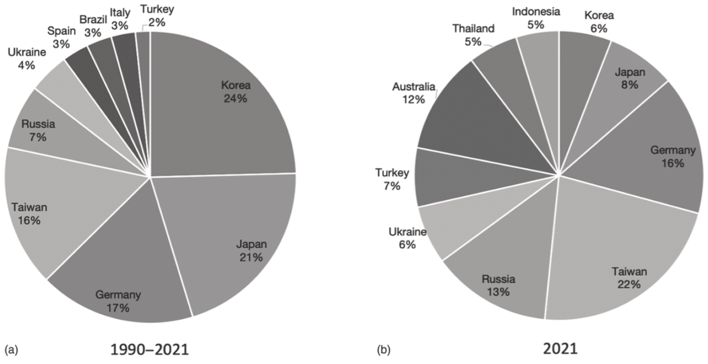
Figure 2.2 Top 10 utility model filing jurisdictions (excluding China), 1990–2021 and 2021
Figure 2.2 highlights a number of notable shifts in utility model filings over time. First, Korea and Japan, both early leaders in utility model filings, have dropped in ranking, leaving Germany and Taiwan as the highest filing jurisdictions after China. Countries in Central Europe and Asia Minor, including Russia, Ukraine and Turkey, as well as smaller Asian countries such as Thailand, Indonesia, Philippines and Hong Kong, have increased their rankings at the expense of European jurisdictions such as Spain, Italy and Poland. Some of these trends are examined in greater detail below.
Figure 2.3 illustrates filings for utility models during the 1990s, when four jurisdictions dominated the filing of utility model applications: China, Germany, Japan and Korea, representing 1.5 million of 1.7 million total filings worldwide (89.5 percent). This period marks the beginning of China’s rise to become the dominant jurisdiction for utility model filings.
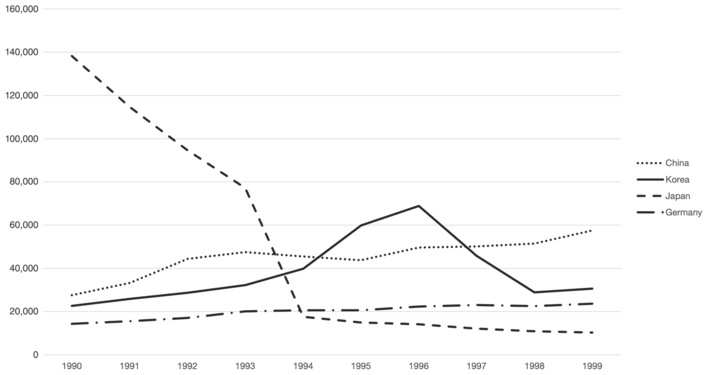
Figure 2.3 Utility model filings 1990–1999 in top 4 jurisdictions
From 1990 to 1993, China, Germany and Korea had comparable levels of utility model filings, with Japan leading by a significant margin. A statutory change in Japan in 1993 led to a sharp decrease in Japanese filings.Footnote 15 From 1995 to 1997 Korea was the utility model filing leader but was overtaken by China in 1997 with approximately 50,000 filings to Korea’s 46,000.
As shown in Figure 2.4, annual Chinese filings began to increase rapidly in the early 2000s, breaking the 100,000 mark in 2003 (representing 52 percent of all filings worldwide).
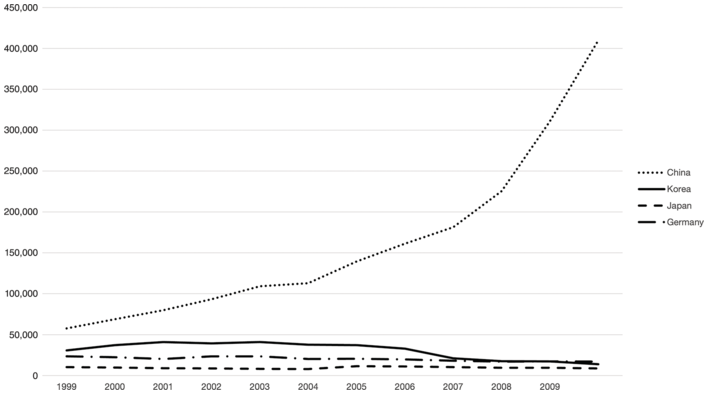
Figure 2.4 Utility model filings 1999–2009 in top 4 jurisdictions
In 2011, China’s 585,000 utility model filings represented 87.2 percent of the 671,000 filings worldwide and in 2021, China’s 2.8 million filings represented 97.6 percent of the global total. The reasons for China’s rapid embrace of utility model filings has been discussed in the literature and is beyond the scope of this article.Footnote 16
As a result of China’s massive surge of utility model filings, analysis of activity in the rest of the world can only be understood if Chinese filings are omitted. Thus, from 2012 to 2021, approximately 424,000 filings in the top six jurisdictions other than China (Australia, Germany, Japan, Russia, Korea and Ukraine) accounted for 55 percent of non-China filings during that period. These filings reveal a few interesting trends shown in Figure 2.5.
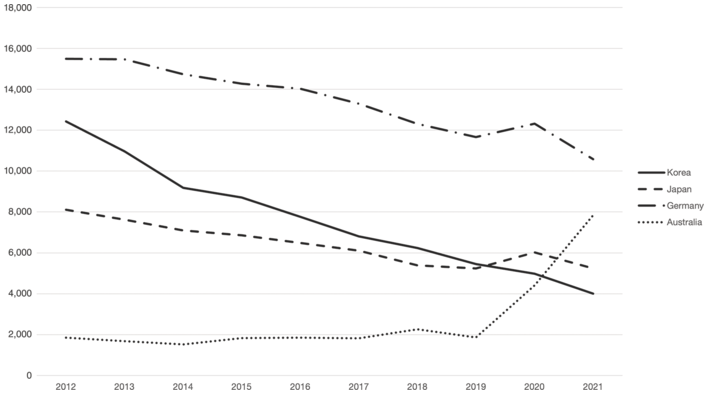
Figure 2.5 Utility model filings, 2012–2021, top 6 jurisdictions (excluding China)
As shown in Figure 2.5, with the exception of Australia, filings in each of these countries declined during the period; this decline ranged from a 32 percent (in Germany) to 68 percent (in Korea). Australia is the exception, possibly because, as noted above, Australia abolished its innovation patent system in 2021 and beginning in 2019 filers sought to obtain as much protection as possible while it was still available.
2.2.3 Utility Model Filers
The utility model systems of certain jurisdictions appear to be more attractive to foreign filers than others. For example, the vast majority of Japanese utility model filers are firms headquartered in Japan. From 2000 to 2022, of the top 30 applicants for Japanese utility models, only two were non-Japanese (Foxconn (Taiwan)Footnote 17 and Applied Materials (US)). Filings in Japan are also exceptionally distributed, with the top 1,000 filers representing only 8.4 percent of total applications during that period. A similar pattern appears to exist in China, where the vast majority of utility model applicants appear to be local Chinese firms, although the very large number of Chinese utility model filings make this observation difficult to verify empirically.
In Germany, on the other hand, 10 of the top 30 utility model applicants are foreign-based, including the top filer, Ford Motor Co., whose 1959 applications are nearly double the number of applications by the second highest filer, Siemens (1,028).Footnote 18 Other non-German applicants in the top 30 are based in the United States, Hong Kong, Taiwan, Korea, Japan and Italy.Footnote 19 German utility model applications are dispersed across a large number of applicants, with the top 1,000 applicants representing approximately 73,000 of 313,000 applications from 2000 to 2022 (23 percent), but far less so than Japan.
Because domestic applicants are traditionally the single largest group in any country, they can obscure global trends reflecting business strategy. Only 0.5 percent of the 3 million utility model applications filed globally in 2022 were made by non-residents.Footnote 20 Further, a simple count of top filers or most prominent originating countries will be dominated by the domestic filers in the top utility model country, China, which accounted for 98 percent of global filings in 2022.Footnote 21
A potentially more interesting consideration is the strategy of global filers who look outside of their own countries. When one excerpts domestic filings from each country and considers the global trend, the surprising result is that even though the United States has no utility model system, US residents are among the top-three most represented non-domestic applicants across the world (see Figure 2.6). This suggests that utility model rights may have strategic value outside of a particular innovation system.Footnote 22

2.2.4 Litigated Utility Models
The frequency with which utility models are enforced or challenged in administrative proceedings (which, for the sake of convenience, we refer to as “litigated”) has not been studied. This section provides initial descriptive statistics concerning litigation and challenges of utility models.
From 2000 to 2022, we identified approximately 30,000 utility models that were the subject of judicial proceedings, including both administrative challenges and court litigation.Footnote 23 These figures do not include utility models that were subject to arbitration proceedings. As shown in Table 2.2, litigated utility models can be found across a wide range of jurisdictions, from large, developed economies to small and developing ones.
Table 2.2 Jurisdictions where utility models were litigated, 2000–2022
Consistent with its position as the leading jurisdiction in terms of overall utility model filings, China is also the site of the greatest number of utility models subject to litigation (69.5 percent). This being said, this share is significantly lower than China’s share of overall utility model filings during this period (95.6 percent). As such, China appears to have a somewhat lower rate of litigation than other jurisdictions.
Other jurisdictions in which large numbers of utility models are filed (i.e., Germany, Japan, Russia, Korea) also lead the rankings for litigated utility models. Nevertheless, there is a “long tail” of jurisdictions in which utility models are litigated but relatively few utility models have been issued. For example, Finland, with 79 litigated utility models, ranks 13th in terms of litigated utility models, but only 23rd in terms of overall utility model filing during the period. Moreover, some jurisdictions that rank fairly high in terms of utility model issuance (e.g., Australia, France, Philippines) have very little utility model litigation, and Thailand, Mexico and Hong Kong, which ranked 11th, 17th, 19th, respectively, in terms of utility model issuances during the period, had no reported utility model litigation during the period.
A wide range of parties have been involved in utility model litigation, with no individual party holding more than 0.2 percent of total utility models subject to litigation (either as the plaintiff or defendant). Of the twenty firms holding the largest number of utility models subject to litigation from 2000 to 2022 (ranging from 22 to 63 utility models), three were Taiwanese and seventeen were Chinese. Even among the top 50 holders of litigated utility models, the large majority were Chinese (including Segway, the former US manufacturer of personal mobility devices, now a Chinese-held firm), along with a handful of Taiwanese and Japanese firms.


 Open access