1. Introduction
The stability index is expressed as a ratio between the shear stress and the shear strength of snow accumulated on a slope and is commonly used in assessing avalanche risk. In field measurements of shear strength, although there are shear frame techniques for shear strength measurements using the maintained natural snow column (e.g. Reference Conway and AbrahamsonConway and Abrahamson, 1984), the shear frame index (SFI) value is determined by simple use of a shear frame in many studies. However, SFI measurements cannot be conducted under natural normal load conditions because the overlying snow on the layer to be evaluated must be removed to enable measurement. The possibility of differences between shear strength in natural conditions and measured SFI values has been highlighted in many previous studies (Reference RochRoch, 1966; Reference Perla and BeckPerla and Beck, 1983; Reference Jamieson and JohnstonJamieson and Johnston, 1998; Reference Yamanoi and EndoYamanoi and Endo, 2002; Reference Matsuzawa, Kajiya and ItoMatsuzawa and others, 2007; Reference Nakamura, Abe, Hashimoto and OhtaNakamura and others, 2010). It is also known that the rate of SFI increase depends on snow grain shapes, normal load and other conditions. For example, Reference Jamieson, Zeidler and BrownJamieson and others (2007) clearly demonstrated the correlation between temporal variations in SFI values and normal load caused by overlying snow layers based on field measurements for surface hoar and faceted crystals. Furthermore, Reference Zeidler and JamiesonZeidler and Jamieson (2006a,Reference Zeidler and Jamiesonb) proposed a method for adjusting normal load caused by overlying snow based on the time evolution of SFI values for surface hoar and faceted crystals. Reference Kaihara, Hachikubo, Ozeki, Nishimura and AkitayaKaihara and others (2011) measured the rate of SFI increase with respect to time for different snow grain shapes and found that the value was highest for snow consisting of precipitation particles, followed by types consisting of graupel and depth hoar. However, snow consisting of precipitation particles has a low SFI value immediately after it falls and temporarily forms a non-persistent weak layer. Accordingly, understanding temporal variations in SFI values for such snow is important when assessing avalanche risk during periods of snowfall. Based on the results of field measurements, Reference Brown, Jamieson and GleasonBrown and Jamieson (2006) concluded that the increase in SFI values for a weak layer consisting of precipitation particles was strongly affected by stress caused by overlying snow. Reference Gauthier, Brown and JamiesonGauthier and others (2010) proposed a method to estimate temporal variations in SFI values for weak layers consisting of precipitation particles using normal load caused by overlying snow, the mean air temperature and the amount of time elapsed as input factors. Although a number of studies have discussed the effects of normal load caused by overlying snow and temperature on temporal variations in SFI values, the related causes and mechanisms have not been clarified.
We conducted an experiment using artificial snow (which is more homogeneous than natural snow) in a temperature-controlled laboratory to clarify the effects of temperature and normal load caused by overlying snow on temporal variations of SFI values for snow consisting of precipitation particles.
2. Experiment Method
2.1. Outline of experiment
The experiment was carried out in the Cryospheric Environment Simulator (CES) of the Shinjo branch, Snow and Ice Research Center, National Research Institute for Earth Science and Disaster Prevention (NIED) in Yamagata prefecture, Japan. Artificial snow consisting of dendritic crystals (Fig. 1) was allowed to accumulate to ∼60 cm depth using snowfall simulation equipment. The environmental temperature in the laboratory was kept at about –10˚C during the period of snow production and was then controlled at two values: –3˚C (case H: higher-temperature condition) and –7˚C (case L: lower-temperature condition). The shear strength, snow temperature, density and mass of the overlying snow were measured for three levels at approximately one-half, one-third and one-fifth of the total snow depth from the bottom of the snowpack. Measurement for shear strength is described in Section 2.2. The temperature of the snow was measured using a thermistor thermometer, and the density of the snow was determined using a cubic sampler 3 cm in height and 100cm3 in volume. The mass of the overlying snow above the measurement position was obtained using a cylindrical sampler with a cross-sectional area of 50cm2. Normal load caused by overlying snow at the measurement positions was determined based on its measured mass. Measurements for cases H and L were taken four times within 76 hours and three times within 24 hours, respectively.
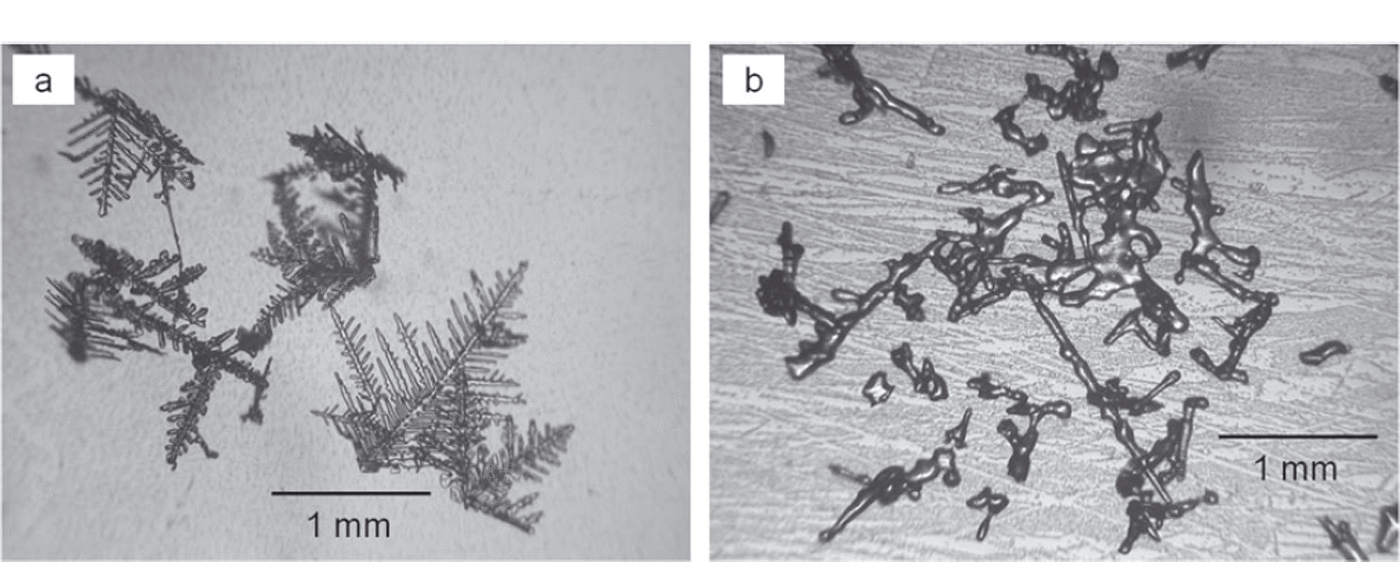
Fig. 1. Micrograph images of artificial snow crystals used in the experiment (a) immediately after snowfall and (b) 76 hours later.
2.2. SFI measurement
Shear strength was measured using a shear frame with a cross-sectional area of 0.025m2 (weight 82.6g with titanium) and expressed as an SFI value. To find the SFI (Nm–2), the value for tensile loading (N) at the time of snow shear failure induced by horizontally pulling the shear frame buried in the snow within a few seconds was divided by the cross-sectional area of the shear frame (m2). The SFI value used in the analysis was the mean of five measurements, and the measured SFI values were not adjusted for shear frame size (Reference Jamieson and JohnstonJamieson and Johnston, 1998).
2.3. Measurement of cohesion factor C and internal friction factor tanϕ
To investigate factors related to temporal SFI variations, SFI values in normal load conditions with added weight were also measured (Fig. 2). The weights were placed on the snow contained in the shear frame, and an acrylic plate was placed between the weights and the snow to spread the load uniformly. The acrylic plate did not come into contact with the shear frame (Fig. 3). Two weights with different masses were used. These masses combined with the mass of the acrylic plate were 93.8 and 167.4g and corresponded to normal loads of 37 and 65Nm–2, respectively. The weights were chosen arbitrarily and did not cause a compressive fracture of snow contained in the shear frame. However, the masses of the frame and the snow contained in the frame were ignored. The measured SFI values were then treated with the Mohr–Coulomb failure criterion to find the cohesion factor C and the internal friction factor tanϕ:

Fig. 2. SFI measurement using a weight placed on snow inside a shear frame.
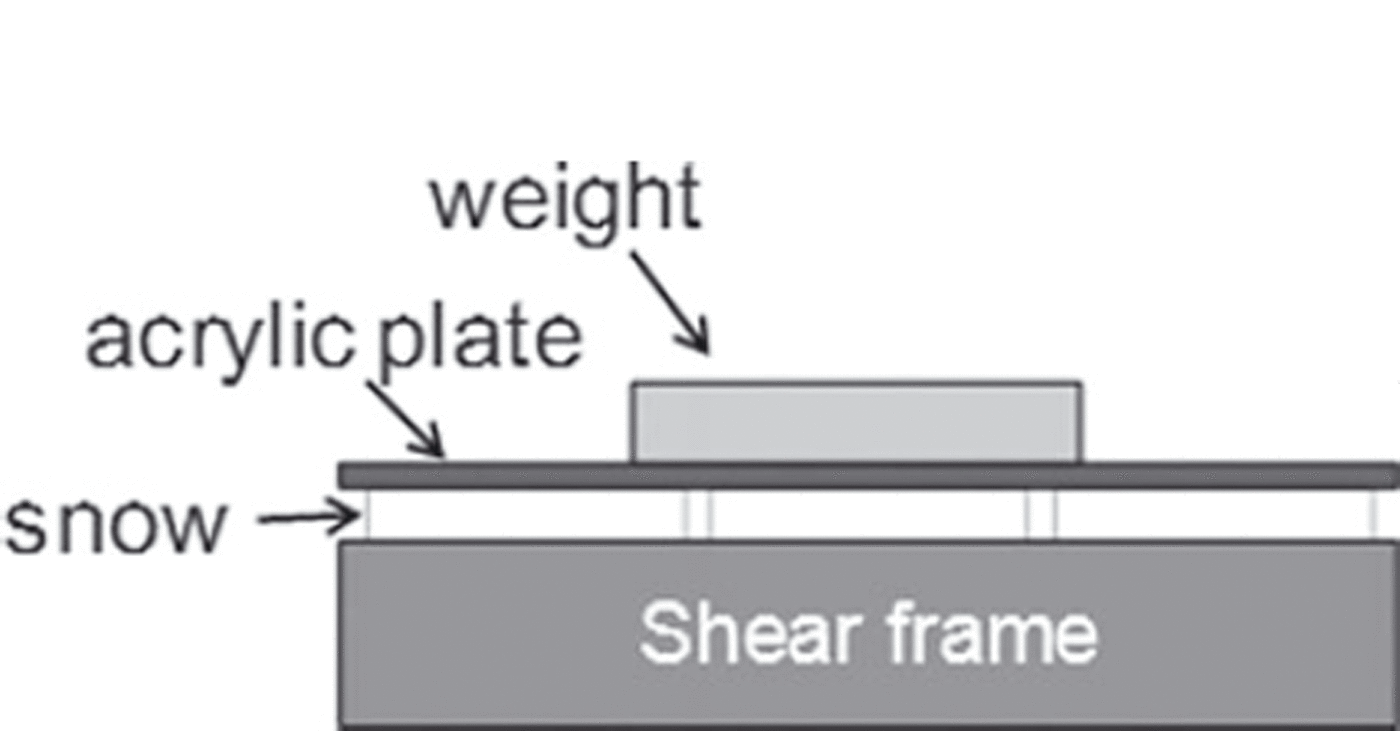
Fig. 3. Cross-sectional view of a weight placed on snow inside a shear frame.
where ∑ is the shear strength, regarded as equivalent to the SFI value, and σ is the normal load applied by the weight and the acrylic plate to the snow contained in the shear frame. If no weight is applied to the snow contained in the shear frame (σ=0), SFI become equal to C. Figure 4 shows examples of C and tanϕ found from the measurement values. As shown in Figure 4, regression analysis was conducted for the normal load σ applied by the weight and the SFI value. The intercept of the regression line represents C and its inclination represents tanϕ.
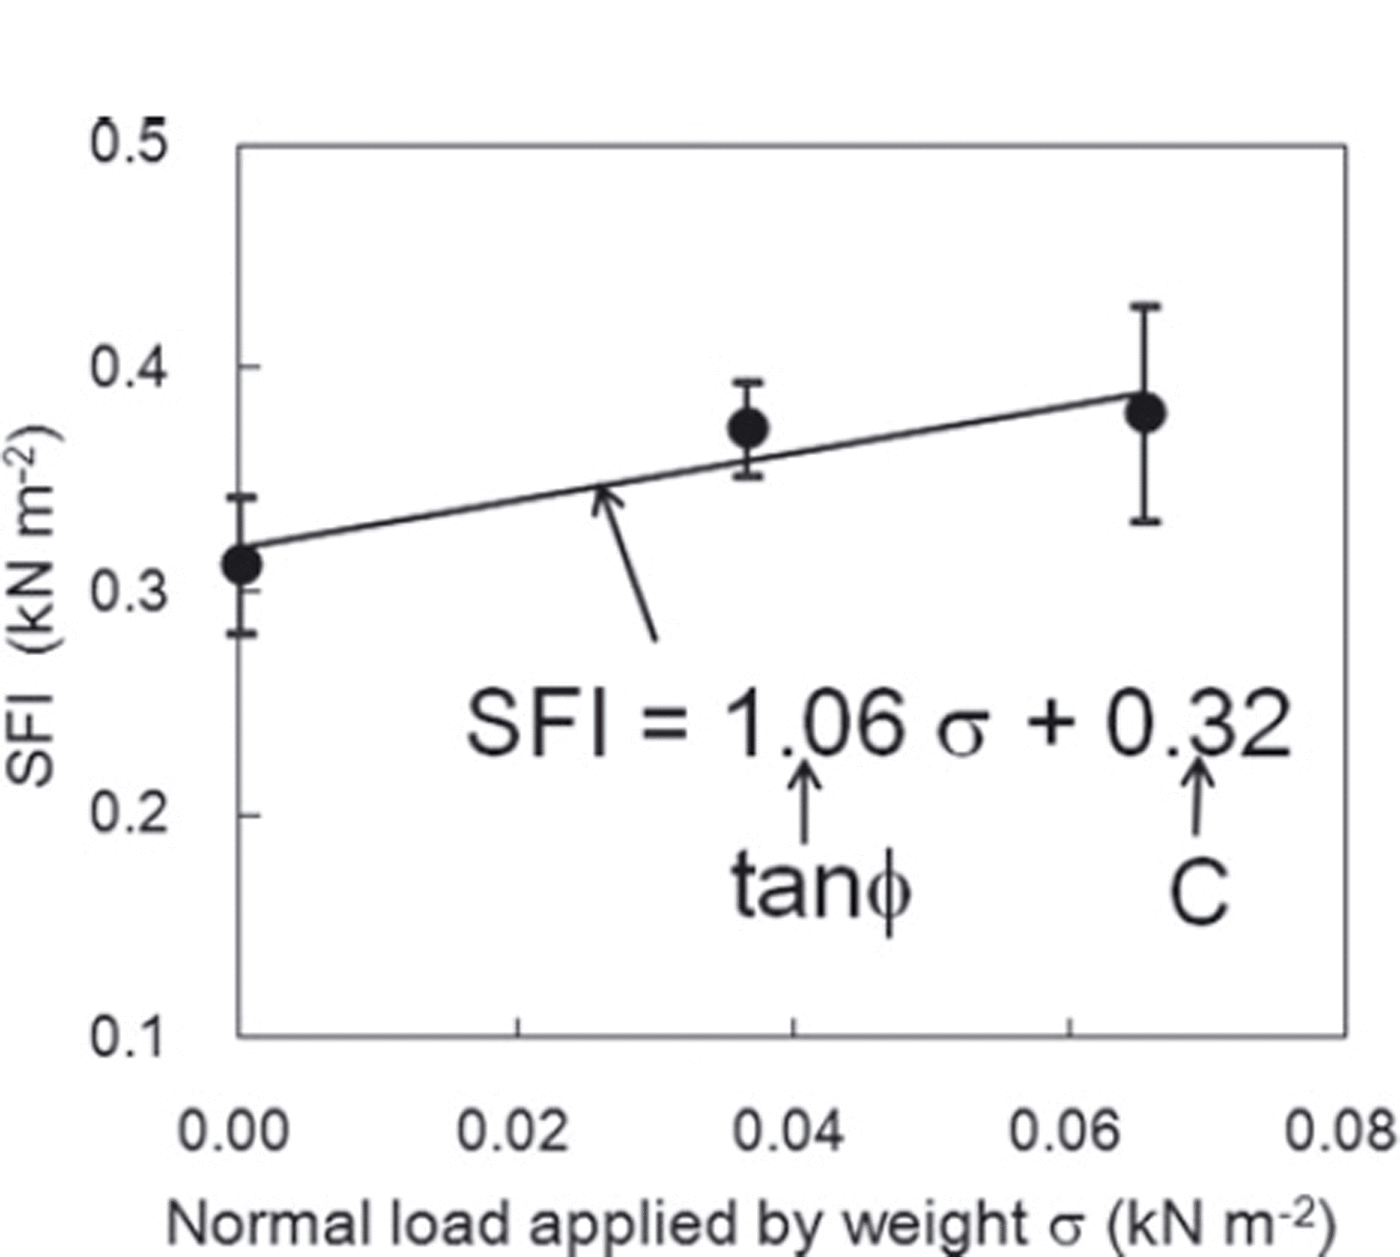
Fig. 4. Example of calculation for the cohesion factor C and the internal friction factor tanϕ. Regression analysis was conducted between normal load σ applied by the weight and SFI values, with the intercept of the line as C and the inclination of the line as tanϕ. The vertical bars for each plotted value represent the standard deviation of five measurements.
3. Results
3.1. Experimental conditions
Figure 5 shows snow temperature changes observed during the measurement period. The horizontal axis represents the time elapsed since the first measurement. The snow temperature shown by the first measurement immediately after snowfall was approximately –11˚C in both cases and then increased to approximately –4˚C in case H and –7˚C in case L within 24 hours. The snow temperature after 76 hours in case H (Fig. 5a) fell slightly to –7˚C because the environmental temperature was reduced in preparation for the next experiment. As the snow temperature was not consistent during the measurement period (Fig. 5), the mean snow temperatures for each layer (indicated by the lines in Fig. 5) were used in the analysis to evaluate the effect of temperature on temporal variations of SFI on average during the measurement period. In addition, although there was a difference of 2˚C between the lower layer and the two upper layers after 6 hours in case H, there was no significant temperature gradient within the snow in either case during the experiment.
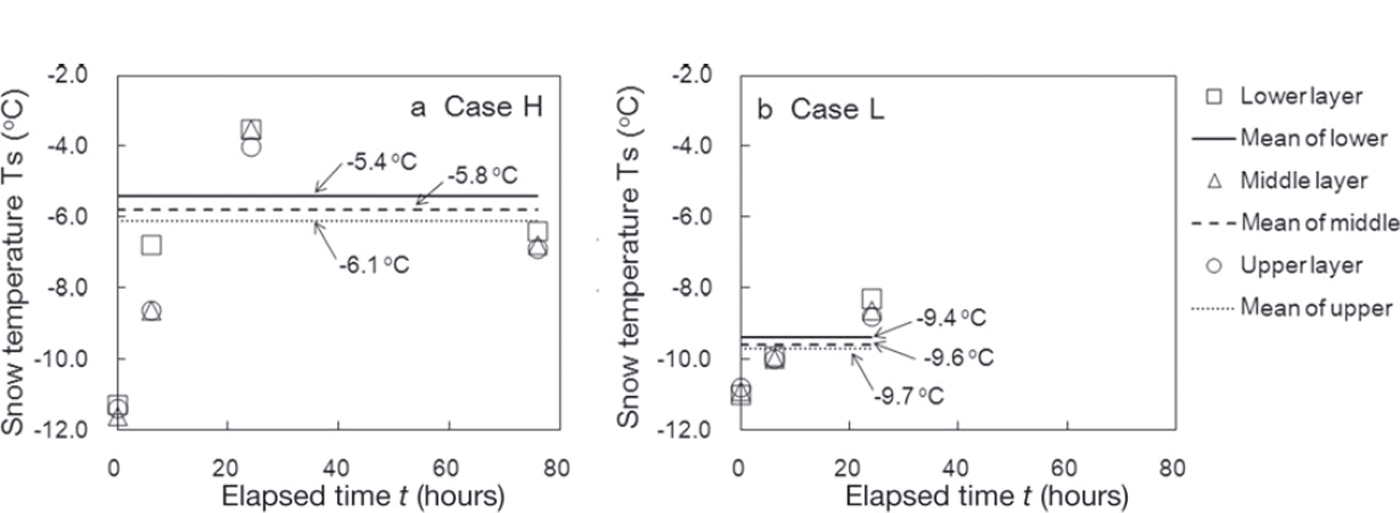
Fig. 5. Changes in snow temperature during the measurement period in (a) case H and (b) case L. The lines represent the mean snow temperature in each measurement layer.
Figure 6 shows normal load caused by overlying snow during the measurement period. The normal load for the lower layer after 24 hours in case H was not used in the analysis because it was lower than that shown by the other measurements. Although the measurements were taken under almost identical normal load conditions, the normal loads varied slightly. The lines in Figure 6 represent the mean values for normal load caused by overlying snow during the measurement period, and these values were used in the analysis to examine the effect of normal load caused by overlying snow on temporal variations of SFI on average during the measurement.
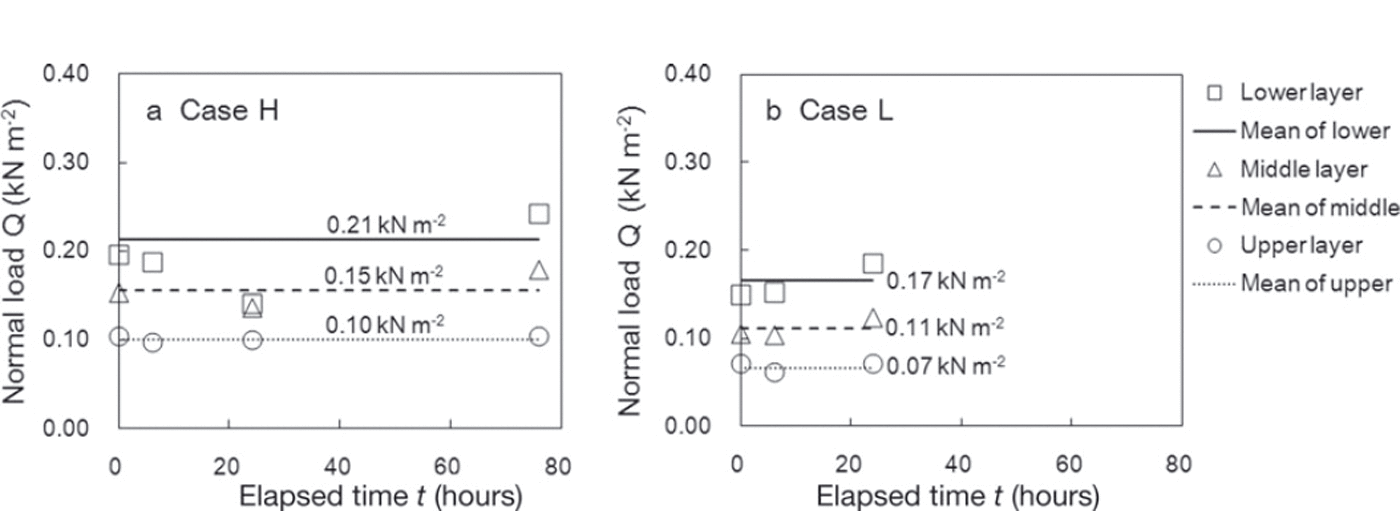
Fig. 6. Changes in normal snow load during the measurement period in (a) case H and (b) case L. The lines represent the mean of the normal load in each measurement layer.
3.2. Shear frame index (SFI)
Figure 7 shows temporal variations in measured SFI values along with regression lines for SFI and the time elapsed since the first measurements. All fracture snow surfaces in SFI measurements were flat, and snow between fins of the shear frame did not arc upwards. In both cases, the SFI increase rate (expressed by the inclination of the regression lines) was highest for the lower layer and lowest for the upper layer. The rate of SFI increase in case H, which had high snow temperatures, was higher than in case L, which had low snow temperatures. Figure 8 shows the relationships of the SFI increase rate with snow temperature and normal load caused by overlying snow. Figure 8 indicates that the rate increased with larger values of normal load and snow temperature, and to a lesser extent with snow temperature, for the range of load and snow temperature.
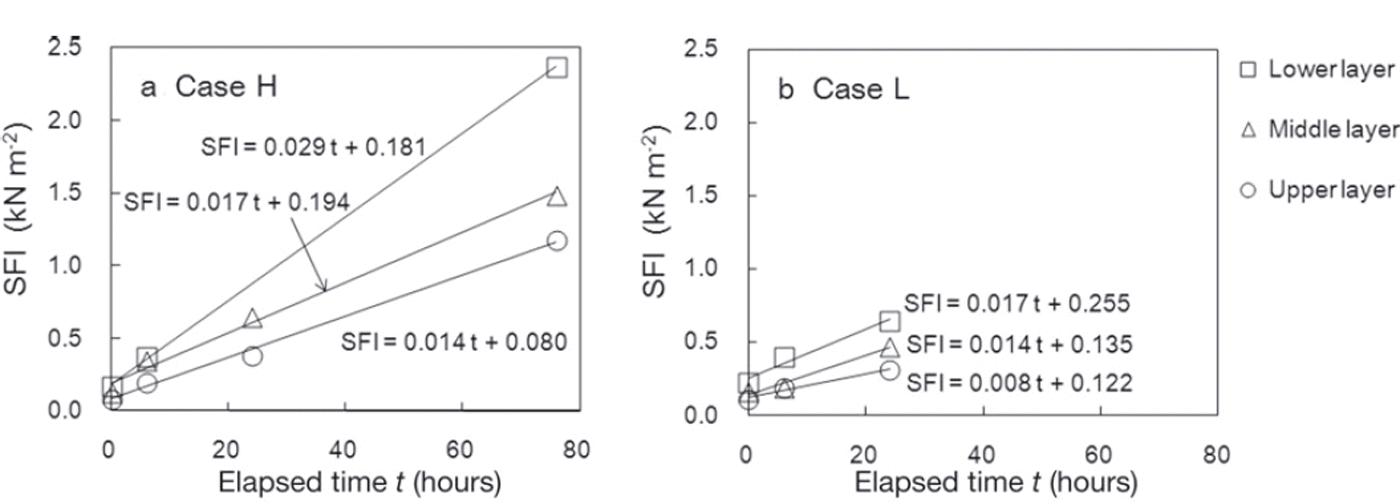
Fig. 7. Temporal variations of measured SFI in (a) case H and (b) case L. The solid lines are regression lines of SFI in each measurement layer based on the time elapsed since the first measurement.
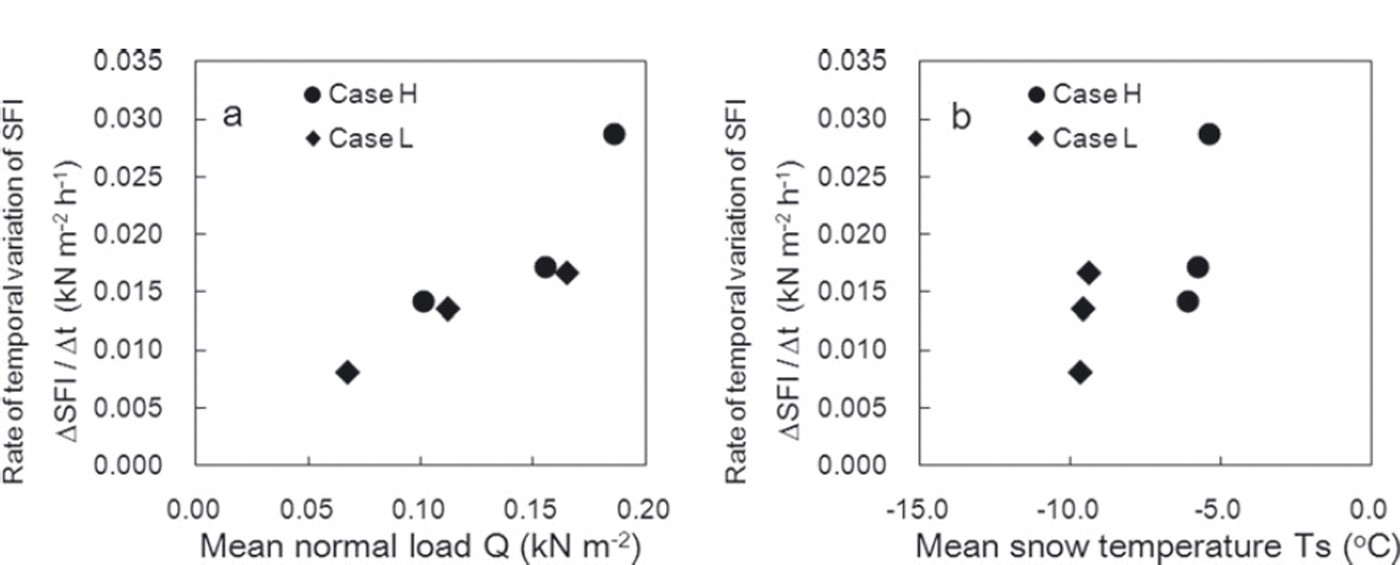
Fig. 8. Relationships between the rate of temporal variation in SFI and (a) normal load caused by overlying snow Q and (b) snow temperature T s.
The temporal variation of SFI values is also affected by snow density. Figure 9 shows the relationship between measured SFI values and snow densities in individual measurements and indicates that SFI increased with higher density in line with the relational expression proposed by Reference Yamanoi and EndoYamanoi and Endo (2002). Density during the measurement period ranged from 38.8 to 148.8kgm–3 for case H and from 34.5 to 82.1kgm–3 for case L. Figure 10 shows temporal variations in density. The measured densities were higher for the lower layer in both cases H and L. However, no significant difference in the rate of density increase (expressed by the inclination of the regression lines in Fig. 10) was seen in any observation layer. In addition, no clear correlation between the rate of SFI increase (ΔSFI/Δt) and the rate of density increase (Δρ/Δt) was found from this experiment.
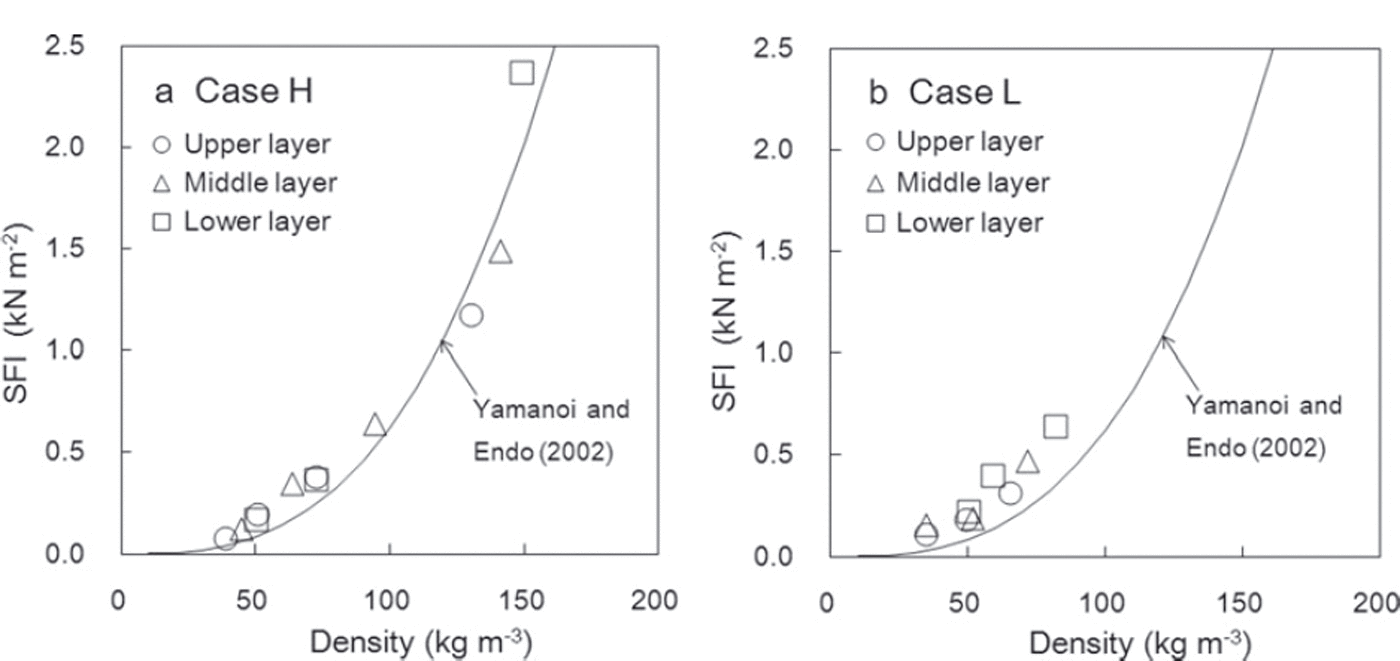
Fig. 9. Relationship between measured SFI and snow density in (a) case H and (b) case L. The solid line shows the relationship proposed by Reference Yamanoi and EndoYamanoi and Endo (2002).
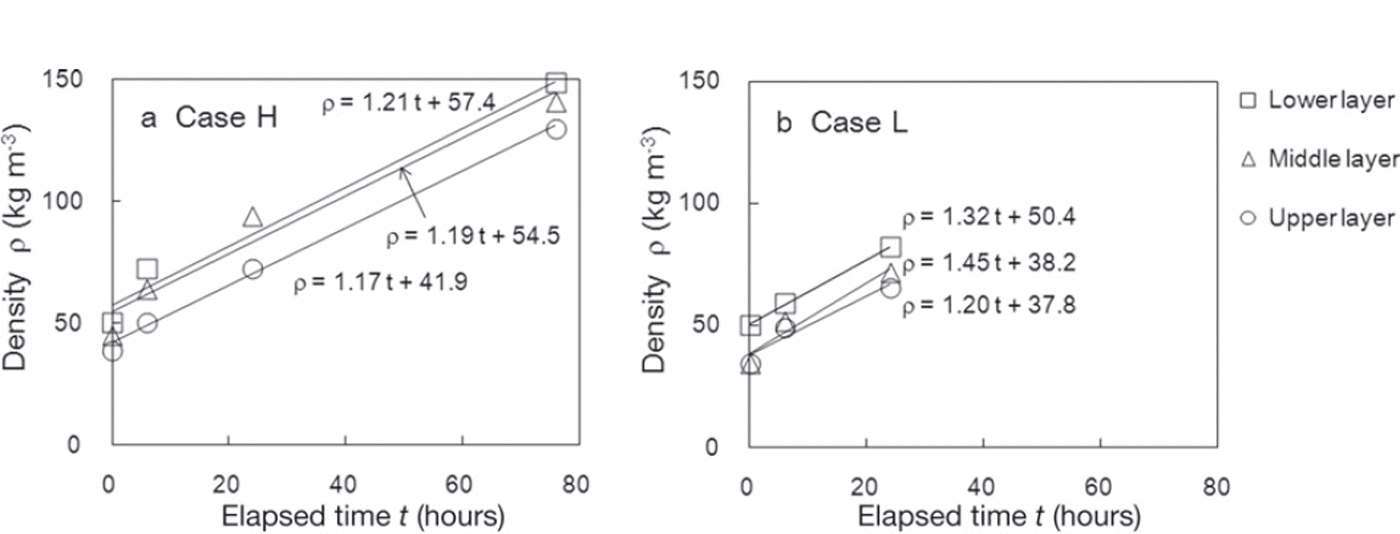
Fig. 10. Temporal variations of measured snow density in (a) case H and (b) case L. The solid lines are regression lines for density in each measurement layer based on the time elapsed since the first measurement.
3.3. Cohesion factor C
Figure 11 shows temporal variations in C. In case H, which had high snow temperatures, C increased earlier than in case L, which had low snow temperatures. The increase rate of the cohesion factor ΔC/Δt in both cases was higher for the lower layer, where a large normal load caused by overlying snow was applied. C exhibited the same trend of variation and similar values to the measured SFI values shown in Figure 7. It can therefore be concluded that C contributes significantly to increased SFI values. In addition, the increase rate of this factor ΔC/Δt (expressed by the inclination of the regression lines shown in Figure 11) is influenced by normal load caused by overlying snow and snow temperature and is the same as that for SFI values.
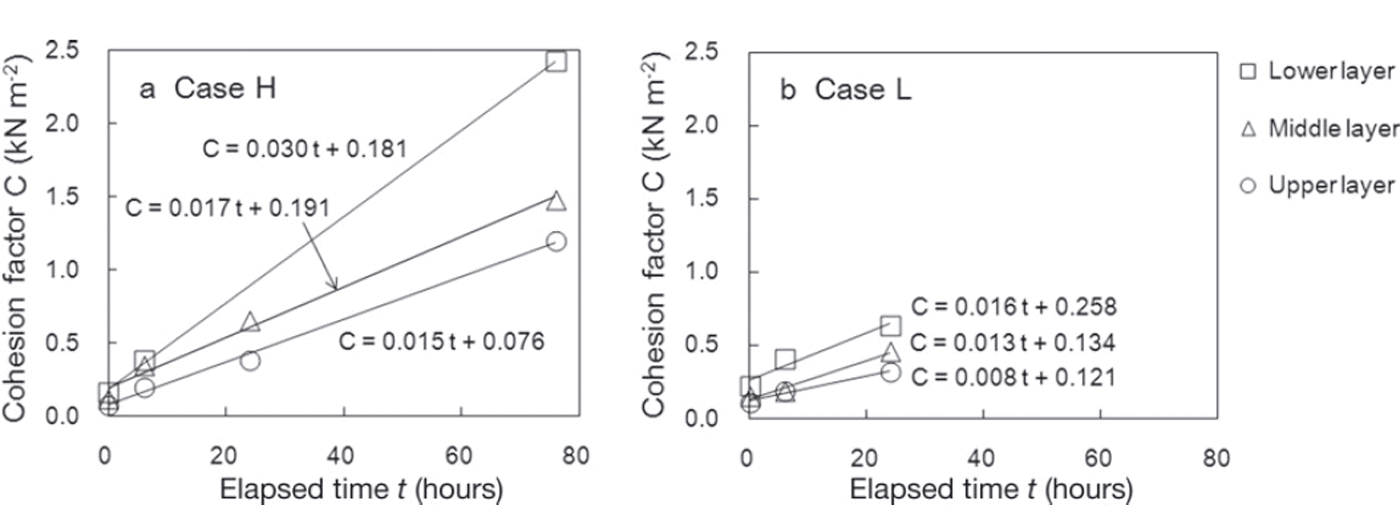
Fig. 11. Temporal variations in the cohesion factor C for each snow layer in (a) case H and (b) case L. The solid lines are regression lines for C based on the time elapsed since the first measurement.
3.4. Internal friction factor tanϕ
Figure 12 shows temporal variations in tanϕ and also presents regression lines for this factor in relation to the amount of time elapsed. However, the third measurement value for the middle layer in case H was excluded from the analysis because it deviated significantly from the other values. As shown in Figure 12, tanϕ increases or decreases depending on the snow layer. In case L, which had low snow temperatures, tanϕ increased in all three measurement layers. In case H, which had high snow temperatures, although tanϕ for the upper layer increased in the same way as for case L, tanϕ in the middle and lower layers decreased over time.
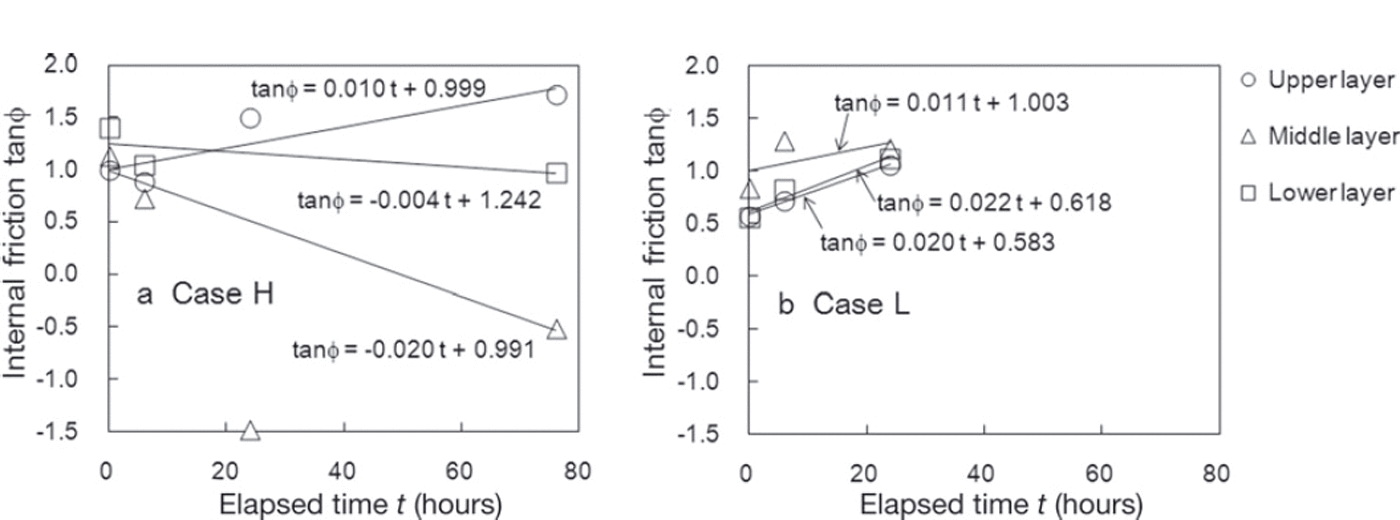
Fig. 12. Temporal variations in the internal friction factor tanϕ in (a) case H and (b) case L. The solid lines are regression lines for tanϕ in each measurement layer based on the time elapsed since the first measurement.
4. Discussion
4.1. Cohesion factor C
The cohesion factor C contributes significantly to increased SFI values, and increase rateΔC/Δt (Fig. 11) is influenced by normal load caused by overlying snow and snow temperature. To further investigate this matter, multiple regression analysis was conducted with the rate of variation ΔC/Δt as an objective variable and with the snow temperature T s and the normal load caused by overlying snow Q as explanatory variables. The analysis yielded the regression equation
Figure 13 shows a comparison of ΔC/Δt estimated from Eqn (2) and the measured values. The correlation coefficient between the values was 0.956, with a significance level of 95%, and the values show a close correlation. Figure 14 illustrates the relationships of ΔC/Δt with normal load caused by overlying snow Q and snow temperature T s calculated using Eqn (2). The measurement values obtained in this experiment are also shown in Figure 14. The values estimated from Eqn (2) correspond closely to the measured values. Figure 14 shows that high normal load caused by overlying snow and snow temperature induced a high variation rate in the cohesion factor ΔC/Δt.
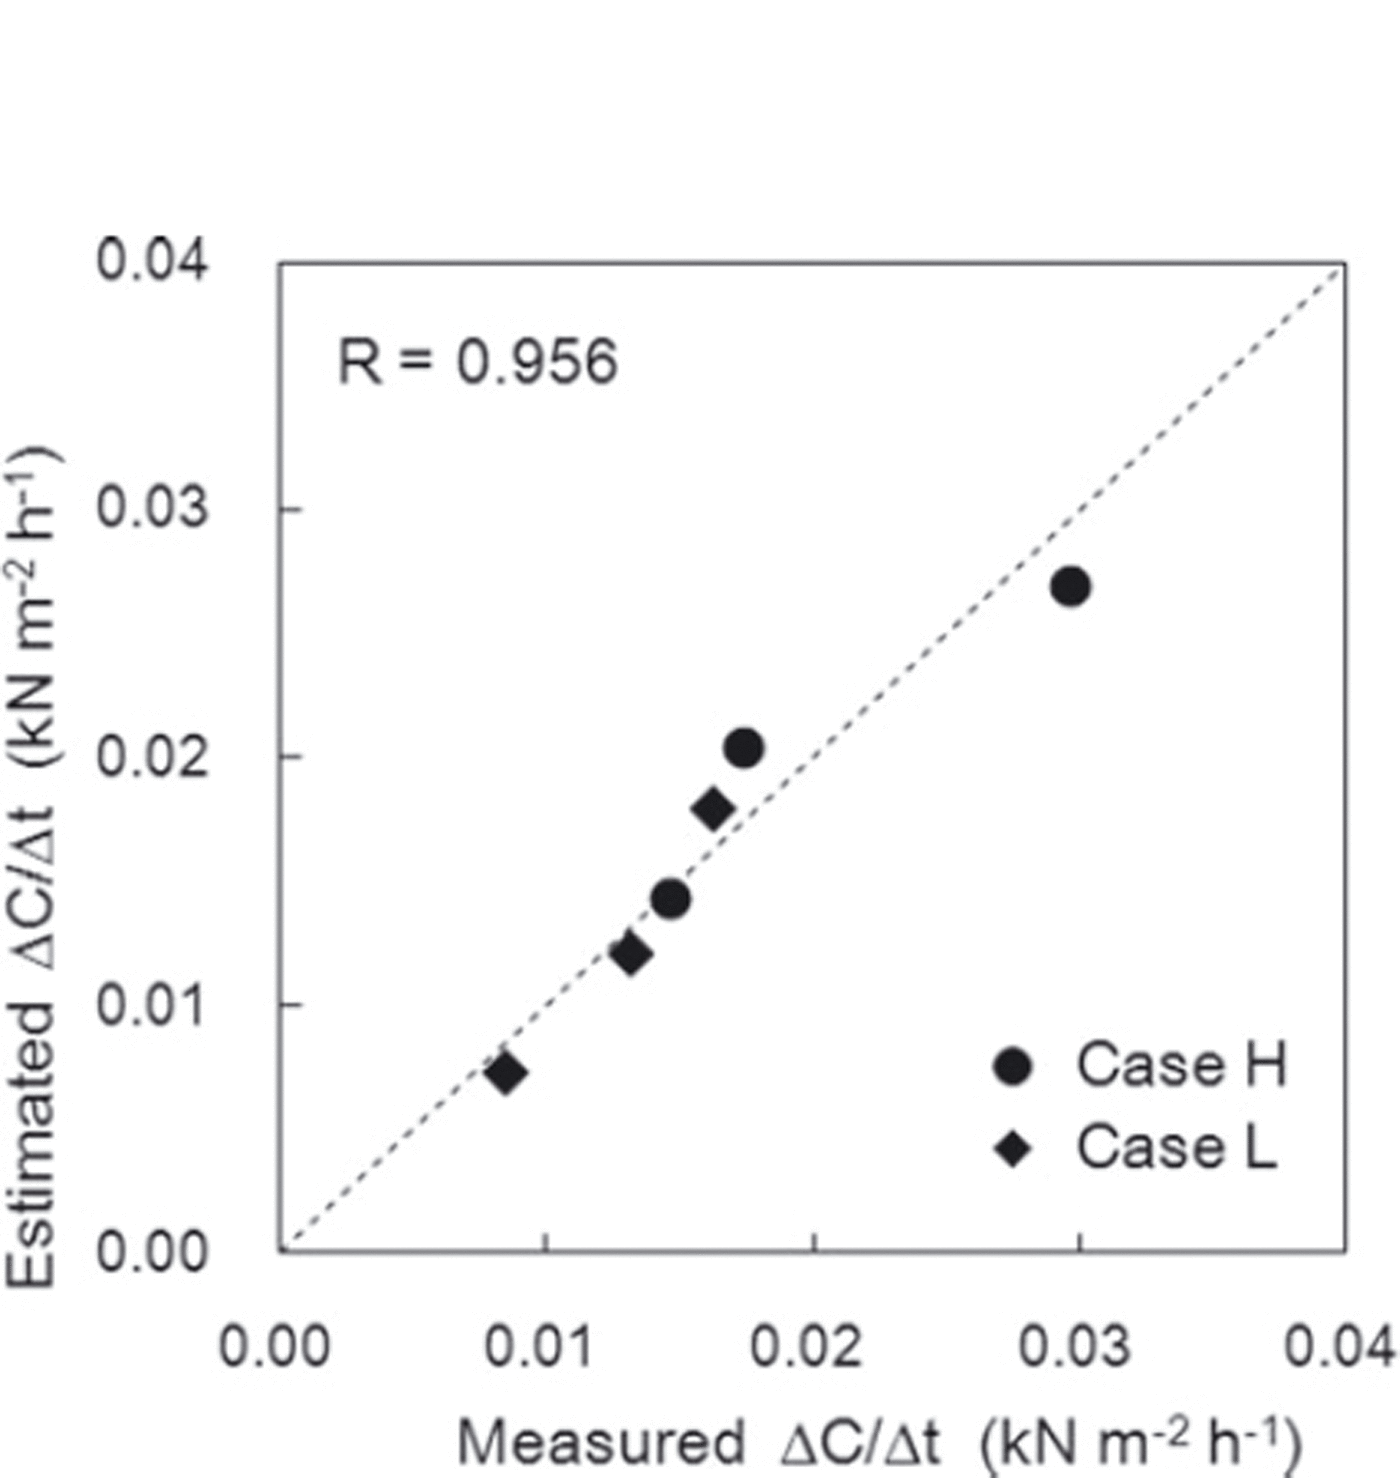
Fig. 13. Comparison of the measured rate of temporal variation in the cohesion factor ΔC/Δt and values estimated using Eqn (2). The correlation coefficient r is 0.956.
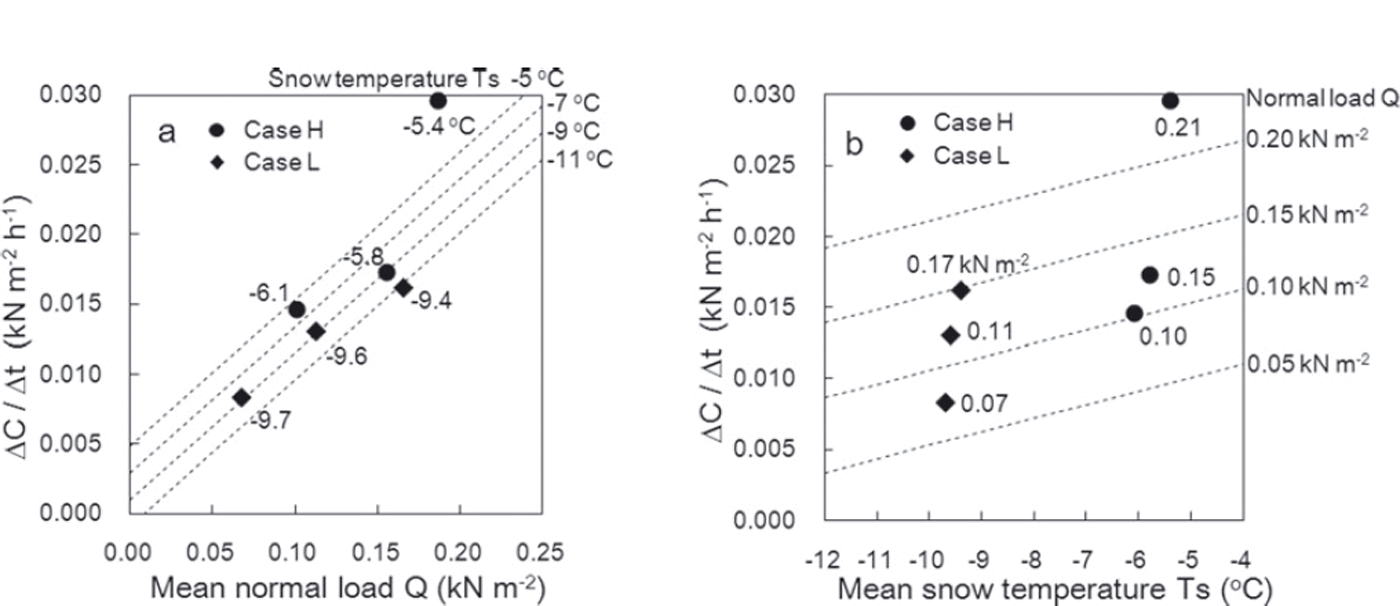
Fig. 14. Relationships of the rate of temporal variation in the cohesion factor ΔC/Δt with (a) normal load caused by overlying snow Q and (b) snow temperature T s. The numbers attached to the plots are measurements, and the dotted lines represent estimations obtained from Eqn (2).
An increase in C can be regarded as creating a stronger bond between snow grains as a result of sintering and other processes. Therefore, the dependence of ΔC/Δt on snow temperature is attributable to the sintering that develops at higher temperatures. Its value also increases in conditions of high normal loading caused by overlying snow because the contact area between snow grains increases due to compression, thereby promoting the development of bonds between grains. The standardized partial regression coefficients for normal load caused by overlying snow Q and snow temperature T s in Eqn (2) were 0.73 and 0.27, respectively. Therefore, in this experiment normal load caused by overlying snow was found to contribute more significantly to increased ΔC/Δt values than did snow temperature.
4.2. Internal friction factor tanϕ
To investigate the influences of normal load caused by overlying snow and snow temperature on the trend of tanϕ (Fig. 12), multiple regression analysis was conducted, with the rate of variation Δtanϕ/Δt (expressed by the inclination of the regression lines shown in Fig. 14) as an objective variable, and with the snow temperature T s and the normal snow load caused by overlying snow Q as explanatory variables. The analysis yielded the regression equation:
Figure 15 shows a comparison of the rate of variation Δtanϕ/Δt estimated from Eqn (3) and the measured values. The correlation coefficient between the values was 0.785, with a significance level of 95%. Figure 16 shows the relationships of the variation rate Δtanϕ/Δt with the normal load caused by overlying snow Q and the snow temperature T s. The measurement values obtained in this experiment are also presented in Figure 16. Although the values estimated from Eqn (3) did not always agree with the measured values, a trend whereby larger normal loads caused by overlying snow and higher snow temperatures corresponded to lower values of Δtanϕ/Δt was seen. The standardized partial regression coefficients for normal load caused by overlying snow and snow temperature in Eqn (3) were 0.13 and 0.87, respectively. It can therefore be concluded that the variation of Δtanϕ/Δt strongly depended on snow temperature within the conditions of this experiment.
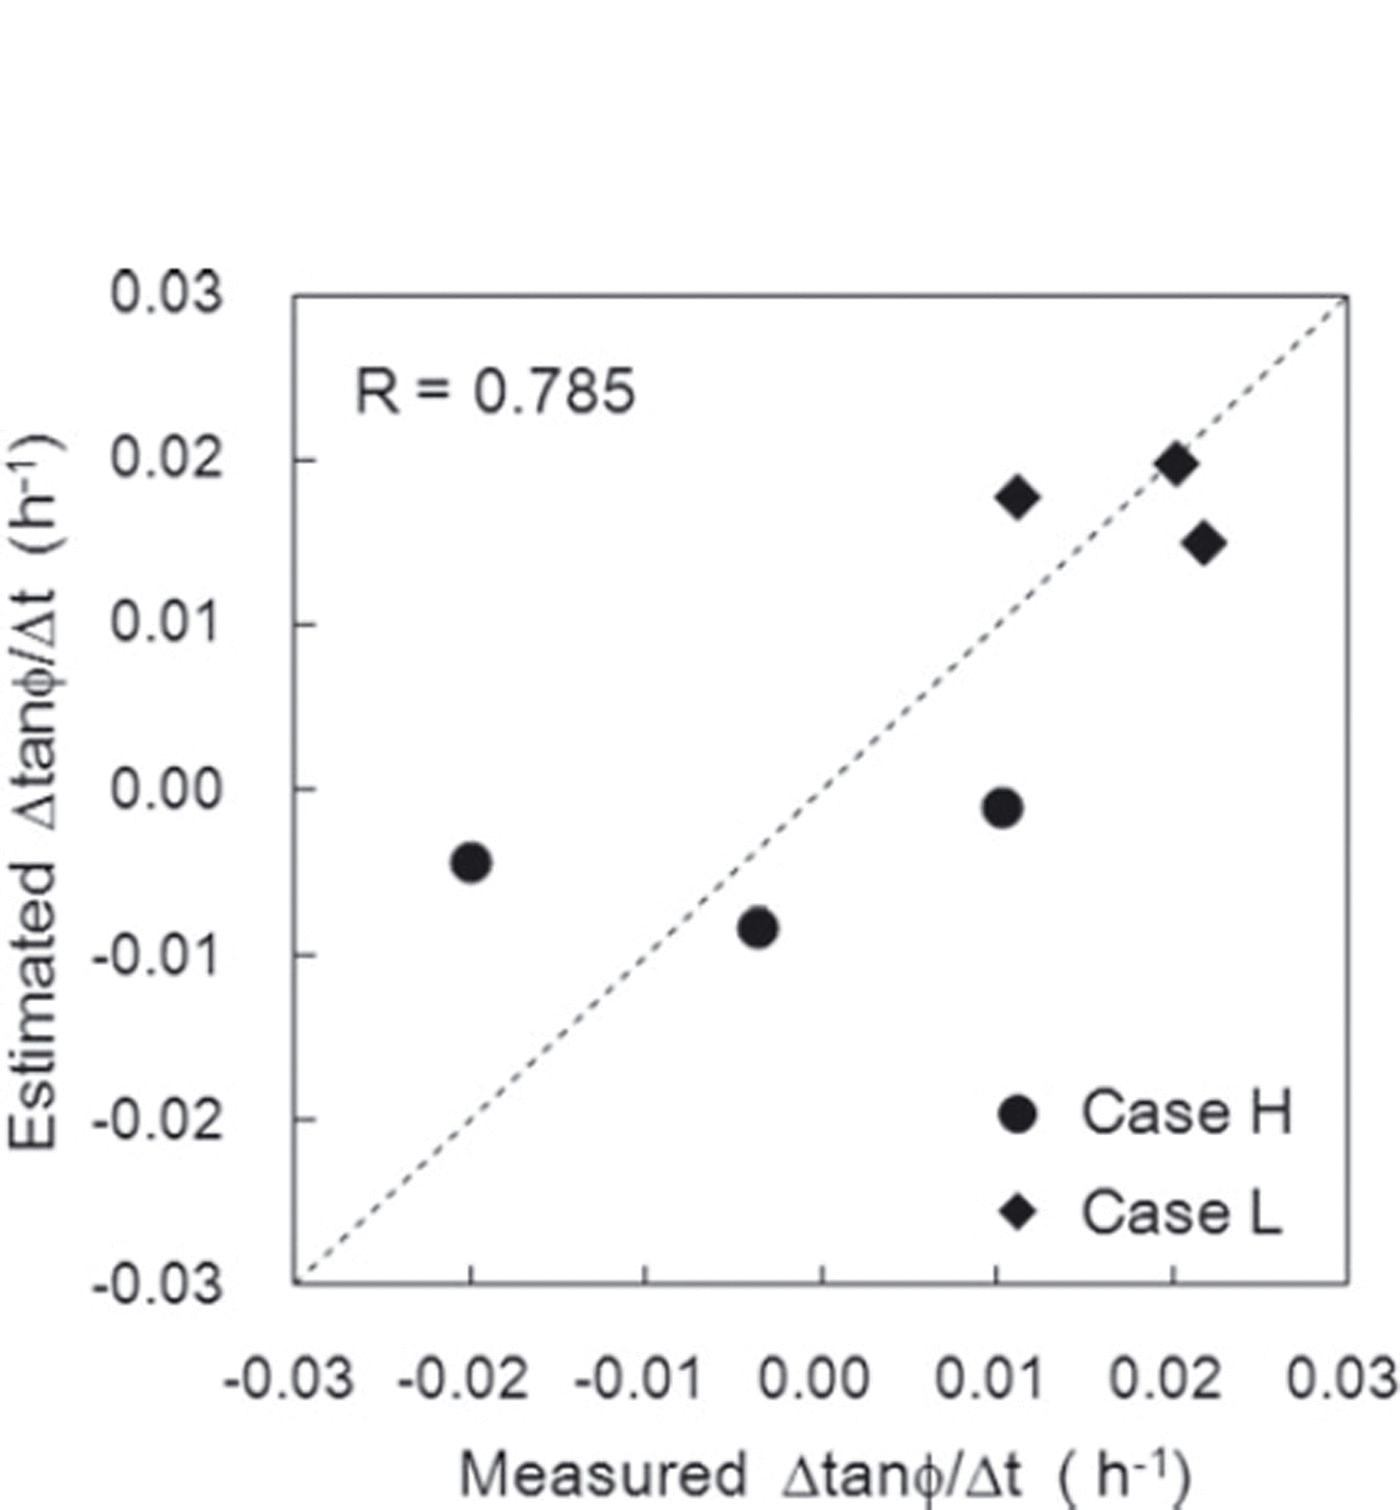
Fig. 15. Comparison of the measured rate of temporal variation in the internal friction factor Δtanϕ/Δt and values estimated using Eqn (3). The correlation coefficient r is 0.785.
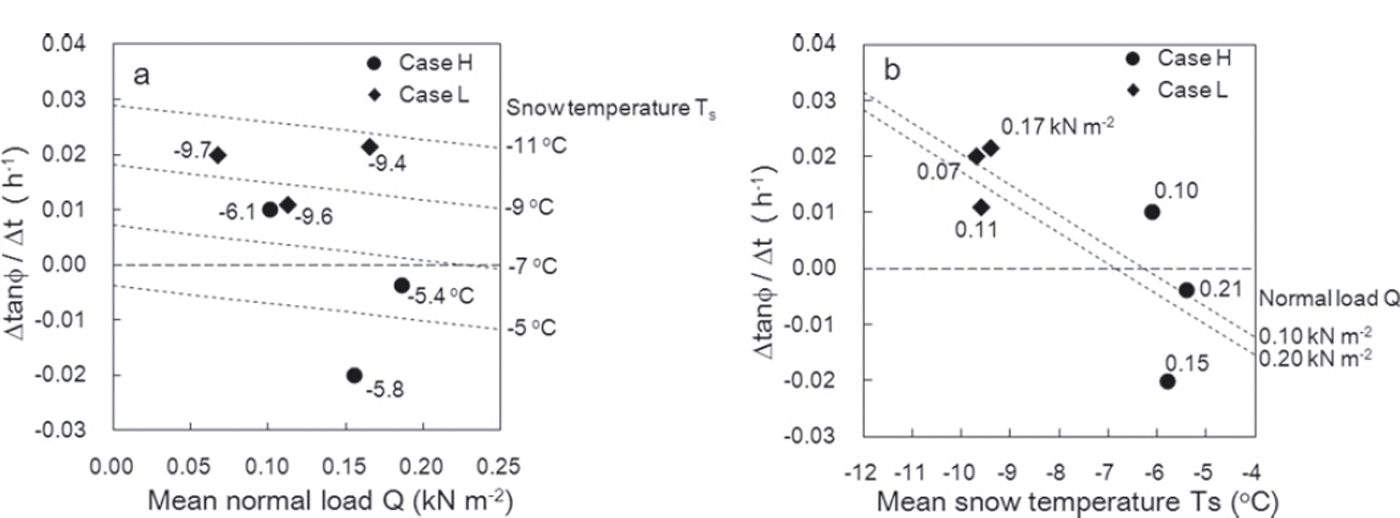
Fig. 16. Relationships of the rate of temporal variation in the internal friction factor Δtanϕ/Δt with (a) normal load caused by overlying snow Q and (b) snow temperature T s. The numbers attached to the plots are measurements, and the dotted lines represent estimations obtained from Eqn (3).
In the process of snow densification at low snow temperatures, it is likely that snow crystals interlock more tightly as they become packed but maintain their dendritic morphology. This is one reason for the higher Δtanϕ/Δt values seen at lower snow temperatures. It also suggests that the extent to which the removal of overlying snow affects normal load in SFI measurements for snow consisting of precipitation particles should be considered in low-temperature conditions. In contrast, at high snow temperatures the effect of tanϕ is probably reduced because bonds between snow grains develop and the grains become rounded. Based on the results estimated from Eqn (3) as shown in Figure 16b, a snow temperature of about –6˚C represents the borderline between positive and negative values for Δtanϕ/Δt.
5. Conclusions
An experiment using artificial snow consisting of dendritic crystals was conducted to investigate the influences of normal load caused by overlying snow and snow temperature on temporal variations in the shear strength of snow consisting of precipitation particles. The shear strength, temperature and weight of the overlying snow were measured at three different depths in the accumulated snow. For the measurement of shear strength, the SFI value was found using a shear frame with an area of 0.025m2. In addition, to find the snow cohesion factor C and the internal friction factor tanϕ, the SFI measurements were also taken by placing weights with different masses on the snow contained in the frame and treated with the Mohr–Coulomb failure criterion.
The results showed similar trends for SFI and C values by which their rate of increase over time was greater with higher snow temperatures and normal load caused by overlying snow. This indicates that the cohesion factor C contributes significantly to increased SFI values. It is possible that increases in C are caused by strengthened bonds between snow grains.
Temporal variations in the internal friction factor Δtanϕ/Δt depended mainly on snow temperature. In particular, tanϕ decreased over time with higher snow temperatures and increased with lower snow temperatures. In low-temperature conditions it is likely that snow crystals interlock more tightly as they become packed but maintain their dendritic morphology. This suggests that the extent to which the removal of overlying snow affects normal load in SFI measurements should be considered for snow consisting of precipitation particles in low-temperature conditions.
Acknowledgements
We thank Shigeto Mochizuki and Genzo Okawa at the Shinjo branch of NIED’s Snow and Ice Research Center for their support in this experiment.We also thank two reviewers for constructive comments and helpful suggestions.


