


Introduction
Depression affects approximately 7% of people in the US each year (Ferrari et al., Reference Ferrari, Charlson, Norman, Patten, Freedman, Murray and Whiteford2013) and is among the most-commoncauses of disability in the world, with a lifetime prevalence higher than 20% (Kessler et al., Reference Kessler, Berglund, Demler, Jin, Merikangas and Walters2005). Depression is chiefly characterized by abnormalities in emotional processing, with alterations in positive emotion (e.g. anhedonia) central to its clinical presentation and perhaps the most challenging feature of depression to effectively treat. These facts highlight the need to understand the specific computational drivers of emotional abnormalities in depression to enhance etiological models and interventions (Maia, Huys, & Frank, Reference Maia, Huys and Frank2017).
Recent developments in computational affective science have begun to identify the drivers of emotion. Both the value of an event (i.e. how good or bad the event is) as well as how surprising the event was drive emotional responses (Eldar, Rutledge, Dolan, & Niv, Reference Eldar, Rutledge, Dolan and Niv2016). How surprising an event was can be defined as the degree to which the event's outcome value differed from what was expected and is referred to as the prediction error (PE). While some evidence suggests that PEs drive emotion to a larger degree than the outcome value (Rutledge, Skandali, Dayan, & Dolan, Reference Rutledge, Skandali, Dayan and Dolan2014; Villano, Otto, Ezie, Gillis, & Heller, Reference Villano, Otto, Ezie, Gillis and Heller2020) it is clear that both outcome value and PE signals are critical for driving emotional responses, leading theorists to suggest that abnormalities in PE or value based signaling may underlie affective disorders such as depression (Huys, Daw, & Dayan, Reference Huys, Daw and Dayan2015).
Yet, most computational psychiatry research has not found differences in the affective impact of outcome value or PE by depression. For instance, individuals with depression rate the pleasantness (value) of rewarding gustatory and olfactory stimuli similarly to healthy controls (Atanasova et al., Reference Atanasova, El-Hage, Chabanet, Gaillard, Belzung and Camus2010; Dichter, Smoski, Kampov-Polevoy, Gallop, & Garbutt, Reference Dichter, Smoski, Kampov-Polevoy, Gallop and Garbutt2010; Pause, Miranda, Göder, Aldenhoff, & Ferstl, Reference Pause, Miranda, Göder, Aldenhoff and Ferstl2001). Moreover, while some evidence suggests that depressed individuals learn differently from PEs relative tocontrols (Pulcu & Browning, Reference Pulcu and Browning2019), individuals with depression rate the hedonic impact of positive PEs as no different from nondepressed counterparts (Rutledge et al., Reference Rutledge, Moutoussis, Smittenaar, Zeidman, Taylor, Hrynkiewicz and Dolan2017). This lack of differentiation in the literature begs the question of why have computational models failed to identify differences in the emotional impact of value or PE for individuals with depression.
One reason why computational research thus far has failed to identify differential drivers of emotion in depression may be due to the lack of ecologically valid paradigms (Eldar & Niv, Reference Eldar and Niv2015; Mobbs, Trimmer, Blumstein, & Dayan, Reference Mobbs, Trimmer, Blumstein and Dayan2018) that assess emotion and its drivers surrounding personally meaningful events (Ferrante et al., Reference Ferrante, Redish, Oquendo, Averbeck, Kinnane and Gordon2019; Maia et al., Reference Maia, Huys and Frank2017; Scholl & Klein-Flügge, Reference Scholl and Klein-Flügge2018). Whereas the typical lab-stimuli used in computational tasks (decisions to gamble for points or fractions of a dollar) induce brief and fleeting affective reactions, emotional reactions to real-world, personally meaningful events last for minutes to hours (Frijda, Mesquita, Sonnemans, & van Goozen, Reference Frijda, Mesquita, Sonnemans and van Goozen1991). Moreover, diathesis-stress models of depression suggest that psychiatric disorders emerge from just these types of events that cause persistent emotional reactions (Abramson, Metalsky & Alloy, Reference Abramson, Metalsky and Alloy1989). Thus, using personally meaningful events as the ‘inductors’ of emotion and sampling the subsequent emotion timecourse in the real-world may be needed to test existing models of affect and advance computational psychiatry.
Here, we took advantage of a recurrent, highly meaningful, and personally impactful event – the receipt of midterm exam grades in introductory Chemistry courses – to better understand the basis of emotional dysregulation in depression (Fig. 1). Relative to the trivial financial outcomes typically employed in laboratory-based computational psychiatry studies, real-world midterm exam grades can substantially impact the lives of undergraduate students. Indeed, we demonstrated in prior work that unexpected exam grades in introductory college courses alter positive and negative emotion on the order of hours (Villano et al., Reference Villano, Otto, Ezie, Gillis and Heller2020). Moreover, in high-stakes academic tracks, introductory-level courses like the Chemistry classes we studied serve as ‘weed-out’ or ‘gateway’ courses, wherein low grades often disqualify students from pursuing their chosen academic and career paths. Indeed, for the students we sampled, failure to obtain a passing grade in introductory Chemistry after two attempts can disqualify them from the remaining on the premedical academic track. Thus, grades in these classes not only dictate students’ academic standing, but also the viability of their longer-term goals outside of the classroom. To that end, in 687 introductory Chemistry students, we used ecological momentary assessment (EMA) to test whether drivers of emotion including outcome value (grade) and grade PE are linked to emotional dysregulation in depression (Fig. 1).
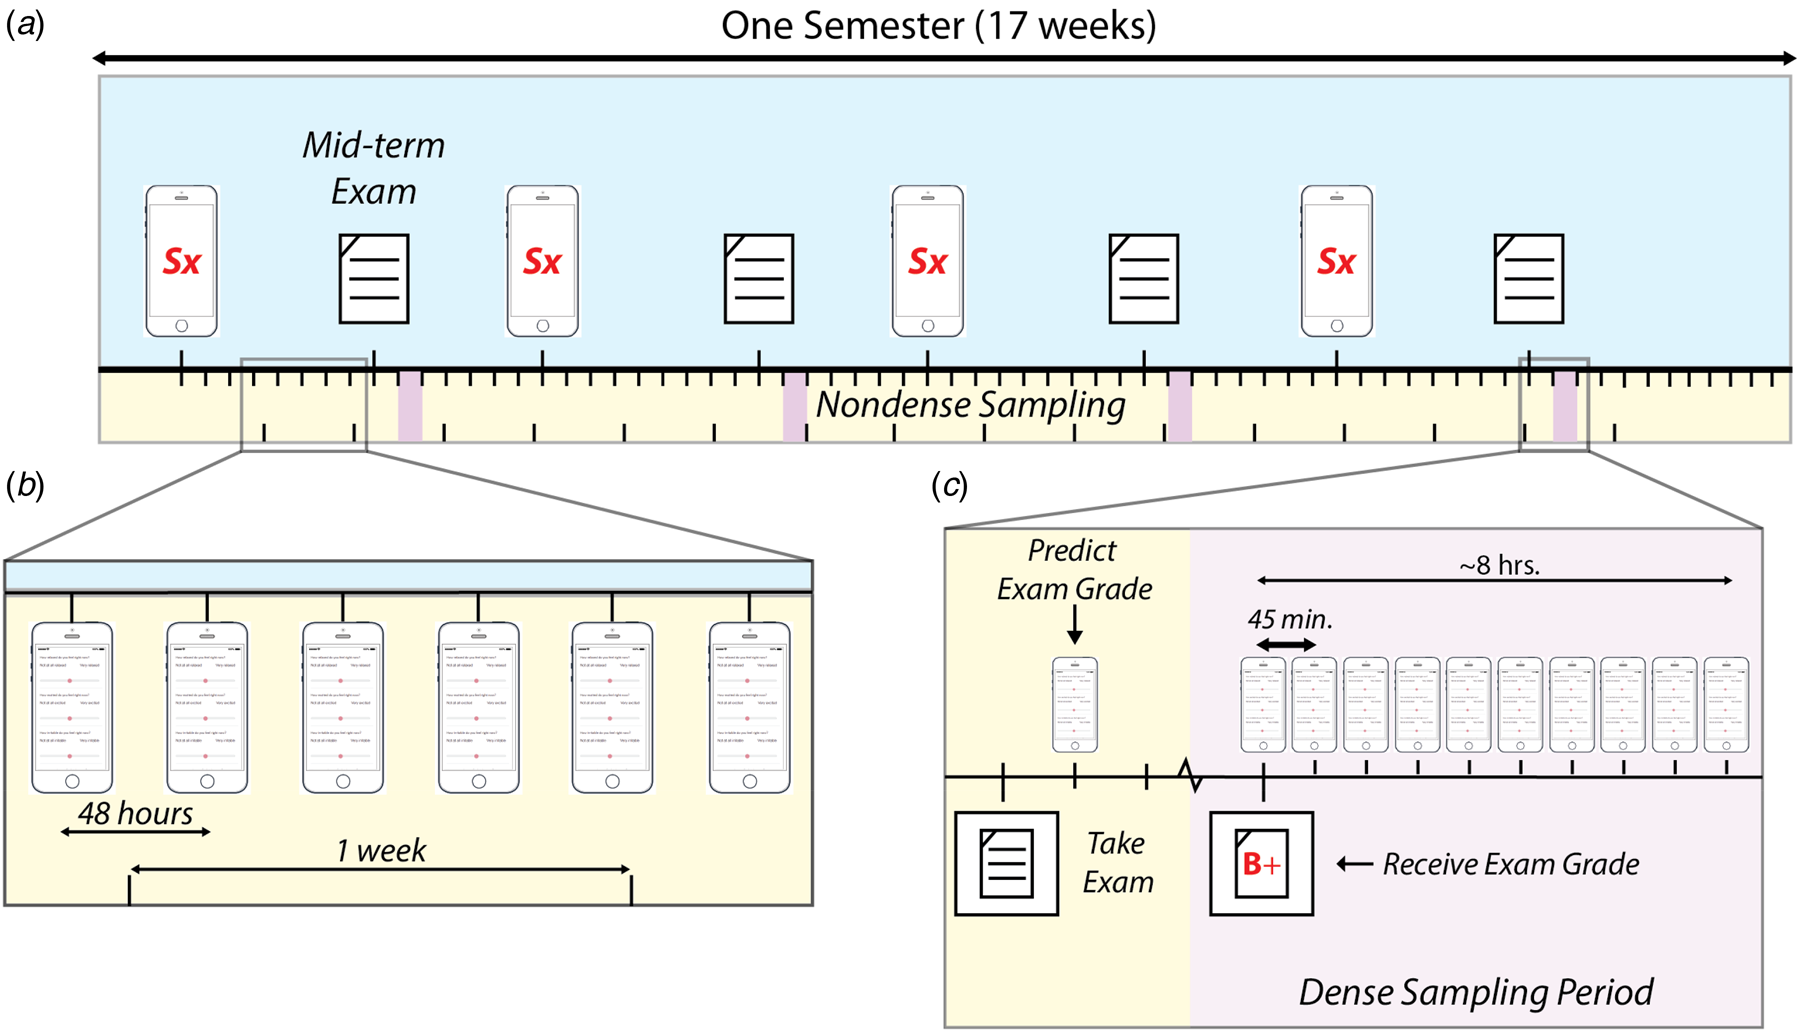
Figure 1. Study design. (a) Individuals completed measures of depression and generalized anxiety symptoms intermittently throughout the semester, in between exams. (b) Individuals completed measures of current affect every other day throughout the semester (‘nondense’ sampling). (c) After taking exams, individuals predicted their exam grade. Upon viewing their exam grade a ‘dense sampling period’ was initiated, whereby subjects completed measures of current emotion every 45 min for the ensuing 8 h. Grade prediction errors are computed as the difference between predicted grade and actual grade.
Methods
Participants
Participants were undergraduate students enrolled in general and organic chemistry courses at the University of Miami. Over three semesters, we recruited 724 participants (Mage = 19.32, SDage = 1.43, 539 females) to participate in a 17-week, semester long EMA study to assess positive and negative affect (PA, NA). No apriori power analysis was performed before beginning data collection. The authors collected as many subjects as possible in each of the four semesters and these data were used in this study.
Instruments
The positive and negative affect schedule - expanded form. (PANAS-X)
The PANAS-X (Watson and Clark, Reference Watson and Clark1999) is a self-report measure that assesses current levels of positive and negative emotion (PA; NA). The scale asks participants to rate how much they feel in response to certain adjectives. The current study selected a subset of items from the original PANAS-X scale to sample momentary affect. We selected a subset of items that sampled across the dimensions of affective valence and arousal. For PA, items were: ‘Happy,’ ‘Excited,’ ‘Relaxed,’ ‘Content,’ and ‘Attentive,’ for NA, items were: ‘Sad,’ ‘Tired,' ‘Stressed,’ ‘Anxious,’ ‘Upset,’ and ‘Irritable’. Subjects used a visual analog scale that ranged from 0 (Not at all) to 100 (Very).
Generalized anxiety disorder. (GAD-7)
Items assessed the frequency of seven primary generalized anxiety symptoms across the last 2 weeks (Spitzer, Kroenke, Williams, & Löwe, Reference Spitzer, Kroenke, Williams and Löwe2006). Item responses range on a scale from 0 (not at all) to 3 (nearly every day). In our sample, Cronbach's alpha = 0.91.
Patient health questionnaire. (PHQ-9)
Nine items assessed the frequency of depression symptoms over the last 2 weeks using a scale from 0 (not at all) to 3 (nearly every day (Spitzer, Kroenke, Williams, & and the Patient Health Questionnaire Primary Care Study Group, Reference Spitzer, Kroenke and Williams1999). In our sample, Cronbach's alpha = 0.86.
Procedure
At the start of semesters, participants completed an initial laboratory visit where they provided informed consent, their contact information (cell phone number). Participants completed psychopathology symptom questionnaires, including the PHQ-9 and the GAD-7. Participants were incentivized to participate in this study with extra course credit. The amount of extra credit was proportional to EMA survey completion rates.
EMA
Participants received SMS messages at two different sampling rates. On average, participants responded to 81.56 EMA surveys (s.d. = 28.62) with an average response rate of 71.75% (Fig. 1).
Sampling Rate 1: ‘Nondense Sampling’. For nondense (i.e. nonburst) data collection, participants received an SMS message every 2 days, sent randomly between 10 am and 8 pm. The text messages contained a personalized Qualtrics link. The messages were generated via in-house software built on a FileMaker platform, which was connected to the SMS messaging service, Twilio, to automate the schedule and sending of SMS messages.
Sampling Rate 2: ‘Dense Sampling’. Participants were also sent survey links more frequently (every 45 min for 8.25 h, equaling out to approximately 11 surveys per dense sampling period) upon viewing of their exam grades (Villano et al., Reference Villano, Otto, Ezie, Gillis and Heller2020). On average, there were four exams per semester, and thus students participated in up to four dense-sampling periods per Chemistry course. Students were instructed to complete dense sampling surveys as soon as they received them.
EMA response processing
EMA survey responses were removed if the time spent on each survey item was ≤1 s, a within-survey standard deviation ⩽5, or percent responses at the modal value ⩾60% (as recommended in Jaso, Kraus, and Heller, Reference Jaso, Kraus and Heller2021). Responses that took longer than 5 min to complete were removed. Out of the 95 913 survey responses we collected, 4588 (4.78%) responses were removed.
Momentary positive affect
PA scores were computed from survey responses as the average response to items assessing ‘Happy,’ ‘Excited,’ ‘Relaxed,’ ‘Content,' and ‘Attentive,’ whereas NA scores were computed as the average response to items assessing the emotions ‘Sad,' ‘Tired,' ‘Stressed,' ‘Anxious,’ ‘Upset,’ and ‘Irritable’. Because PA is the focus of the paper, we report associations with PA here (see supplemental results for NA).
To compare affective responses to exam grade outcomes while accounting for individual differences in participants’ unique affective baselines, we centered participants’ momentary affect scores to the average of their affect scores collected during nondense sampling – that is, outside of the times when they were acutely reacting to exam grades. Moreover, to represent momentary affect as a percent change relative to a participant's baseline affect, we computed a second measure of momentary affect in which dense PA scores were scaled (i.e. z-scored) to each participant's unique mean and standard deviation of nondense PA. This transformation construes momentary deviations from baseline affect in units of standard deviations, which are easily converted to percentiles.
To assess the temporal dynamics of emotion after seeing exam grades, we used the timestamps of EMA response as a moderator in analyses. For each EMA response during the burst sampling period, we computed the number of minutes since viewing the exam grade. We created 30-minute response time bins by dividing number of minutes since viewing the exam grade by 30.
Midterm exam grade outcomes
Because participants’ final grades in these gateway Chemistry courses were determined primarily by their grades on midterm exams, and further owing to the fact that low final grades can impede participants’ academic and career goals (e.g. practicing medicine), exam grades were highly salient, and the release of these grades was considered a significant affective event. During the initial laboratory visit, participants authorized the study team to receive their midterm grades from course professors. Exam grades were provided by professors shortly (2–4 days) after exams were taken, but before they were posted online. All courses required students to complete at least four midterm exams per semester.
Exam grade expectations
Within 30 min of the completion of exams, participants were prompted via SMS to report the grade they expected to receive on that exam. Participants entered their grade expectation (numeric responses between 0 and 100) into a survey text box. Participants were automatically prompted to re-enter their expected grade if the response was not within the specified range.
Release of midterm exam grade outcomes
Unlike most laboratory studies in which stimuli are presented to participants with a predetermined timing, subjects were able to decide when they would view their exam grade. Participants were notified via SMS that their grades were ready to be viewed and to view exam grades, participants clicked on the URL they received. This led them to a webpage requesting they enter their contact information (last name and cell phone number). This information was automatically cross-referenced with our participant database and subjects were redirected to a webpage containing their exam grade (e.g. ‘You received a 75% on the most-recent chemistry exam’).
Exam grade prediction errors
Exam grade PEs were computed as the difference between participants’ expected exam grade and the actual grades received. PEs greater than 50 or less than −50 were removed prior to testing change of mood models. A total of 13 (0.47%) observations were removed with PEs greater than 50 or less than −50.
Depression and anxiety symptoms
Depression and anxiety symptoms, using the PHQ-9 and GAD-7, respectively, were assessed at multiple timepoints throughout the semester. During the initial lab session and every 10 days after each ‘dense sampling period,’ participants reported depression and anxiety symptoms. These symptom scores were lagged, such that the symptoms reported during initial lab session was used in the models for exam 1 and that the scores 10 days after the ‘dense sampling period’ for exam 1 were used in the models for exam 2, etc. Because both depression and anxiety symptoms were positively skewed, we square root transformed the symptom scores. 687 participants completed the PHQ-9, and 616 participants completed the GAD-7 at least once during the study, which limited the final sample sizes for depression and anxiety-related analyses, respectively (see Table 1 for demographic information for the final analysis sample).
Table 1. Demographic information and descriptive statistics for final analysis sample
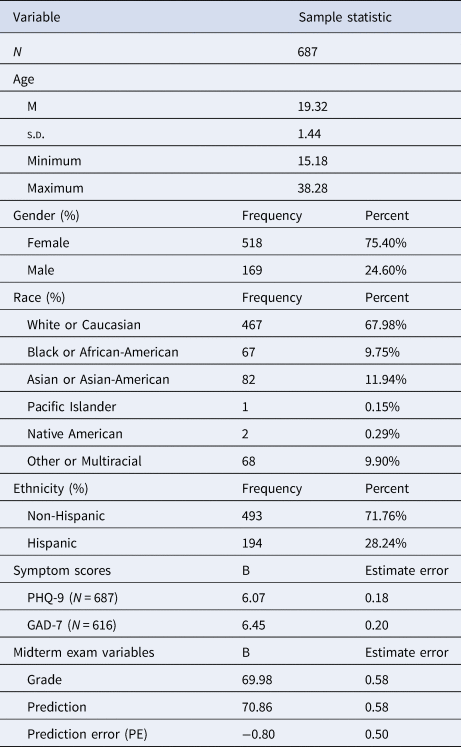
Note: Distribution of demographic variables, symptom scores, and exam-related variables for the final sample used in depression-related analyses. Of the 616 participants who provided anxiety scores via the GAD-7, one participant did not provide depression scores via the PHQ-9 and was not included in the final sample for depression-related analyses.
Statistical modeling
Overview
Multilevel models were conducted in R programming language (R Core Team, 2020), using the brms package (Bürkner, Reference Bürkner2021) with priors of mean = 0 and s.d. = 1. Varying intercepts and slopes were included to account for dependencies in observations within participants. For model fitting, we ran two Markov Chain Monte Carlo chains, each with 4000 iterations. The models converged adequately, with Rhat = 1 (Vehtari, Gelman, Simpson, Carpenter, & Bürkner, Reference Vehtari, Gelman, Simpson, Carpenter and Bürkner2021) and estimated effective sample sizes of at least 1000. For model parameter estimates, we computed 95% credible interval (95% CI). Effects were considered different from zero if the 95% CIs for parameter estimates did not include zero. We estimated the posterior probability (PP) that the effect was in the hypothesized direction. Higher PP values, ranging from 0–1, imply more evidence for the effect in the specified direction. All models included exam number as a factor to permit variance in statistical effects across the semester.
Do individual differences in depression predict the temporal dynamics of emotion?
We formally tested affective models of depression to determine which features of high-stakes, personally impactful affective events may be linked to symptoms. We and others have demonstrated that emotion is driven by both the value and the PE associated with event outcomes (Eldar & Niv, Reference Eldar and Niv2015; Otto & Eichstaedt, Reference Otto and Eichstaedt2018; Villano et al., Reference Villano, Otto, Ezie, Gillis and Heller2020). Thus, we tested whether the time course of PA differed as a function of depression symptoms, moderated by exam grade or grade PE. In one model, we regressed the time course of dense emotion (either PA or NA) onto a three-way interaction of time × depression × PE. In a second model, we replaced PE with exam grade (i.e. outcome value) – that is, a competing driver of emotional responses. In all models, exam number was included as a covariate to permit variance in statistical effects across the semester.
In addition to the aforementioned linear models, we fit additional models using tensor splines to permit nonlinearities in the timecourse of PA. Given that spline models do not provide parameter estimates to quantify differences between depressed and non-depressed individuals, we used these models to follow up on non-zero effects revealed through linear modeling. To confirm that our findings from linear models were also present when modeling PA nonlinearly, we computed Cohen's d as a metric of the differences in PA between depressed and non-depressed individuals.
Are effects specific to depression?
To determine whether effects were specific to depression, we performed the identical analyses, replacing depression with generalized anxiety symptoms.
Results
Distribution of depression and anxiety symptoms
Mean depression score was 6.07 (Estimate Error [EE] = 0.18; Table 1), whereas mean generalized anxiety score was 6.45 (EE = 0.20). According to cutoff scores (Spitzer et al., Reference Spitzer, Kroenke and Williams1999), 251 (36.54%) subjects qualified for moderate or greater depression and 216 (35.06%) subjects qualified for moderate or greater anxiety at one point during the semester (Spitzer et al., Reference Spitzer, Kroenke, Williams and Löwe2006).
Distribution of exam grade expectations and PEs
Across all exams and pooling variance within participants, the average grade expectation was 70.86 (EE = 0.58), and the average exam grade was 69.98 (EE = 0.58). The average PE was −0.80 (EE = 0.50), indicating that participants generally overestimated their performance on exams. These exam-related variables also varied with depression symptom scores: participants with higher levels of depression reported lower exam grade expectations (B = −0.39 (0.17); 95% CI −0.72 to −0.05), scored marginally lower on exams (B = −1.64 (0.18); 95% CI −2.01 to −1.30), and had slightly more negative PEs (B = −1.17 (0.18); 95% CI −1.54 to −0.82), in aggregate.
Emotional responses to exam grades persist on the order of hours
Prior work investigating the computational bases of emotion relies primarily on small, unexpected financial outcomes to elicit emotional responses. These sorts of outcomes have little bearing on participants’ lives, and thus, fail to produce changes in emotion beyond the timescale of seconds to minutes (Rutledge et al., Reference Rutledge, Skandali, Dayan and Dolan2014). We specified a Bayesian model with tensor splines to permit nonlinearity (e.g. exponential decay) in the timecourse of emotion, and fit this model to the emotion data for all participants (including participants who did not provide depression scores; N = 702). We found that a PE of +15 predicted an initial increase in PA equivalent to 0.711 standard deviations (SDs) – that is, approximately a 26% increase in PA relative to one's baseline (Fig. 2). After receiving such a positive PE, model predictions indicated that PA regressed exponentially towards baseline, but remained elevated even after 7.5 h (0.137 s.d., approximately 5% above baseline). Remarkably, a negative PE of equivalent magnitude (i.e. PE = −15) had an even greater effect on PA, predicting a 47% decrease (−1.94 s.d.) in PA at the moment one viewed their grade, and after 7.5 h, PA remained attenuated by approximately 24% (−0.652 s.d.) below baseline. These results mirror our findings in a different university course (Villano et al., Reference Villano, Otto, Ezie, Gillis and Heller2020), and confirm that unexpected exam grades have a lasting impact on the time course of emotion. Overall, larger PEs produced greater and more enduring perturbations relative to participants’ respective emotional baselines (i.e. average daily emotional state); perturbations that lasted for several hours at a time.
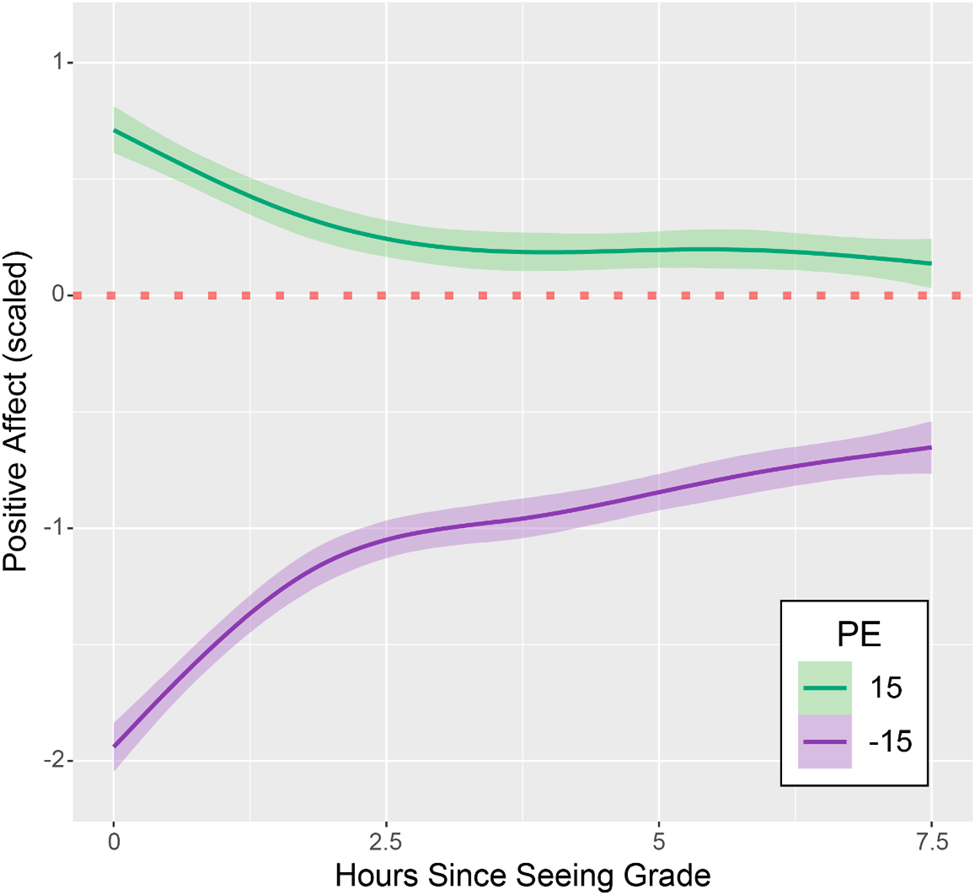
Figure 2. Negative prediction errors shift affect more than positive prediction errors. Model-predicted PA response to a positive PE of 15 is plotted in green, and the predicted PA response to a negative PE of −15 is plotted in purple. Relative to positive PEs of similar magnitude, negative PEs drive larger and more enduring perturbations from baseline PA. PA timecourses displayed here are scaled within participants, such that zero represents a participant's baseline PA, and a score of 1 represents a 1 s.d. increase in a participant's PA above baseline.
Depression impacts emotional responses to prediction errors
There is ongoing theoretical debate concerning the computational drivers of attenuated positive affect in depression. While it has been argued that reduced PA in depression may be due specifically to impairments in positive emotional responses to positive PEs, empirical assessments of this hypothesis have been equivocal (e.g. Rutledge et al., Reference Rutledge, Moutoussis, Smittenaar, Zeidman, Taylor, Hrynkiewicz and Dolan2017). Thus, our first model predicted variation in positive emotion following high-stakes events as a function of depression, time since viewing grade and PE. This model revealed that individuals with higher levels of depression exhibited blunted PA reactivity to PEs (B = 0.00456 (0.00168); 95% CI 0.00121–0.00797; PP = 1.00; Evidence ratio = 199; online Supplemental Figure S1; Table 2). When accounting for time, depression also moderated the relationship between PEs and PA responses (B = −0.07958 (0.01578); 95% CI −0.11026 to −0.04918; PP = 1.00; Evidence ratio = Inf), indicating that over the course of the dense sampling period in aggregate, depressed and non-depressed individuals differed in their PA responses to PEs of similar magnitude and valence (i.e. positive v. negative PE). Further, the rate (i.e. slope) of the return to baseline emotion was greater for larger PEs, with negative PEs having a steeper slope than positive PEs (B = −0.04501 (0.00449); 95% CI −0.05387 to −0.03628; PP = 1.00; Evidence ratio = Inf). This suggests that all else being equal, larger PEs had a more lasting effect on emotion.
Table 2. Estimated effects of time, exam grade prediction errors, depression scores, and exam number on positive affect
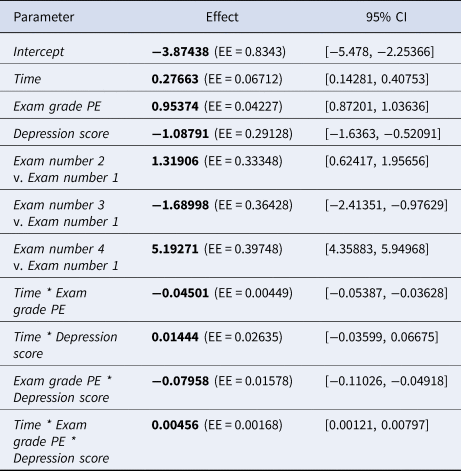
Note: Depression Scores were square-root transformed, and Time was transformed to 30-minute bins. Exam number was dummy coded with exam number 1 as the reference level. EE = Estimate Error, 95% CI = 95% credible interval, * = interaction.
We next tested whether the blunted emotional reactivity to PEs in individuals with depression was also observed as a function of outcome values (defined here as the grade itself). In this model, we replaced PE with grade as a predictor of emotion. This model revealed no differences in the impact of the outcome value on the timecourse of emotion as a function of depression symptoms (B = −0.0015 (0.00125); 95% CI −0.00406 to 0.00093; PP = 0.88; Evidence ratio = 7.51; online Supplemental Figure S1; online Supplemental Table S1). This suggests that emotional dysregulation in depression is due to aberrant PE signaling and not differences in the emotional impact of outcome values.
To further explore how the timecourse of emotion varied between depressed and nondepressed participants, we fit a series of models with tensor splines, which allowed us to flexibly model nonlinearities in the timecourse of PA. We fit two separate spline models: (1) a model including the three-way interaction between grade PE, depression symptoms, and time, and (2) an identical model in which grade PE was replaced with the exam grade outcome (i.e. grade × depression × time). In line with the preceding linear results, visual inspection of the conditional effects from these spline models suggested that depressed individuals differed preferentially from non-depressed individuals in their emotional responses to PEs, and not exam grades themselves (Fig. 3a).
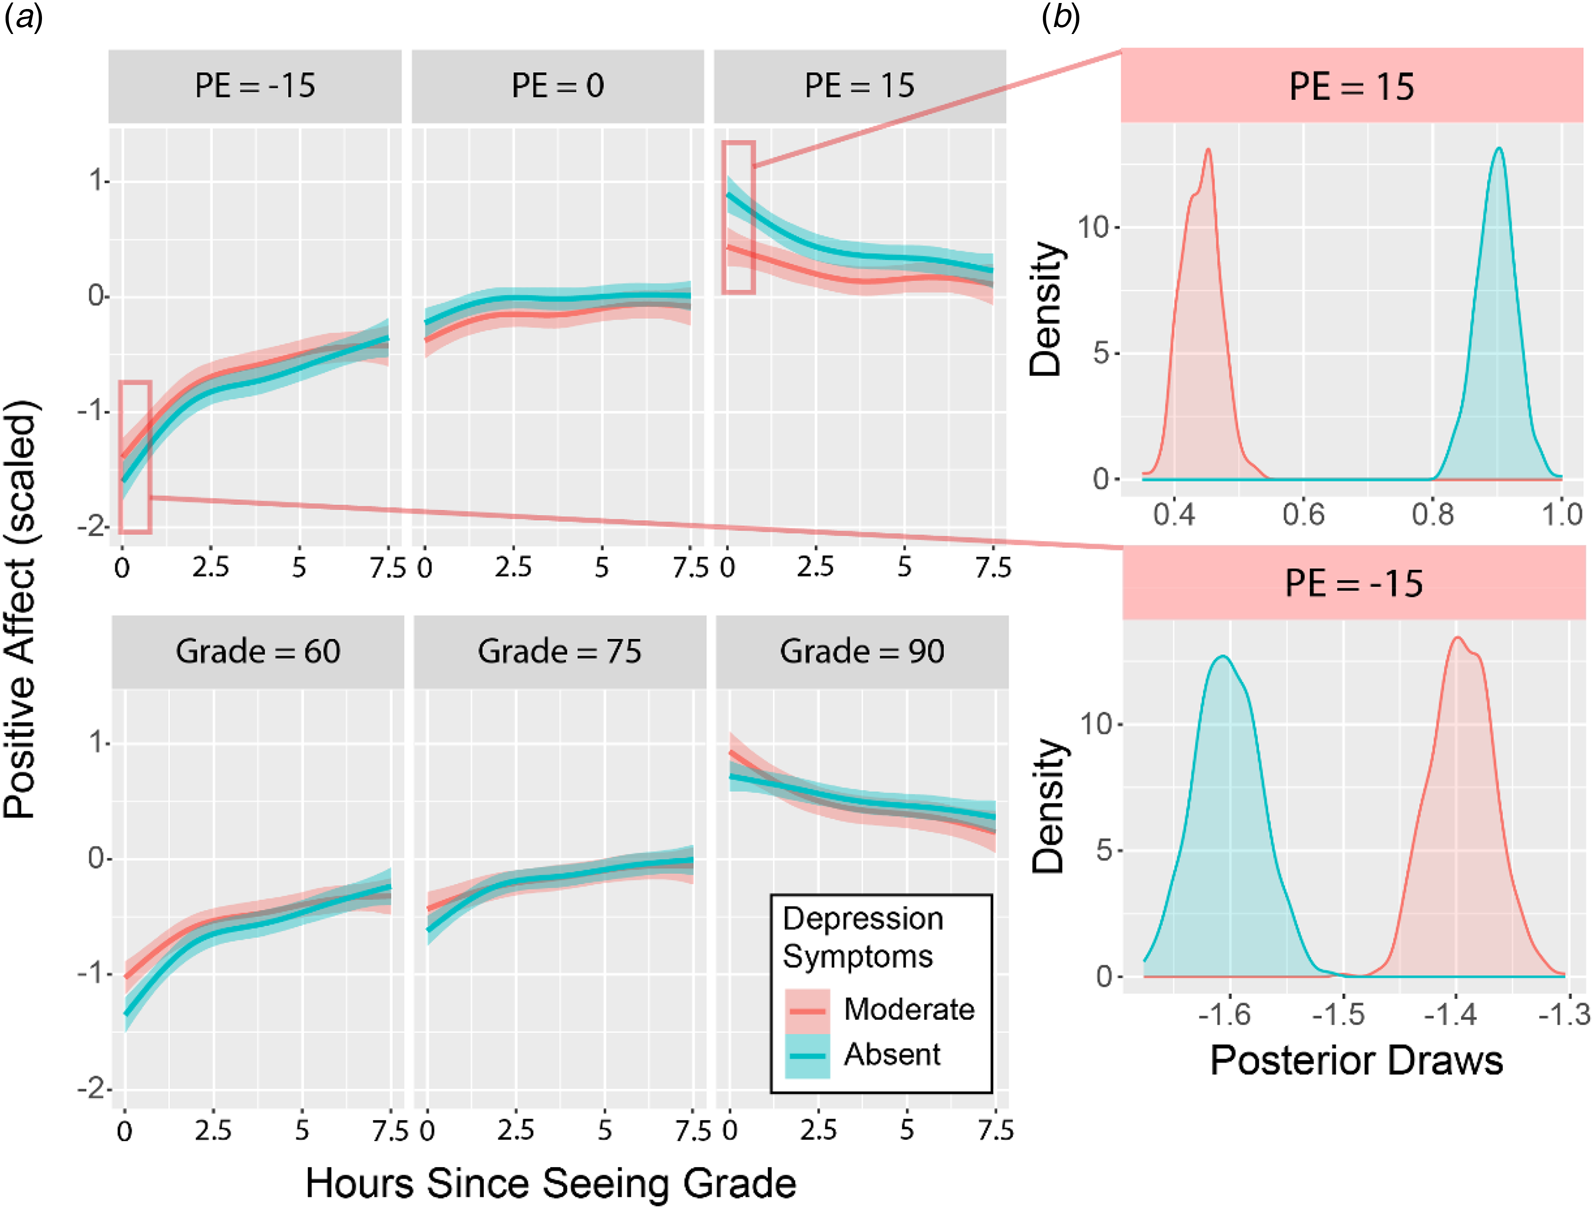
Figure 3. Depression impacts positive affective responses to prediction errors. (a) Individuals with moderate depression (red line; PHQ = 11.25) display blunted emotional responses to positive prediction errors, compared to individuals without depression (teal line; PHQ = 0), and minimal differences in emotional responses to different exam grades. (b) Posterior draws from tensor spline models suggest that PA responses differ more widely between depressed and non-depressed participants following positive PEs. These are conditional plots of specific, selected levels of depression and PE / grade from the statistical in which these variables are continuous. Bands are the 95% credible intervals from the model.
Depression impacts emotional responses to positive, and not negative prediction errors
The conditional plots for the above models (Fig. 3a), suggested that the blunted impact of PEs on positive emotion for individuals with heightened depression symptoms may be specific to positive PEs. To test this hypothesis, we computed the absolute value of PEs (i.e. PE magnitude) and coded PE valence as a categorical factor. We then specified a 4-way interaction in which the timecourse of PA was predicted by depression, time since viewing grade, PE magnitude, and PE valence. Model results revealed that more than 95% of the distribution of plausible parameter estimates for this 4-way interaction did not include zero (B = 0.02779 (0.00424), 95% CI 0.0199 to 0.0362; PP = 1.00; Evidence ratio = Inf; online Supplemental Figure S2; online Supplemental Table S3), indicating that the differential impact of PE on emotion by depression severity was specific to PEs of both a particular valence and magnitude.
To determine the types of PEs (i.e. positive v. negative; large v. small) that accounted for the differences in PA between depressed and non-depressed individuals, we took posterior draws from the nonlinear tensor spline models (plotted in Fig. 3a) and compared the model-predicted PA responses for depressed v. non-depressed individuals. Relative to their non-depressed counterparts, depressed individuals exhibited differences in their initial PA responses (i.e. immediately following grade reveal) to both negative PEs (Cohen's d = 0.228, 95% CI 0.138–0.314) and positive PEs (Cohen's d = −0.502, 95% CI −0.594 to −0.415). However, the magnitude of the difference between depressed and non-depressed individuals’ PA responses was larger for positive PEs (Fig. 3b), as evidenced by a lack of overlap in the absolute range of 95% confidence intervals surrounding Cohen's d metrics for positive and negative PEs, respectively. Indeed, immediately following a positive PE of +15, model predictions suggest that non-depressed individuals’ PA responses reach levels that nearly double those of depressed individuals. In line with the preceding linear results, this finding confirms that PA responses to positive PEs are preferentially attenuated in depression. Specifically, as positive PEs scale in magnitude, PA responses in non-depressed individuals increase at a similar rate, such that exceeding one's expectations by a greater degree elicits progressively larger increases in PA. In contrast, PA responses for depressed individuals increase at a slower rate with positive PEs, suggesting that depressed individuals differentiate less between slightly surprising v. highly surprising positive outcomes in their affective responses.
Anxiety is not associated with blunted emotional responses to prediction errors
Anxiety is frequently comorbid with depression and shares many, but not all features with depression, including certain affective features such as anhedonia. Thus, to evaluate the specificity of the impact of PEs on blunted emotional responses in depression, we tested whether these effects were observed as a function of individual differences in anxiety symptoms (N = 616). While increased anxiety predicted lower levels of PA overall (B = −1.572 (0.332); 95% CI −2.189 to −0.904; online Supplemental Table S4), this model revealed no such three-way interaction (PE × time × anxiety symptoms) on positive emotion (B = 0.00212 (0.0021); 95% CI −0.00182 to 0.0063; online Supplemental Figure S3; online Supplemental Table S4), suggesting that aberrant PE signaling specifically underlies emotional dysregulation in depression, but not in anxiety.
Discussion
Reductions in positive emotion are characteristic of depression and perhaps the most challenging symptoms to effectively treat. Theoretical models of anhedonia posit that abnormalities in PE signaling may lead to the reductions in positive emotion, but empirical evidence for these claims has been scant. Here, using a highly personally impactful event in a high-stakes context with a large sample, we identify that, in contrast to previous laboratory work, emotional reactions to PEs indeed differentiate depressed and non-depressed individuals. Specifically, individuals with higher levels of depression displayed an attenuated emotional reaction to positive PEs. This effect of depression on emotional responses were not observed to negative PEs, suggesting a unique effect of ‘positive’ surprises in differentiating depressed and non-depressed individuals. Moreover, signaling of outcome values appeared intact in depressed individuals, as emotional responses to exam grades themselves did not differ by group.
Despite reductions in positive emotion being core to depression, there is virtually no empirical evidence demonstrating the specific computational features of real-world affective events that differentiate individuals with depression from those without. One study, combining a gambling task and intermittent ratings of happiness found that, while the recent history of gambling PE outcomes drove happiness generally, the effects of these PEs on emotion did not differentiate individuals with depression from healthy controls (Rutledge et al., Reference Rutledge, Moutoussis, Smittenaar, Zeidman, Taylor, Hrynkiewicz and Dolan2017). Similarly, several studies that ask individuals with depression to rate the pleasantness of appetitive gustatory and olfactory stimuli found no differences by depression type. This study is, thus, perhaps the first to identify specific and unique drivers of emotion that differentiate individuals with depression from those without.
So why might we have observed differences in the timecourse of emotion in depression, but previous work has not? We would argue that it is not simply the personal relevance of the PE that reveals differences in emotional dysregulation in depression, but how the meaning of that PE is abstractly constructed by the individual. While the pleasantness of the taste of chocolate and the beneficial impact of a perfect exam score on your final grade are both relatively objective, the meaning of a PE in this naturalistic context is open to much wider interpretation across individuals. In this context, positive surprises can be quite meaningful for one's future career aspirations. Yet, it is also in these naturalistic contexts that there may be several reasons for such positive surprises (e.g. ‘I got a surprisingly good grade because I worked hard’; or ‘I got a surprisingly good grade by luck’). An individual must generate attributions for these outcomes (Seligman, Abramson, Semmel, & von Baeyer, Reference Seligman, Abramson, Semmel and von Baeyer1979) and someone at heightened depression can interpret the cause of the surprising outcome in such a way to discount the impact of the positive PE. Predictive processing accounts of mood disorders make similar arguments: people with depression tend to maintain negative performance expectations despite positive feedback as a kind of cognitive immunization (Kube, Schwarting, Rozenkrantz, Glombiewski, & Rief, Reference Kube, Schwarting, Rozenkrantz, Glombiewski and Rief2020). Thus, the emotional impact of positive surprises is suppressed as they do not fit into one's model of the world, wherein positive outcomes are more readily attributed to external causes, and less so one's efforts or ability. This account fits with our results that the differences in the effect of PE on emotion between depressed and non-depressed individuals were only present following positive PEs. Specifically, our finding that depressed individuals differentiated less between small and large positive PEs in their affective responses aligns with a tendency to attribute more surprising positive outcomes to external causes. Thus, it may be that computational work using naturalistic events with a range of potential outcomes and interpretations, and assessing their hedonic impact over hours is required to reveal the unique effects of positive PEs on emotion in depression.
Our results also suggest that the impact of rewards on emotion is not globally impaired in depression. The absence of differences in positive emotion as a function of the outcome value (exam grade) suggests that rewarding events are indeed normatively processed in those with heightened depression symptoms. These differences in the emotional impact of PEs and outcome values in depression may resolve longstanding discrepancies in the literature. Researchers have struggled with findings indicating that depressed patients rate rewarding stimuli equivalently pleasant as healthy controls. This has led to suggestions that anhedonia is primarily a motivational deficit (Treadway & Zald, Reference Treadway and Zald2013), despite qualitative evidence that anhedonia is linked to reduced joy as well (Watson, Harvey, McCabe, and Reynolds, Reference Watson, Harvey, McCabe and Reynolds2020). Although motivational deficits are clearly one core piece of anhedonia, the results presented here corroborate such null findings indicating no differences in hedonic response to value, but add that the ‘reduced joy’ depressed individual describe may be in part attributable to attenuated hedonic impact of personally-meaningful positive PEs.
This study is not without its limitations. Notably, despite a large and relatively diverse sample, subjects were solely college students, and these results should be replicated in non-student samples. Second, despite using a personally meaningful, high-stakes event, we assessed emotion surrounding only one achievement-oriented outcome domain. PEs and outcome values in different domains, including social or health domains, may impact the temporal course of emotion differently. It is critical to test whether these findings generalize to these other naturalistic domains. Third, while recording exam grade expectations shortly after each exam may have limited external factors (e.g. comparing answers to exam questions with peers) from contaminating participant's reported expectations, it is plausible that other uncontrolled factors may have influenced expectations, and as a result, biased PE-related findings. For instance, we demonstrated previously that students update their expectations incrementally in accordance with recent PEs and found differences in expectation updating in individuals with elevated risk for emotional disorders (Villano et al., Reference Villano, Kraus, Reneau, Jaso, Otto and Heller2023). Though PE-driven learning was beyond the scope of this investigation, we cannot rule out the possibility that differences in expectation updating are in part related to aberrant PE signaling in depression. Another untested possibility is that emotions in the aftermath of completing an exam may have influenced participants’ reported expectations, for example, reporting lower expectations when feeling distressed or anxious. While such mood-congruent judgments may indeed impact expectations (Mayer, Gaschke, Braverman, & Evans, Reference Mayer, Gaschke, Braverman and Evans1992), or even contribute to lower expectations in depressed participants, conditioning our statistical models directly on PEs allowed us to establish that PEs of identical valence and magnitude drive substantially different emotional responses in depressed v. nondepressed individuals, regardless of how a given participant settled on their expected grade. Nonetheless, future inquiry at the intersection of PE-driven learning and emotion will refine our understanding of how aberrant PE signaling initially manifests and eventually takes hold in depression.
Depression is characterized by abnormalities in emotional processing. Despite attempts by computational psychiatry, results using well-controlled laboratory designs to identify the drivers of impaired affective function in depression have been largely inconclusive. Using a high-stakes, personally impactful, real-world event coupled with experience sampling of emotion, we found that individuals with higher levels of depression displayed an attenuated emotional response to positive PEs. These effects were highly specific and suggest that anhedonia may manifest due to individuals discounting the meaning of positive PEs as a sort of maladaptive cognitive immunization. Thus, interventions that facilitate reframing positive PEs may hold promise for improving hedonic function in individuals with depression.
Supplementary material
The supplementary material for this article can be found at https://doi.org/10.1017/S0033291724000047.
Acknowledgements
The authors would like to thank Rick Reneau, Brittany Jaso, and Andre Perwin for their assistance on this project. This work was supported by NIHR21MH125311.
Competing interest
None.


