Social factors have been shown to be predictors of suicide in some studies using individual-level data (Reference Lewis and SloggettLewis & Sloggett, 1998; Reference KposowaKposowa, 2001; Reference Qin, Agerbo and MortensenQin et al, 2003). The results were, however, not consistent for education, which was found to be a significant risk factor in the USA (Reference KposowaKposowa, 2000) but not in the UK (Reference Lewis and SloggettLewis & Sloggett, 1998) or Denmark (Reference Qin, Mortensen and AgerboQin et al, 2000). Because previous studies focused on specific settings and had different designs, it is unknown whether their results can be generalised to other geographical settings. Moreover, it is important to identify cross-national variations in socio-economic inequalities in suicide, because this would help to foster a better understanding of the contextual factors such as mental care systems.
The aim of this study is to present a European overview of socio-economic inequalities in suicide mortality among men and women. Using a common method and data source, our purposes were first, to assess whether socio-economic inequalities in suicide are a generalised phenomenon in Europe, and second, to compare the extent of educational and housing socio-economic inequalities in suicide in different European populations, among men and women.
METHOD
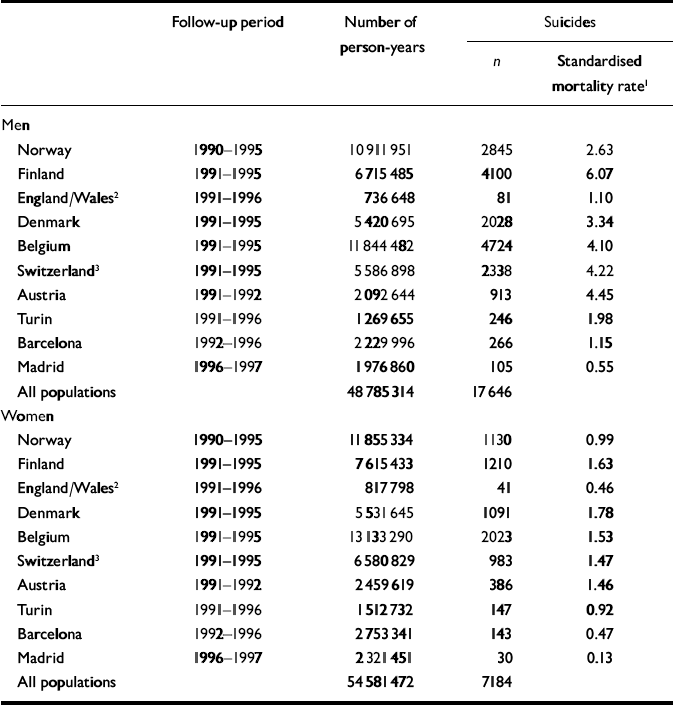
Data from national, regional and urban longitudinal mortality studies were used. The data were taken from population censuses linked to mortality registries throughout an average follow-up period of 4 years (1 year for Austria and Madrid) in the early 1990s. Data were gathered on the number of deaths and the number of person-years at risk, by gender, 5-year age group (age specified at the start of the follow-up, with 30-34 years as the youngest age group and 90 years and over as the oldest group), level of education and housing tenure. The populations included in the study are listed in Table 1. Most studies covered the entire national, regional or urban population. Studies from Austria, Belgium, Denmark, Finland and Norway comprised the total national population. Other data included were longitudinal data from Madrid (region), Barcelona (city), Turin (city) and Switzerland (individuals living in predominantly German-speaking regions; 70% of the total population). The data for England and Wales concern a representative 1% sample of the national population.
Table 1 Characteristics of the ten European populations studied
| Follow-up period | Number of person-years | Suicides | |||
|---|---|---|---|---|---|
| n | Standardised mortality rate 1 | ||||
| Men | |||||
| Norway | 1990-1995 | 10 911 951 | 2845 | 2.63 | |
| Finland | 1991-1995 | 6 715 485 | 4100 | 6.07 | |
| England/Wales 2 | 1991-1996 | 736 648 | 81 | 1.10 | |
| Denmark | 1991-1995 | 5 420 695 | 2028 | 3.34 | |
| Belgium | 1991-1995 | 11 844 482 | 4724 | 4.10 | |
| Switzerland 3 | 1991-1995 | 5 586 898 | 2338 | 4.22 | |
| Austria | 1991-1992 | 2 092 644 | 913 | 4.45 | |
| Turin | 1991-1996 | 1 269 655 | 246 | 1.98 | |
| Barcelona | 1992-1996 | 2 229 996 | 266 | 1.15 | |
| Madrid | 1996-1997 | 1 976 860 | 105 | 0.55 | |
| All populations | 48 785 314 | 17 646 | |||
| Women | |||||
| Norway | 1990-1995 | 11 855 334 | 1130 | 0.99 | |
| Finland | 1991-1995 | 7 615 433 | 1210 | 1.63 | |
| England/Wales 2 | 1991-1996 | 817 798 | 41 | 0.46 | |
| Denmark | 1991-1995 | 5 531 645 | 1091 | 1.78 | |
| Belgium | 1991-1995 | 13 133 290 | 2023 | 1.53 | |
| Switzerland 3 | 1991-1995 | 6 580 829 | 983 | 1.47 | |
| Austria | 1991-1992 | 2 459 619 | 386 | 1.46 | |
| Turin | 1991-1996 | 1 512 732 | 147 | 0.92 | |
| Barcelona | 1992-1996 | 2 753 341 | 143 | 0.47 | |
| Madrid | 1996-1997 | 2 321 451 | 30 | 0.13 | |
| All populations | 54 581 472 | 7184 | |||
1. Suicide rate per 10 000 person-years, standardised for age.
2. Sample of the population.
3. German-speaking regions only.
Variables
The codes used to identify death by suicide in the ICD-8, ICD-9 or ICD-10 classifications (World Health Organization, 1974, 1978, 1992) were E950-E959 (ICD-8 and ICD-9) and X60-X84 (ICD-10).
Educational status and housing tenure were registered. The level of education was first classified according to the national categories of education in each country. The number of educational categories ranged from four (in most countries) to 13 in Belgium. On the basis of the description given by each representative of the data collected in each country, the national categories were converted into International Standard Classification of Education (ISCED) categories (UNESCO, 1997). As several countries provided no information on the group with primary education only (ISCED 1), the ISCED levels 1 and 2 (lower secondary school) were grouped together in the analysis. Education data were not available for Danish people older than 70 years. Education is mostly achieved by early adulthood and is not necessarily consistent with later economic achievement and wealth accumulation over the life cycle. Housing tenure was included to cover such wealth effects and was grouped in two categories: owner and tenant. This variable, however, was available for only six populations, namely those of Norway, Finland, Denmark, England and Wales, Belgium and Turin.
Analysis
Age-standardised mortality rates by educational level and housing tenure were computed for each gender and country. Direct standardisation was applied, using the population of the European Union and Norway of 1995. On the basis of these standardised rates, we computed rate ratios comparing those with a low educational level (ISCED 1 and 2) with those more highly educated (ISCED 3 and above), and tenants with house owners. The formula for the standard error of a relative risk was used to compute standard error (Reference Dawson and TrappDawson & Trapp, 2001). Because differences in suicide inequalities between countries could arise from methodological or sample variations, we tested the homogeneity of inequalities using Cochran's Q statistic, which has a w2 distribution with a degree of freedom equal to the number of studies minus 1 (Reference PetittiPetitti, 1994).
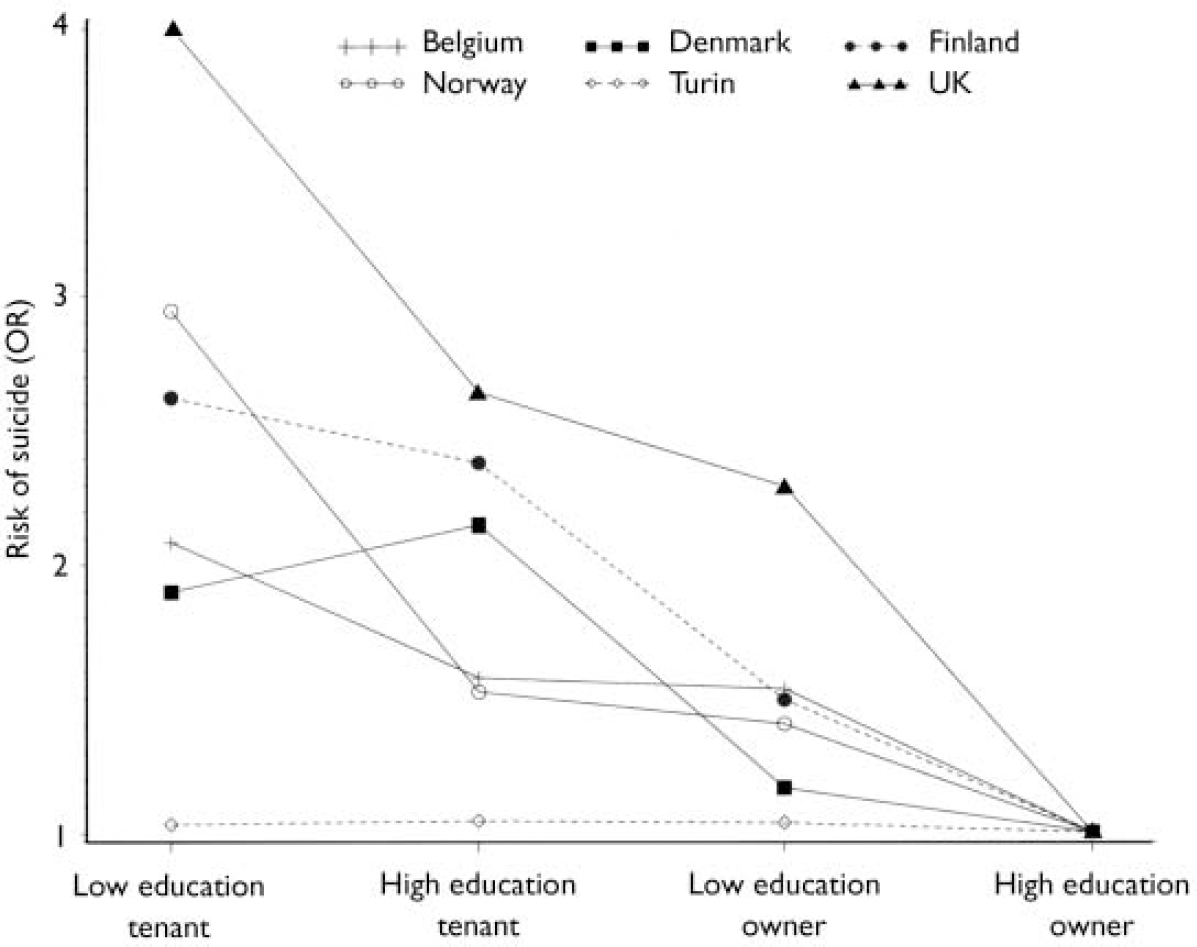
Fig. 1 Suicide risk in men: effect of educational level and house ownership status (OR, odds ratio).
We also looked at the cumulative effect of different types of socio-economic disadvantages on suicide levels. We combined education and housing tenure into a single index ranging from 0 (low educational level and tenant) to 4 (high educational level and house owner). The effect of increasing socio-economic disadvantages was assessed for each country through logistic regression, controlling for age.
RESULTS
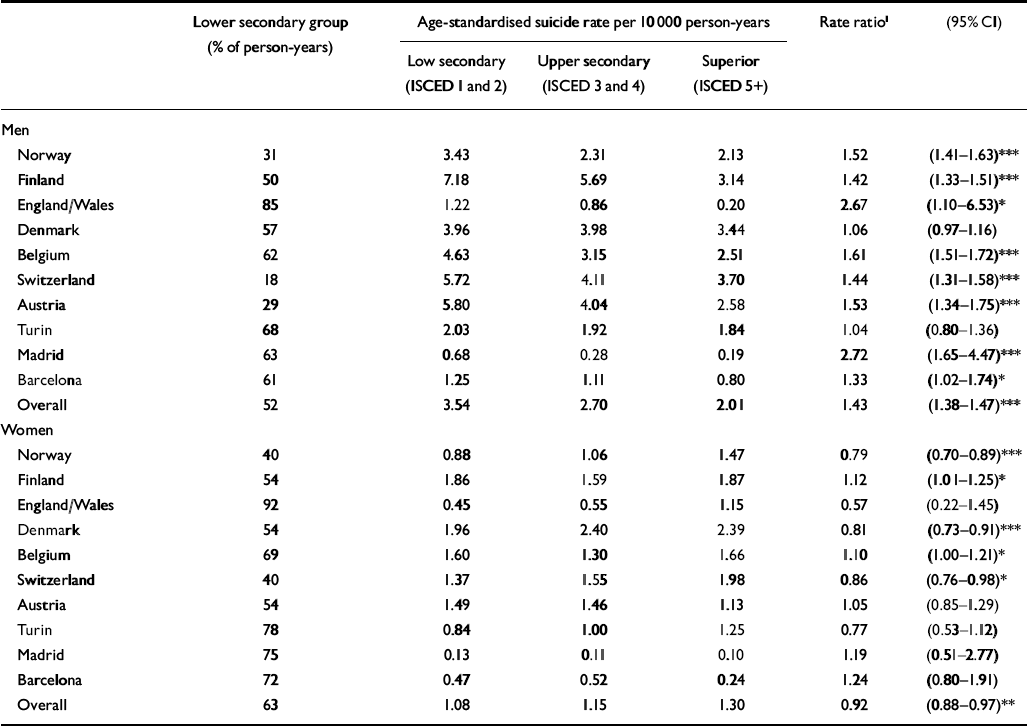
For all male populations, the suicide mortality rate is higher in the group with a lower educational level (Table 2). Moreover, the risk of suicide decreased unimodally with the educational level, everywhere but in Denmark. The results from all populations except those of Denmark and Turin consistently showed that the male suicide risk was significantly higher in the low educational level group, as compared with the highly educated group. In most populations the increase in risk was moderate, with a relatively narrow confidence interval. Madrid and England/ Wales evidenced a stronger inequality, although the confidence interval in the latter was wide.
Table 2 Suicide rates and educational status
| Lower secondary group (% of person-years) | Age-standardised suicide rate per 10 000 person-years | Rate ratio 1 | (95% CI) | |||||
|---|---|---|---|---|---|---|---|---|
| Low secondary (ISCED 1 and 2) | Upper secondary (ISCED 3 and 4) | Superior (ISCED 5+) | ||||||
| Men | ||||||||
| Norway | 31 | 3.43 | 2.31 | 2.13 | 1.52 | (1.41-1.63)*** | ||
| Finland | 50 | 7.18 | 5.69 | 3.14 | 1.42 | (1.33-1.51)*** | ||
| England/Wales | 85 | 1.22 | 0.86 | 0.20 | 2.67 | (1.10-6.53)* | ||
| Denmark | 57 | 3.96 | 3.98 | 3.44 | 1.06 | (0.97-1.16) | ||
| Belgium | 62 | 4.63 | 3.15 | 2.51 | 1.61 | (1.51-1.72)*** | ||
| Switzerland | 18 | 5.72 | 4.11 | 3.70 | 1.44 | (1.31-1.58)*** | ||
| Austria | 29 | 5.80 | 4.04 | 2.58 | 1.53 | (1.34-1.75)*** | ||
| Turin | 68 | 2.03 | 1.92 | 1.84 | 1.04 | (0.80-1.36) | ||
| Madrid | 63 | 0.68 | 0.28 | 0.19 | 2.72 | (1.65-4.47)*** | ||
| Barcelona | 61 | 1.25 | 1.11 | 0.80 | 1.33 | (1.02-1.74)* | ||
| Overall | 52 | 3.54 | 2.70 | 2.01 | 1.43 | (1.38-1.47)*** | ||
| Women | ||||||||
| Norway | 40 | 0.88 | 1.06 | 1.47 | 0.79 | (0.70-0.89)*** | ||
| Finland | 54 | 1.86 | 1.59 | 1.87 | 1.12 | (1.01-1.25)* | ||
| England/Wales | 92 | 0.45 | 0.55 | 1.15 | 0.57 | (0.22-1.45) | ||
| Denmark | 54 | 1.96 | 2.40 | 2.39 | 0.81 | (0.73-0.91)*** | ||
| Belgium | 69 | 1.60 | 1.30 | 1.66 | 1.10 | (1.00-1.21)* | ||
| Switzerland | 40 | 1.37 | 1.55 | 1.98 | 0.86 | (0.76-0.98)* | ||
| Austria | 54 | 1.49 | 1.46 | 1.13 | 1.05 | (0.85-1.29) | ||
| Turin | 78 | 0.84 | 1.00 | 1.25 | 0.77 | (0.53-1.12) | ||
| Madrid | 75 | 0.13 | 0.11 | 0.10 | 1.19 | (0.51-2.77) | ||
| Barcelona | 72 | 0.47 | 0.52 | 0.24 | 1.24 | (0.80-1.91) | ||
| Overall | 63 | 1.08 | 1.15 | 1.30 | 0.92 | (0.88-0.97)** | ||
* P <0.05, ** P <0.01, *** P <0.001.
1. Rate ratio=standard suicide rate for those with lower secondary education (ISCED 1 and 2)/standard suicide rate for those with upper secondary education or above (ISCED 3+).
The pattern of educational inequalities was very different in women. A lower educational attainment level was shown to be a significant, positive but weak risk factor for suicide only in Belgium and Finland. A lower educational level proved to be a protective risk factor for women from Norway, Denmark and Switzerland.
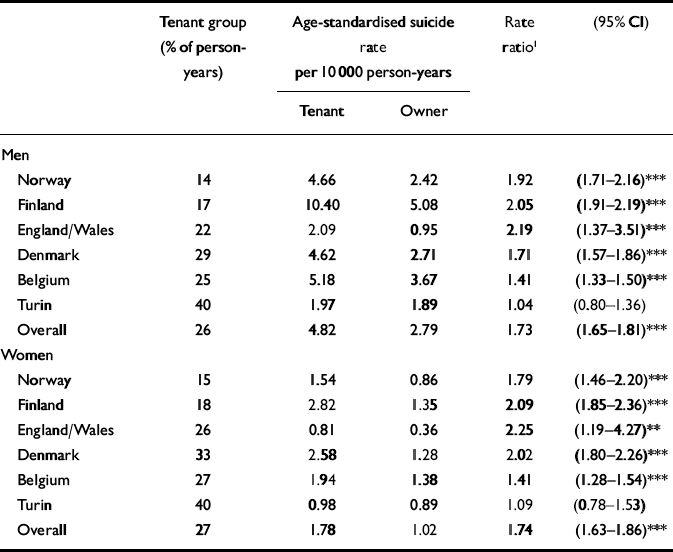
In four out of five countries, the risk of suicide was greater in tenants than in house owners (Table 3), for both men and women. Once again, Turin evidenced small and non-significant inequalities in suicide. The overall risk associated with ownership was slightly greater than the risk associated with education, particularly for women.
Table 3 Suicide rates and housing tenure
| Tenant group (% of person-years) | Age-standardised suicide rate per 10 000 person-years | Rate ratio 1 | (95% CI) | |||
|---|---|---|---|---|---|---|
| Tenant | Owner | |||||
| Men | ||||||
| Norway | 14 | 4.66 | 2.42 | 1.92 | (1.71-2.16)*** | |
| Finland | 17 | 10.40 | 5.08 | 2.05 | (1.91-2.19)*** | |
| England/Wales | 22 | 2.09 | 0.95 | 2.19 | (1.37-3.51)*** | |
| Denmark | 29 | 4.62 | 2.71 | 1.71 | (1.57-1.86)*** | |
| Belgium | 25 | 5.18 | 3.67 | 1.41 | (1.33-1.50)*** | |
| Turin | 40 | 1.97 | 1.89 | 1.04 | (0.80-1.36) | |
| Overall | 26 | 4.82 | 2.79 | 1.73 | (1.65-1.81)*** | |
| Women | ||||||
| Norway | 15 | 1.54 | 0.86 | 1.79 | (1.46-2.20)*** | |
| Finland | 18 | 2.82 | 1.35 | 2.09 | (1.85-2.36)*** | |
| England/Wales | 26 | 0.81 | 0.36 | 2.25 | (1.19-4.27)** | |
| Denmark | 33 | 2.58 | 1.28 | 2.02 | (1.80-2.26)*** | |
| Belgium | 27 | 1.94 | 1.38 | 1.41 | (1.28-1.54)*** | |
| Turin | 40 | 0.98 | 0.89 | 1.09 | (0.78-1.53) | |
| Overall | 27 | 1.78 | 1.02 | 1.74 | (1.63-1.86)*** | |
*P <0.05, **P <0.01, ***P <0.001.
1. Rate ratio of tenants compared with house owners.
The homogeneity of educational and housing risk factors of suicide was rejected for both men and women (for men, Cochran Q>73, P>0.001; for women, Cochran Q>38, P<0.001). A rejection of the homogeneity assumption implies that there are country-specific effects in inequalities, which could not be explained by random variation. Inequalities in suicide according to housing tenure were slightly less heterogeneous (standard deviation of relative risk 0.38) than inequalities according to education (standard deviation of RR=0.54).
The risk of suicide for men in all the populations, except for Danish men, was shown to decrease unimodally with increasing socio-economic advantage (Fig. 1). The intermediate socio-economic groups (high level of education and tenant; low level of education and house owner) were at less risk of suicide than the lowest group. These intermediate groups were, however, at more risk than the upper group. In all countries, house owners with a low educational level had a smaller risk than highly educated tenants. For Finland, England/Wales and Belgium, the risk of suicide decreased linearly with socio-economic status, whereas in Denmark and Norway a less regular trend was observed.
In women, the risk of suicide did not decrease unimodally with increasing socio-economic status (Fig. 2). The highest risk was found in the intermediate group of women with higher levels of educational attainment who were tenants. As among men, a lower educational status and house ownership led to a smaller risk than a higher educational level and being a tenant. In most countries, the lowest risk was found in the low-educated house owners. In Turin, socio-economic status was associated only slightly with suicide risk.
DISCUSSION
Main findings
We examined socio-economic risk factors for suicide mortality in ten European populations. Four main findings stand out. Socio-economic inequalities in suicide are pervasive in all male populations, except for that of Turin. Second, inequalities were far less pronounced in women and in some cases even reversed, particularly when educational status was considered. Third, housing tenure seems to be a more important risk factor than education and yields more consistent results between genders. Fourth, our study shows that in most settings, suicide level increases with increasing socio-economic disadvantage.
Limitations
The study has a few limitations which could affect the reliability and comparability of estimates of suicide inequalities. Misclassification could affect the suicide registration. Indeed, there is some evidence that official suicide rates are underestimated (Reference Joseph, Abraham and MuliyilJoseph et al, 2003) because of suicide misclassification. Such misclassification could affect our estimates if countries apply different coding procedures (Reference Jougla, Pavillon and RossollinJougla et al, 1998) and, hence, have different reliability (Reference Rockett and ThomasRockett & Thomas, 1999). We assessed such risk by combining suicide and injuries of undetermined intent (E980-E989, Y10-Y23). The results were relatively robust. When injuries and suicide were added up, the risk of suicide among men of low education compared with men of high education increased from 1.4 to 1.48. This change was more dramatic for the male populations in England and Wales (from 2.67 to 4.10) and in Belgium (from 1.61 to 2.2). The country rankings in educational inequalities among men changed very little, except for Barcelona, which was pushed from eighth position into fourth.
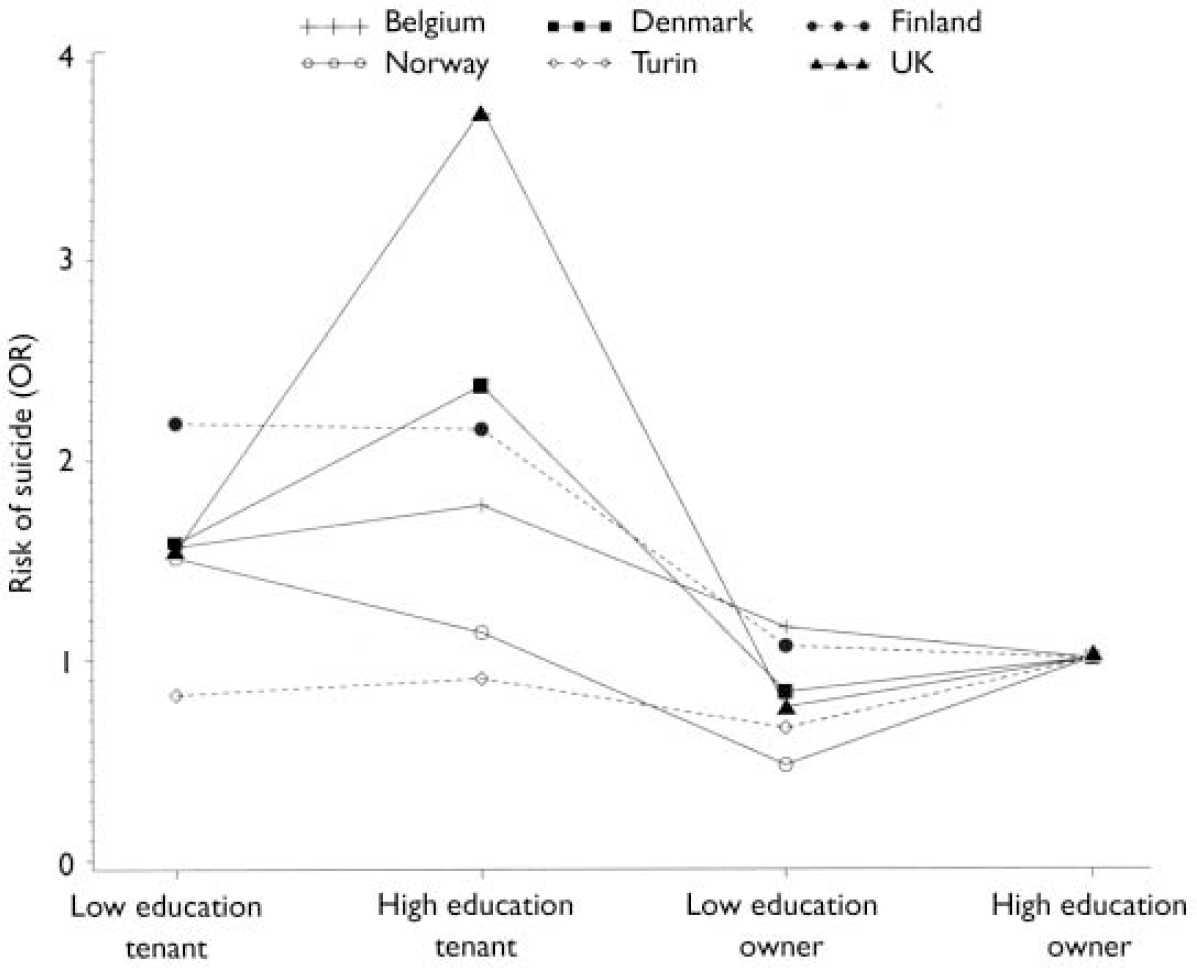
Fig. 2 Suicide risk in women: effect of educational level and house ownership status (OR, odds ratio).
A second group of limitations arises from the differences in the educational system in the countries compared. We devoted considerable effort to obtaining internationally comparable educational categories using the ISCED system. However, the ISCED distribution is not homogeneous and some countries have a low percentage of individuals in the lower secondary educational attainment category (such as Switzerland) or in the categories with upper secondary education and above (England/ Wales and Turin). Sensitivity analysis was performed to assess the impact of the heterogeneity in education distribution. The cross-country analysis was carried out by computing a relative index of inequality on the relative rank of educational status (Reference Mackenbach and KunstMackenbach & Kunst, 1997), which takes into account each educational level individually, with a distinction of about four educational levels in most countries. Inequalities increased and became significant in all male populations but that of Turin. On average, the ranking of countries changed by 1 point. Barcelona became a high-inequality population. The highest inequality level was still seen in Madrid. Turin and Denmark had the smallest inequalities.
The inequalities in England and Wales were higher than those found in a study based on the 1981 population census (Reference Lewis and SloggettLewis & Sloggett, 1998). They are also higher than the figures reported in a psychiatric epidemiological survey (Reference Lewis, Bebbington and BrughaLewis et al, 1998). Discrepancies in source (we used the 1991 population census), in statistical power (we counted 130 suicides for England and Wales v. 581 in the study of Lewis & Sloggett) and follow-up (5 years v. 10 years) may explain such differences in the observed size of inequalities.
Previous studies and interpretation
On three aspects our results are consistent with a previous worldwide meta-analysis of socio-economic risk factors for common mental disorders, a main risk factor for suicide (Reference Lorant, Deliege and EatonLorant et al, 2003). First, in that study low socio-economic status was found to be a significant and positive risk factor of depression in 35 out of 56 studies. Second, as in our study, the association with socio-economic status was unimodal and stronger for economic variable than for educational status. Finally, it was also geographically heterogeneous: greater in the USA than in Europe.
The greater inequality between educational groups found in men as compared with women is consistent with previous individual-level studies (Reference KposowaKposowa, 2000; Reference Blakely, Collings and AtkinsonBlakely et al, 2003). It can be explained by gender differences in health-related and life-threatening behaviours, such as alcohol or drug misuse, which are known risk factors of suicide and are more prevalent among men and among lower socio-economic groups (Reference Kessler, McGonagle and ZhaoKessler et al, 1994; Reference Cavelaars, Kunst and MackenbachCavelaars et al, 1997; Reference McDonough, Williams and HouseMcDonough et al, 1999), although alcohol was not particularly related to socio-economic status in the British survey of psychiatric morbidity. On the other hand, suicide inequalities in women resemble those in men more closely where house ownership is concerned than education: this may be because house ownership is mostly an attribute of the household and thus shared by both spouses, whereas education is an individual attribute, hence more sensitive to gender differences. It could be also that low wealth or income tends to have a similar association with men's and women's overall mortality risk (Reference Duncan, Daly and McDonoughDuncan et al, 2002).
Suicide was more strongly associated with home ownership than with education. This is consistent with previous studies using housing tenure, wealth or car ownership (Reference Lewis and SloggettLewis & Sloggett, 1998; Reference Qin, Mortensen and AgerboQin et al, 2000; Reference Blakely, Collings and AtkinsonBlakely et al, 2003). Several elements may explain such a difference. Housing tenure is an indicator of wealth accumulation and has shown to yield stronger inequality than education (Reference Lorant, Deliege and EatonLorant et al, 2003), presumably because the material pathway (captured by housing tenure) has the edge over the behavioural pathway (captured by educational status). Moreover, psychiatric illness is more likely to affect house ownership than education, because reverse causation is less likely in the latter case. The fact that housing inequalities are greater than educational inequalities indicates that selection factors must not be overlooked and that the roots of inequalities are grasped in the whole life cycle (Reference Power, Matthews and ManorPower et al, 1998). Finally, housing tenure may also be associated with marital status, which has a clear protective effect on suicide (Reference KposowaKposowa, 2000).
Why is there no suicide inequality in Turin, while the largest inequalities were found in Madrid? We can speculate that the outstanding Italian mental care system might play some part. Mental illness is a major risk factor for suicide (Reference Qin, Agerbo and MortensenQin et al, 2003) and is more prevalent among lower socio-economic groups (Reference Lorant, Deliege and EatonLorant et al, 2003). Individuals of lower socio-economic status favour primary mental care over psychiatric specialty care (Reference Alegria, Bijl and LinAlegria et al, 2000). Italy has pioneered an integrated and community-based mental health system, introduced after the reforms of 1978 and the 1994 National Mental Health Plan (Reference BurtiBurti, 2001; Reference Becker and Vázquez-BarqueroBecker & Vázquez-Barquero, 2001). As a consequence, Italy might well be able to tackle suicide inequalities more effectively. A recent assessment of time trends of suicide inequalities in Turin showed that the suicide risk was reduced most in the less educated population groups between the 1970s and the 1990s (Costa et al, personal communication). The link with the reform undergone by the Italian psychiatric system requires further study, however.
The large educational inequalities observed in Madrid (and in some analyses also in Barcelona) might be due to the higher prevalence of drug misuse in these Spanish cities compared with other countries of the European Union (Reference Kraus, Augustin and FrischerKraus et al, 2003). Suicide is a frequent cause of death among drug users in southern Europe (Reference Orti, Domingo-Salvany and MuñozOrti et al, 1996), and there is a strong relationship between parenteral drug use and educational level. The small inequalities in women from Madrid are consistent with the lower prevalence of injecting drug use in women compared with men. Societal inequalities, including inequalities in income, may provide another explanation for the greater inequalities in suicide in Madrid. Spain ranks among the countries with the highest income inquality in Europe. Moreover, large inequalities among Madrid men may also be explained by the low level of suicide prevalence, as rare events tend to concentrate among lower socio-economic groups.
Clinical implications
The pervasive association between socio-economic status and suicide calls for an improvement of access to psychiatric care for lower socio-economic groups. This is relevant because psychiatric disorders seem to be an important pathway in the relationship between socio-economic status and suicide (Reference Qin, Agerbo and MortensenQin et al, 2003) and because of the under-utilisation of speciality mental care among lower socio-economic groups (Reference Alegria, Bijl and LinAlegria et al, 2000). Individuals of lower socio-economic status with a DSM-IV disorder (American Psychiatric Association, 1994) are more likely to receive that care in countries (such as The Netherlands) that have succeeded in integrating mental health within the primary and community care sectors (Reference Alegria, Bijl and LinAlegria et al, 2000). The shift to primary care and community care may thus contribute to reducing socio-economic inequalities in suicide.
Clinical Implications and Limitations
CLINICAL IMPLICATIONS
-
▪ In most settings, men of low socio-economic status are at greater risk of suicide than higher-status groups.
-
▪ Socio-economic inequalities are smaller and less consistent among women.
-
▪ In most settings, the more socio-economic disadvantages a person suffers, the higher the risk of suicide.
LIMITATIONS
-
▪ Misclassification results in an underestimation of national suicide rates, but the bias may not strongly differ by socio-economic status.
-
▪ Differences in educational systems affect to some extent the national rankings in suicide inequalities.
-
▪ Low statistical power for some countries challenges comparisons of these countries with others.
Acknowledgements
Members of the EU Working Group on Socio-Economic Inequalities in Health who contributed to this paper are Otto Andersen (Statistics Denmark, Copenhagen, Denmark), Matthias Bopp (Institute for Social and Preventive Medicine, Zurich, Switzerland), Carme Borrell (Municipal Health Service, Barcelona, Spain), Jens-Kristian Borgan (Statistics Norway, Oslo, Norway), Giuseppe Costa (Department of Public Health and Microbiology, Turin, Italy), Patrick Deboosere (Interface Demography, Brussels, Belgium), Myer Glickman (Health and Care Division, Office for National Statistics, London, UK), Sylvie Gadeyne (Interface Demography, Brussels, Belgium), Christoph Minder (Institute for Social and Preventive Medicine, Bern, Switzerland), Enrique Regidor (Department of Preventive Medicine and Public Health, Madrid, Spain), Teresa Spadea (Department of Public Health and Microbiology, Turin, Italy) and Tapani Valkonen (Department of Sociology, Helsinki, Finland).


eLetters
No eLetters have been published for this article.