In Schanderl et al. (Reference Schanderl, Jenssen, Strobl and Manhart2017), incorrect particle image velocimetry (PIV) results were presented owing to mistaken use of the wrong calibration file in the processing of the data. None of the conclusions are affected by this unfortunate error, but the quantitative PIV results need updating with table 2 and figures 7, 8, 11, 12, 15 and 18 replaced with the following.
The spatial resolution was
![]() $0.00295D$
(instead of
$0.00295D$
(instead of
![]() $0.0038D$
as given in the original article) which corresponds to 339 data points per cylinder diameter, which affected both the spatial position and the amplitudes of the measured flow quantities. While in the results published in the original article the measured position of the horseshoe vortex was by
$0.0038D$
as given in the original article) which corresponds to 339 data points per cylinder diameter, which affected both the spatial position and the amplitudes of the measured flow quantities. While in the results published in the original article the measured position of the horseshoe vortex was by
![]() $0.03D$
more upstream, it turned out that with the correct calibration, it is by
$0.03D$
more upstream, it turned out that with the correct calibration, it is by
![]() $0.03D$
more downstream of the simulated horseshoe vortex centre. The positions of the other critical points in the symmetry plane, as given in table 2, have changed as well. The magnitudes of the velocity and its statistics are reduced. For example, it was reported that the measured peak value of the in-plane turbulent kinetic energy was 30 % larger than the in-plane turbulent kinetic energy simulated by large eddy simulation (LES). With the correct calibration, those peak values coincide with
$0.03D$
more downstream of the simulated horseshoe vortex centre. The positions of the other critical points in the symmetry plane, as given in table 2, have changed as well. The magnitudes of the velocity and its statistics are reduced. For example, it was reported that the measured peak value of the in-plane turbulent kinetic energy was 30 % larger than the in-plane turbulent kinetic energy simulated by large eddy simulation (LES). With the correct calibration, those peak values coincide with
![]() $k_{ip,peak}\approx 0.07u_{b}^{2}$
.
$k_{ip,peak}\approx 0.07u_{b}^{2}$
.
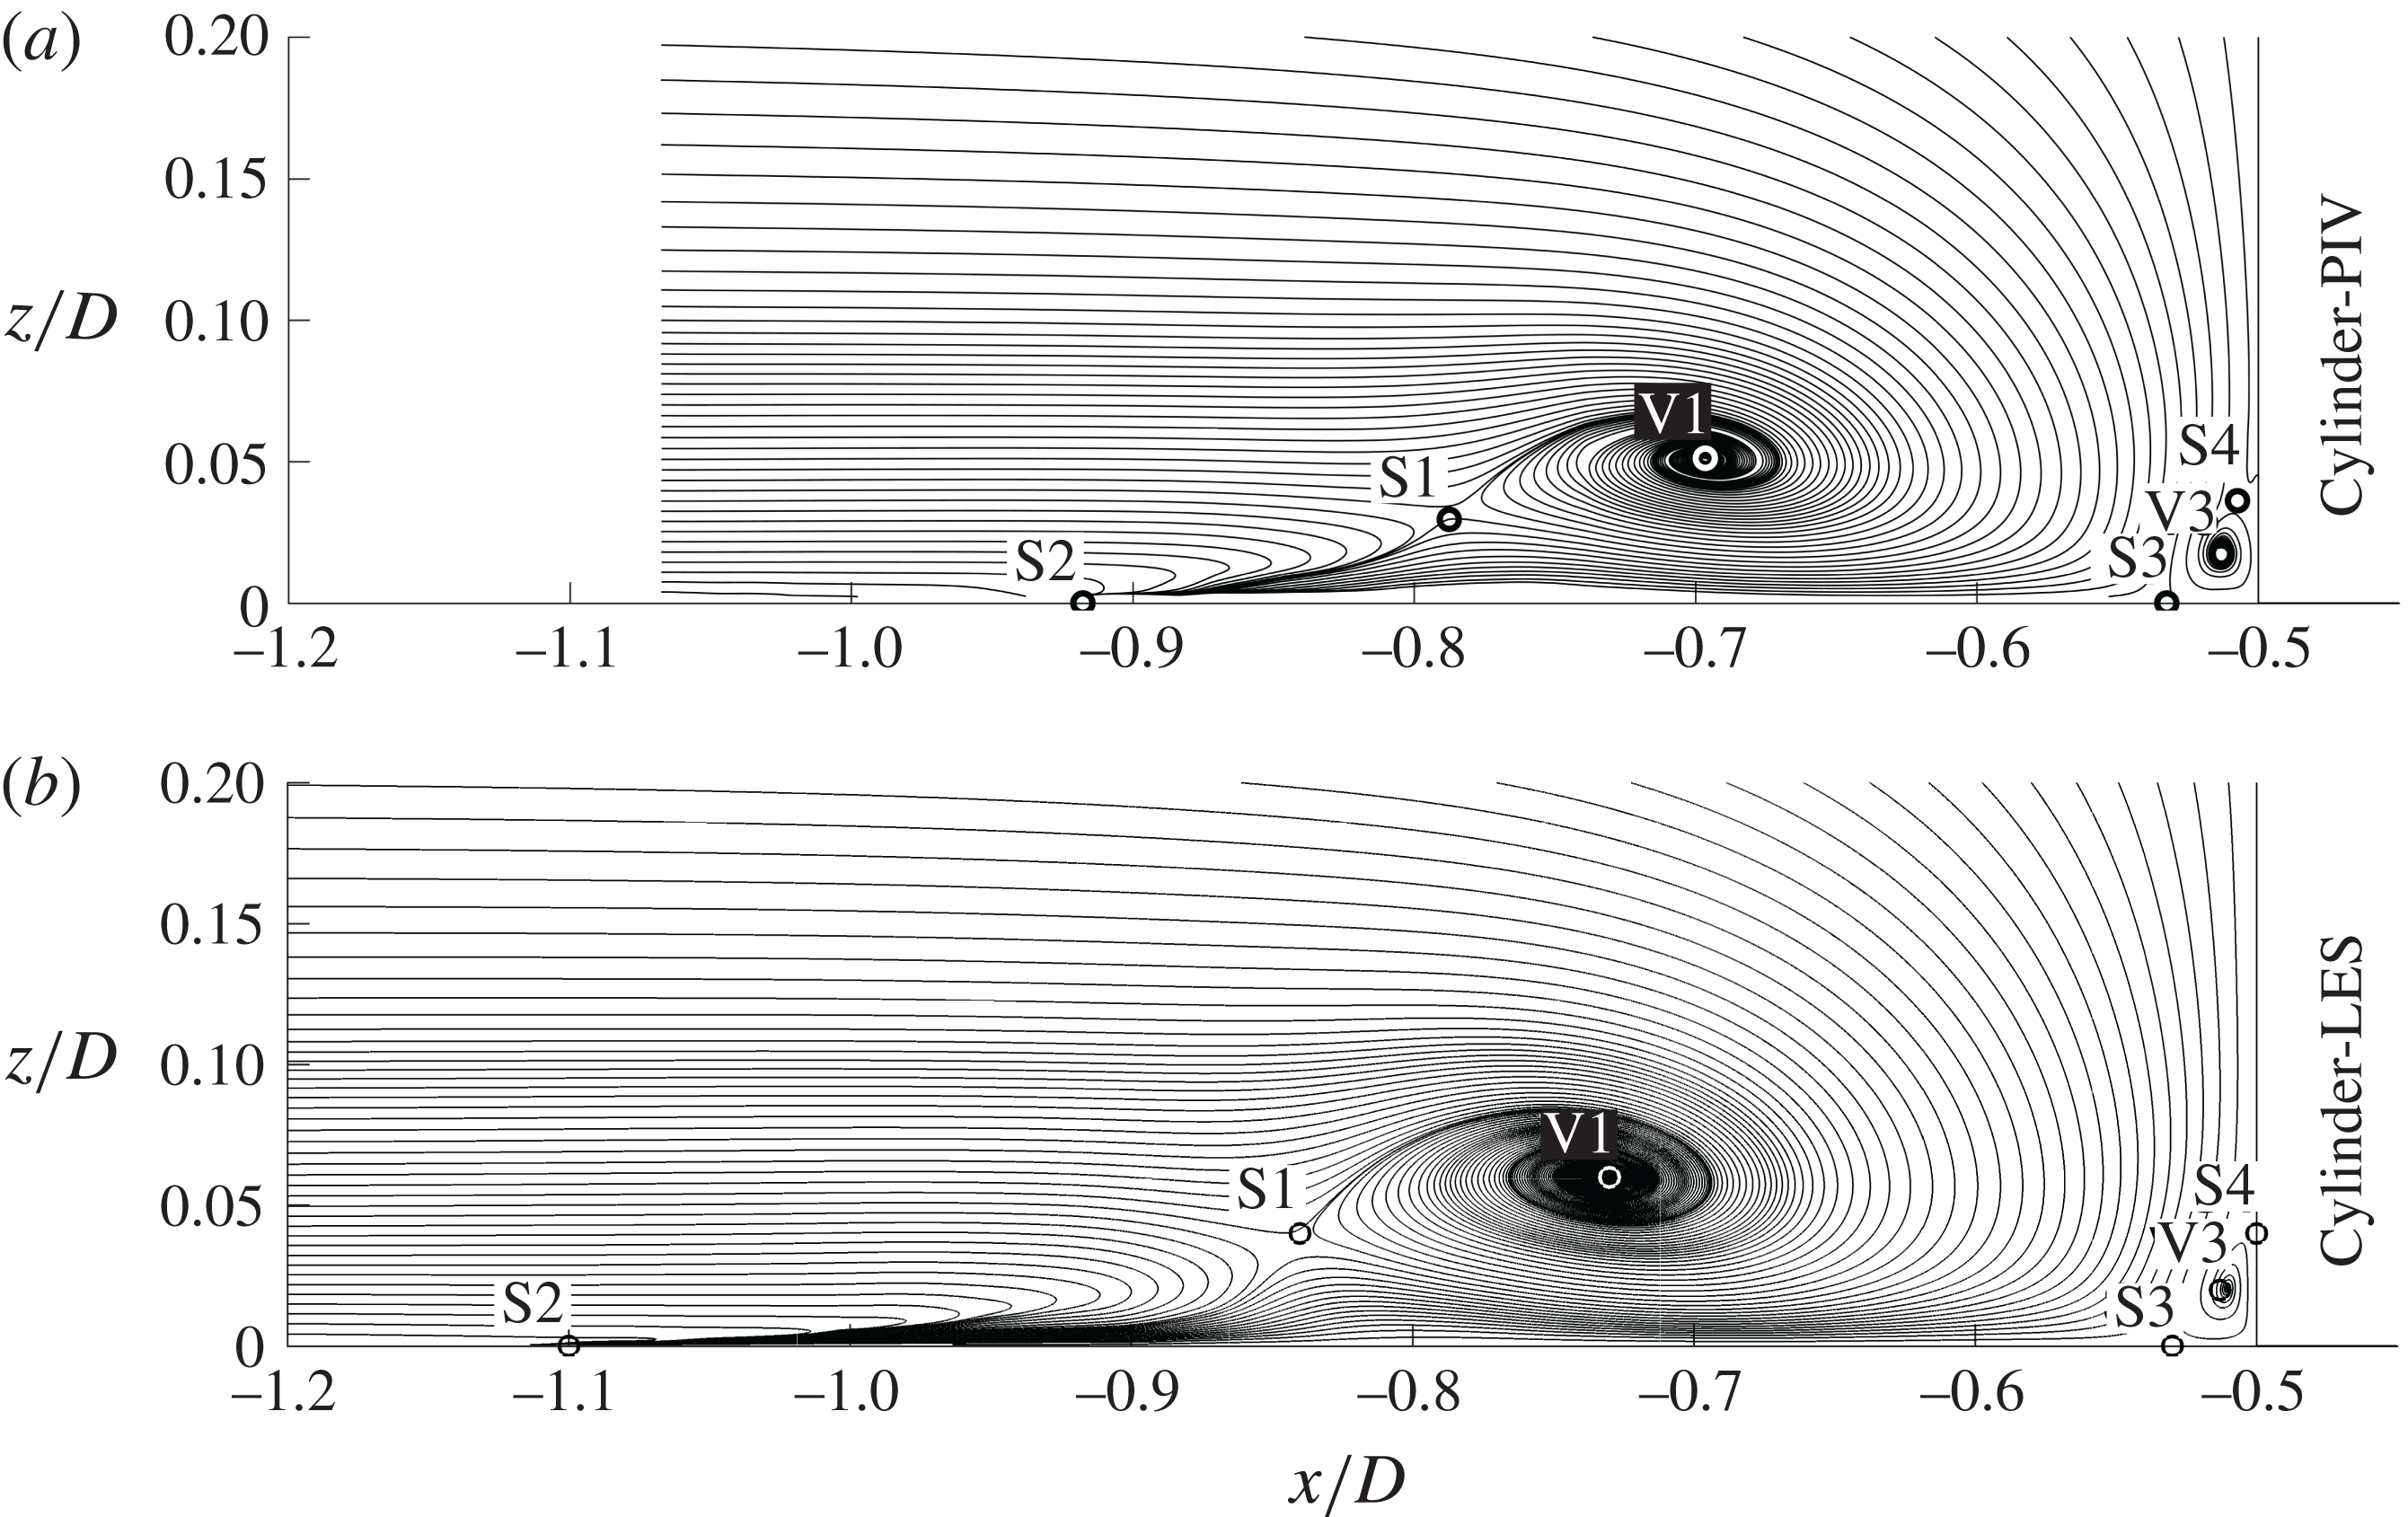
Figure 7. Streamlines of the time-averaged flow field in the symmetry plane in front of the cylinder for (a) PIV and (b) LES.
Table 2. Positions of critical points. If no
![]() $z_{Si}$
is given, the corresponding stagnation point is located at the bottom plate.
$z_{Si}$
is given, the corresponding stagnation point is located at the bottom plate.
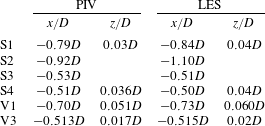
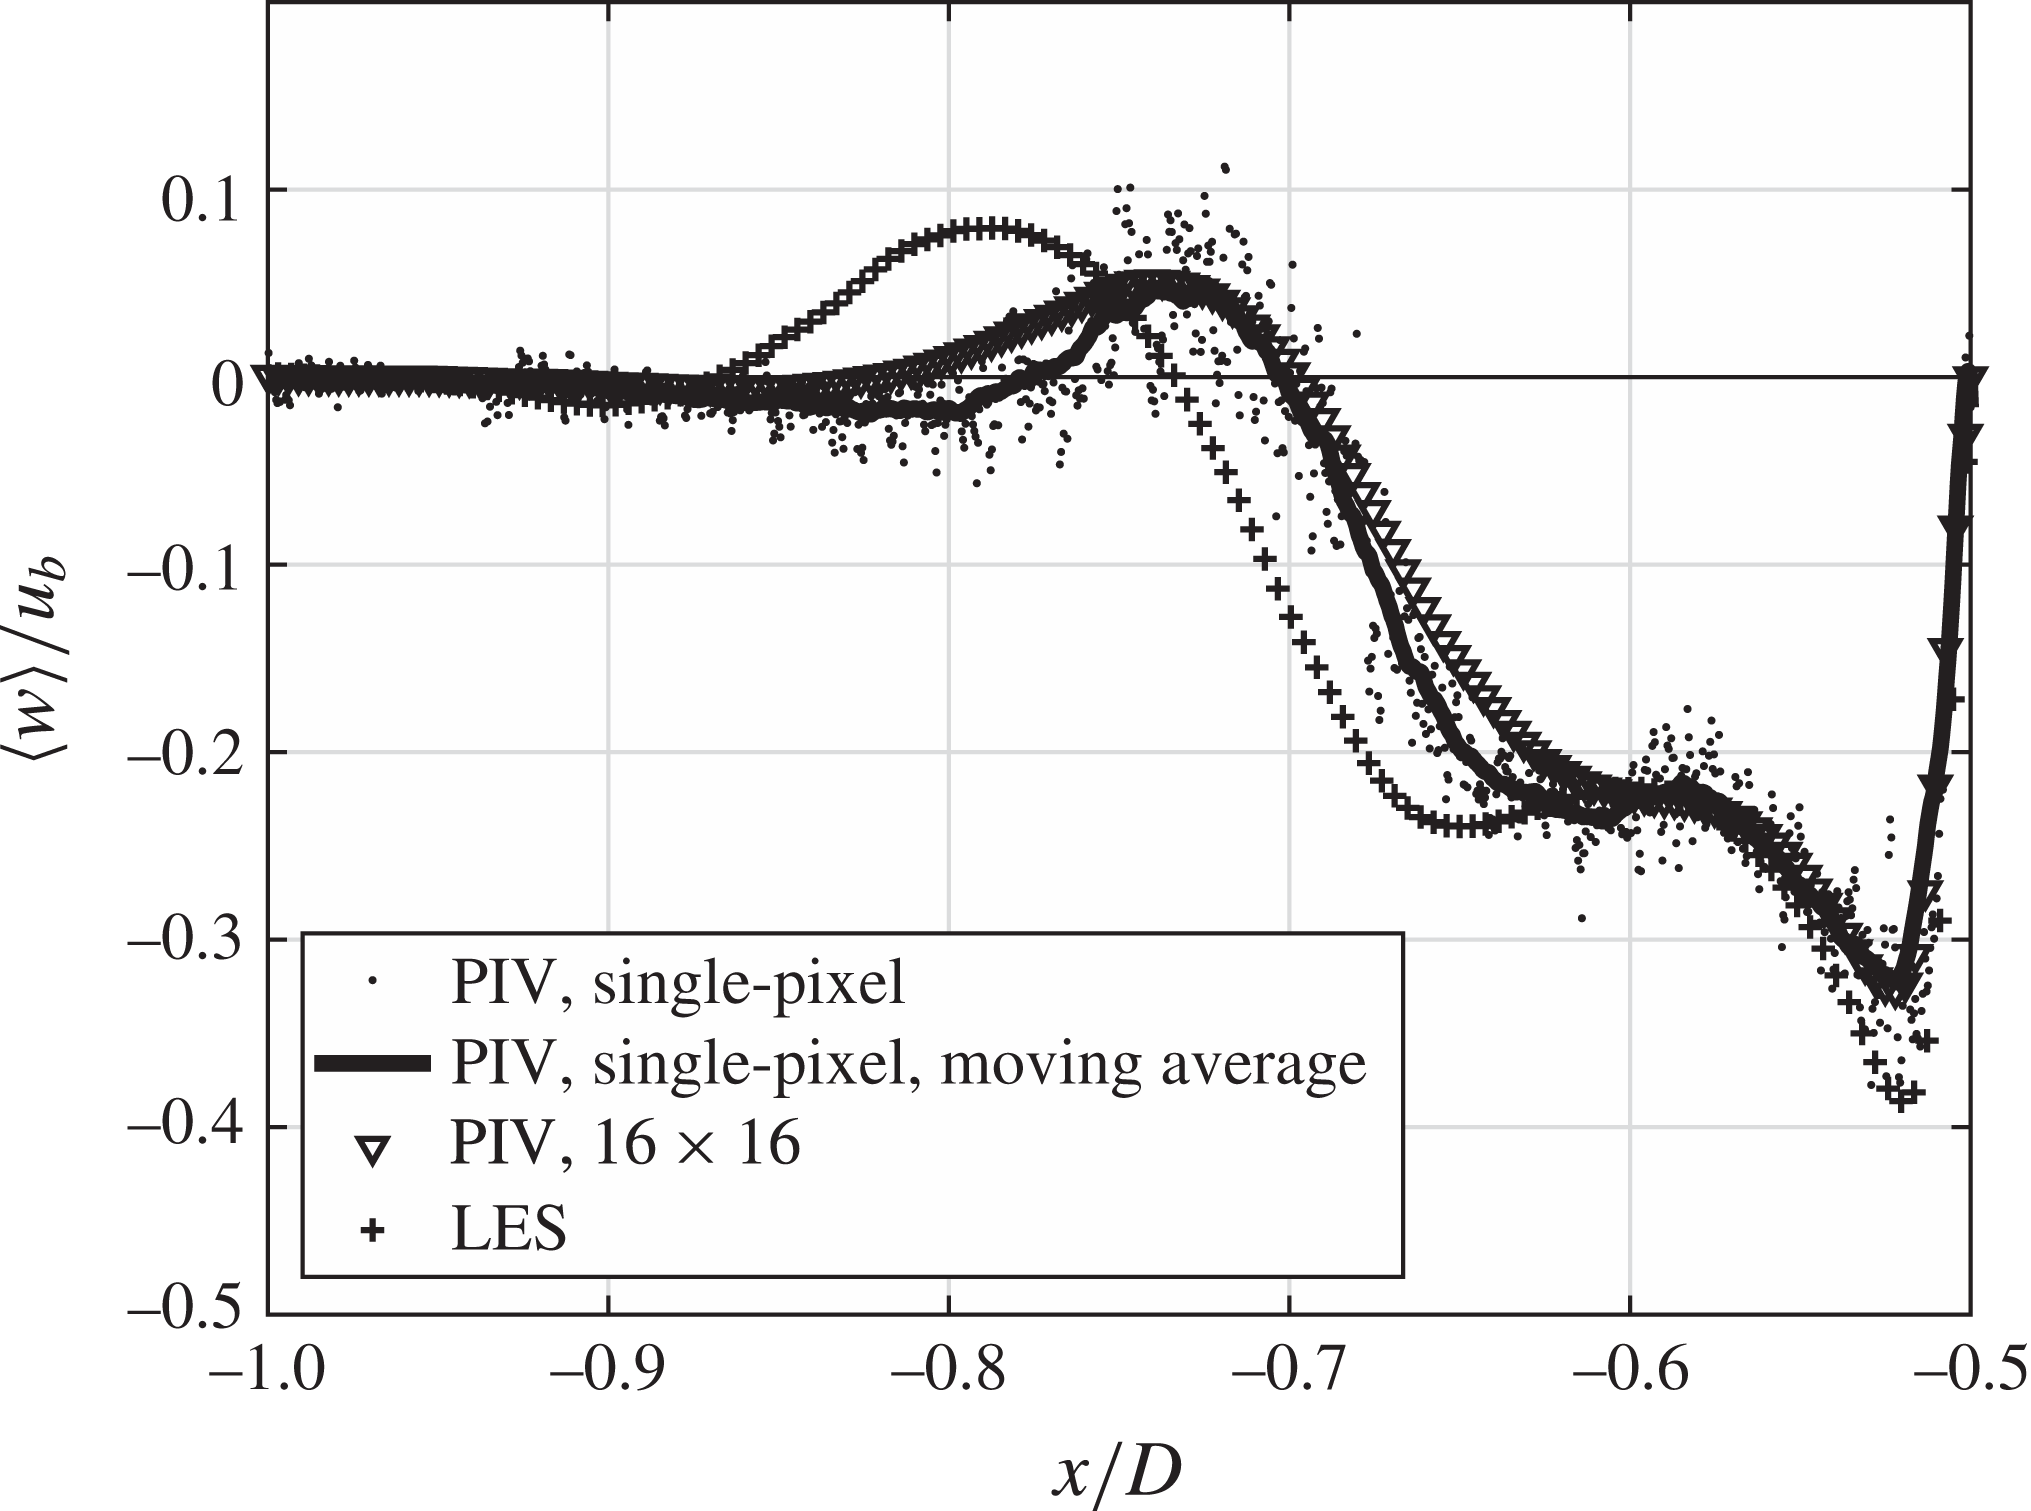
Figure 8. Profiles of the wall-normal velocity component
![]() $\langle w\rangle$
in the symmetry plane in front of the cylinder at a wall distances of
$\langle w\rangle$
in the symmetry plane in front of the cylinder at a wall distances of
![]() $z_{V1}=0.06D$
.
$z_{V1}=0.06D$
.
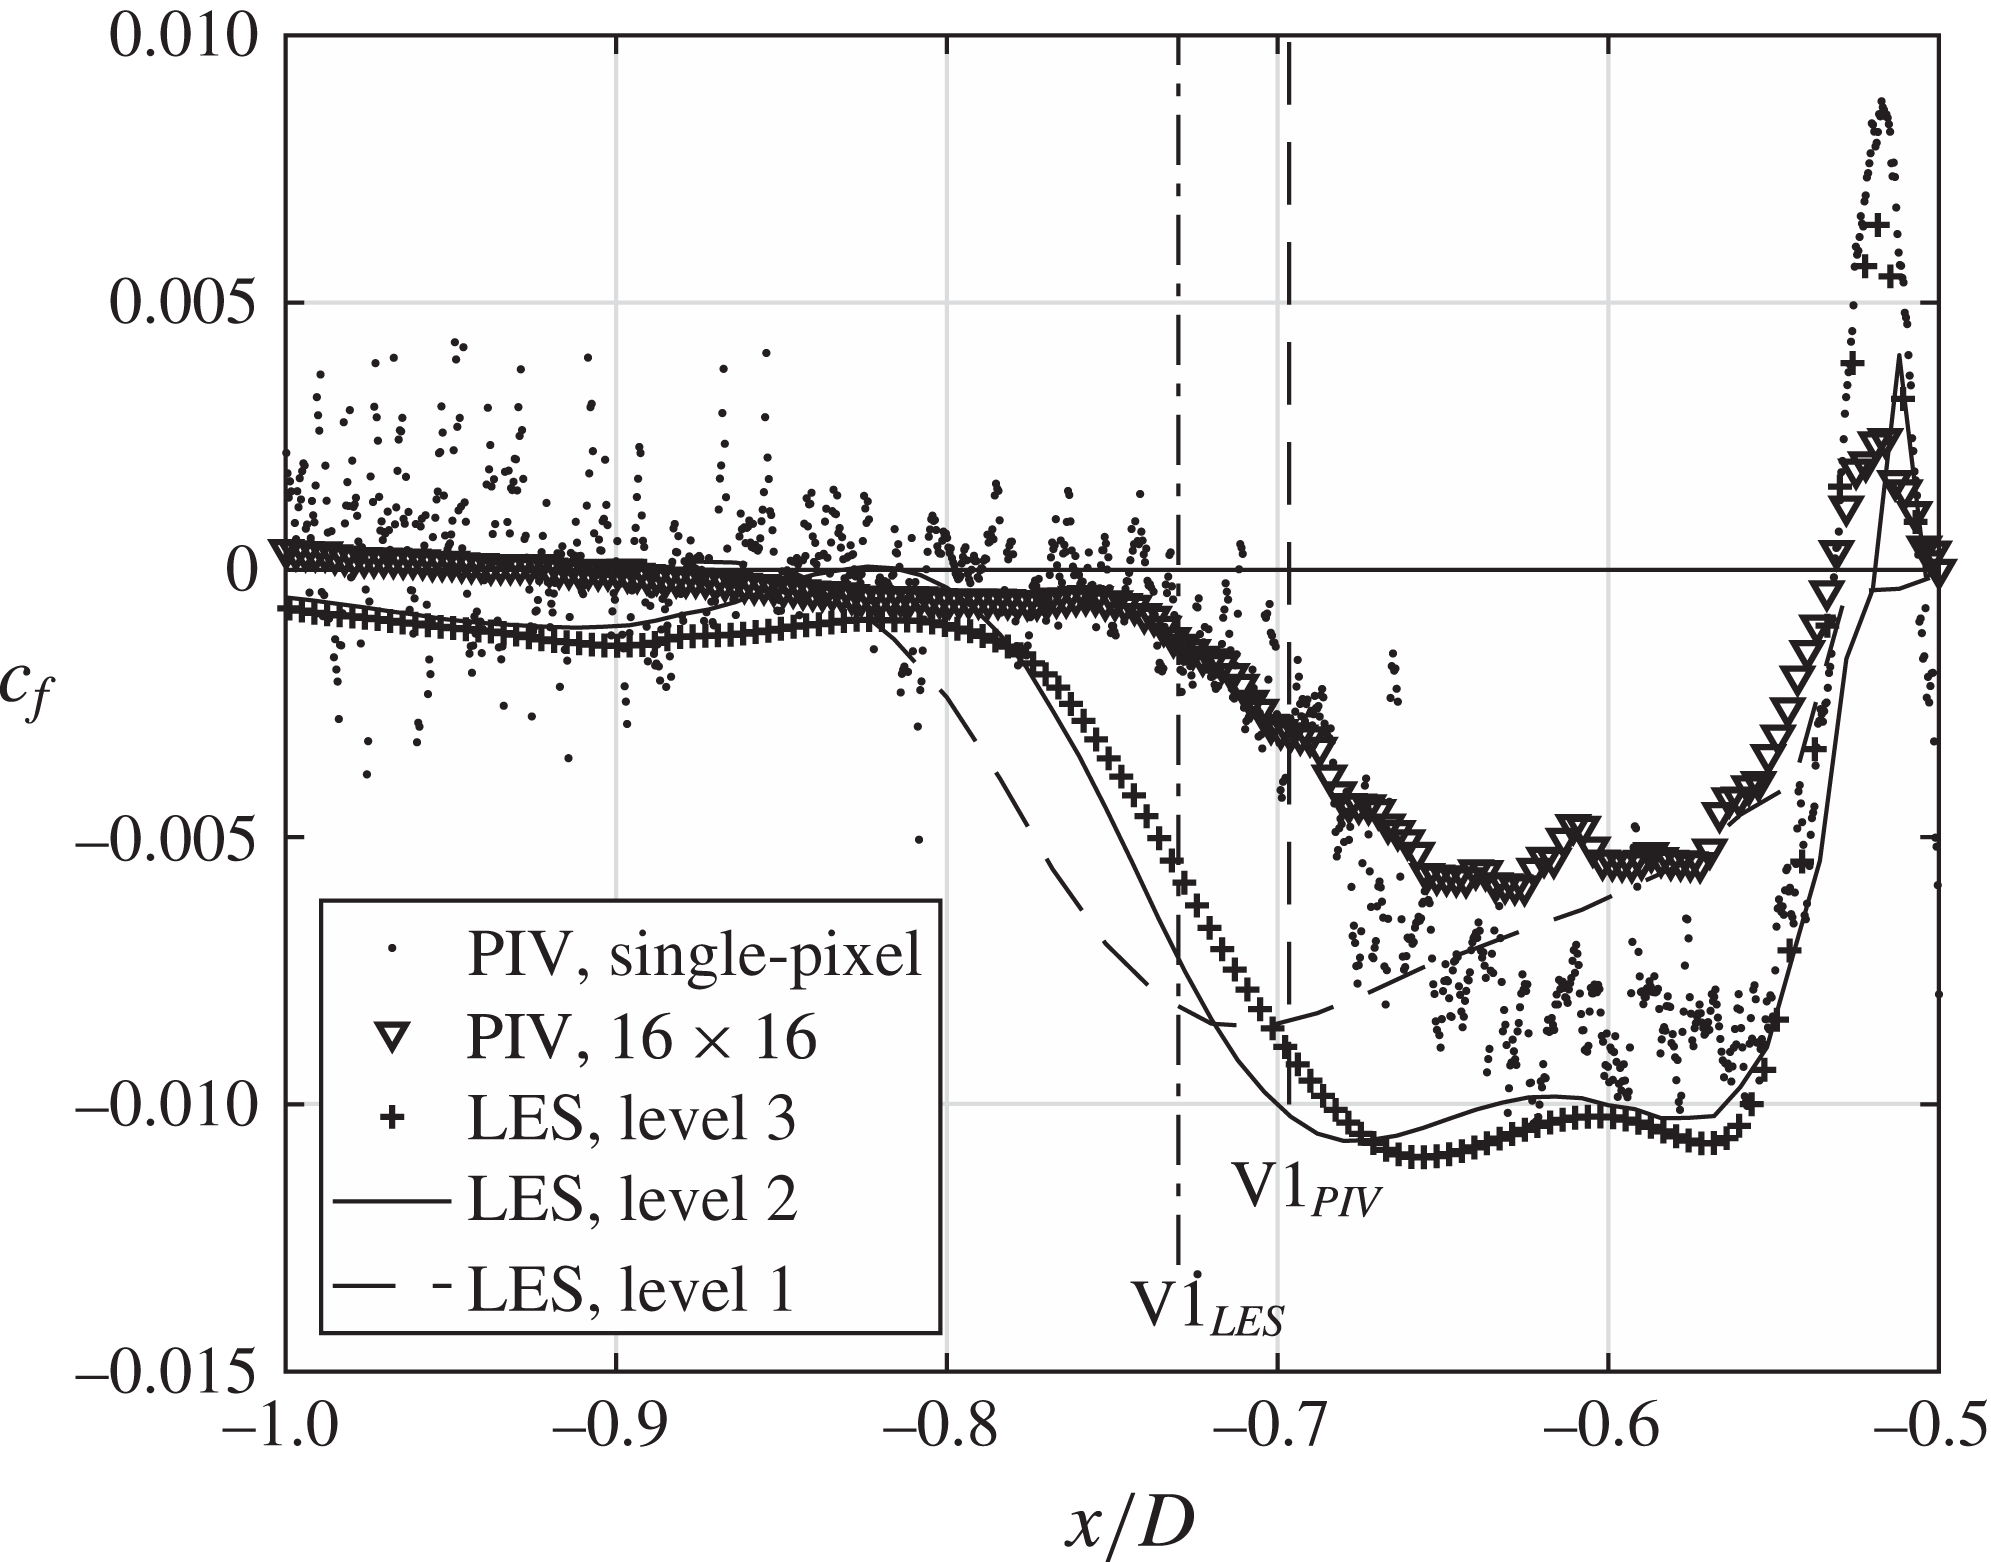
Figure 11. Distribution of the friction coefficient
![]() $c_{f}=\langle \unicode[STIX]{x1D70F}_{w}\rangle /(\unicode[STIX]{x1D70C}/2u_{b}^{2})$
over
$c_{f}=\langle \unicode[STIX]{x1D70F}_{w}\rangle /(\unicode[STIX]{x1D70C}/2u_{b}^{2})$
over
![]() $x/D$
in the symmetry plane in front of the cylinder.
$x/D$
in the symmetry plane in front of the cylinder.
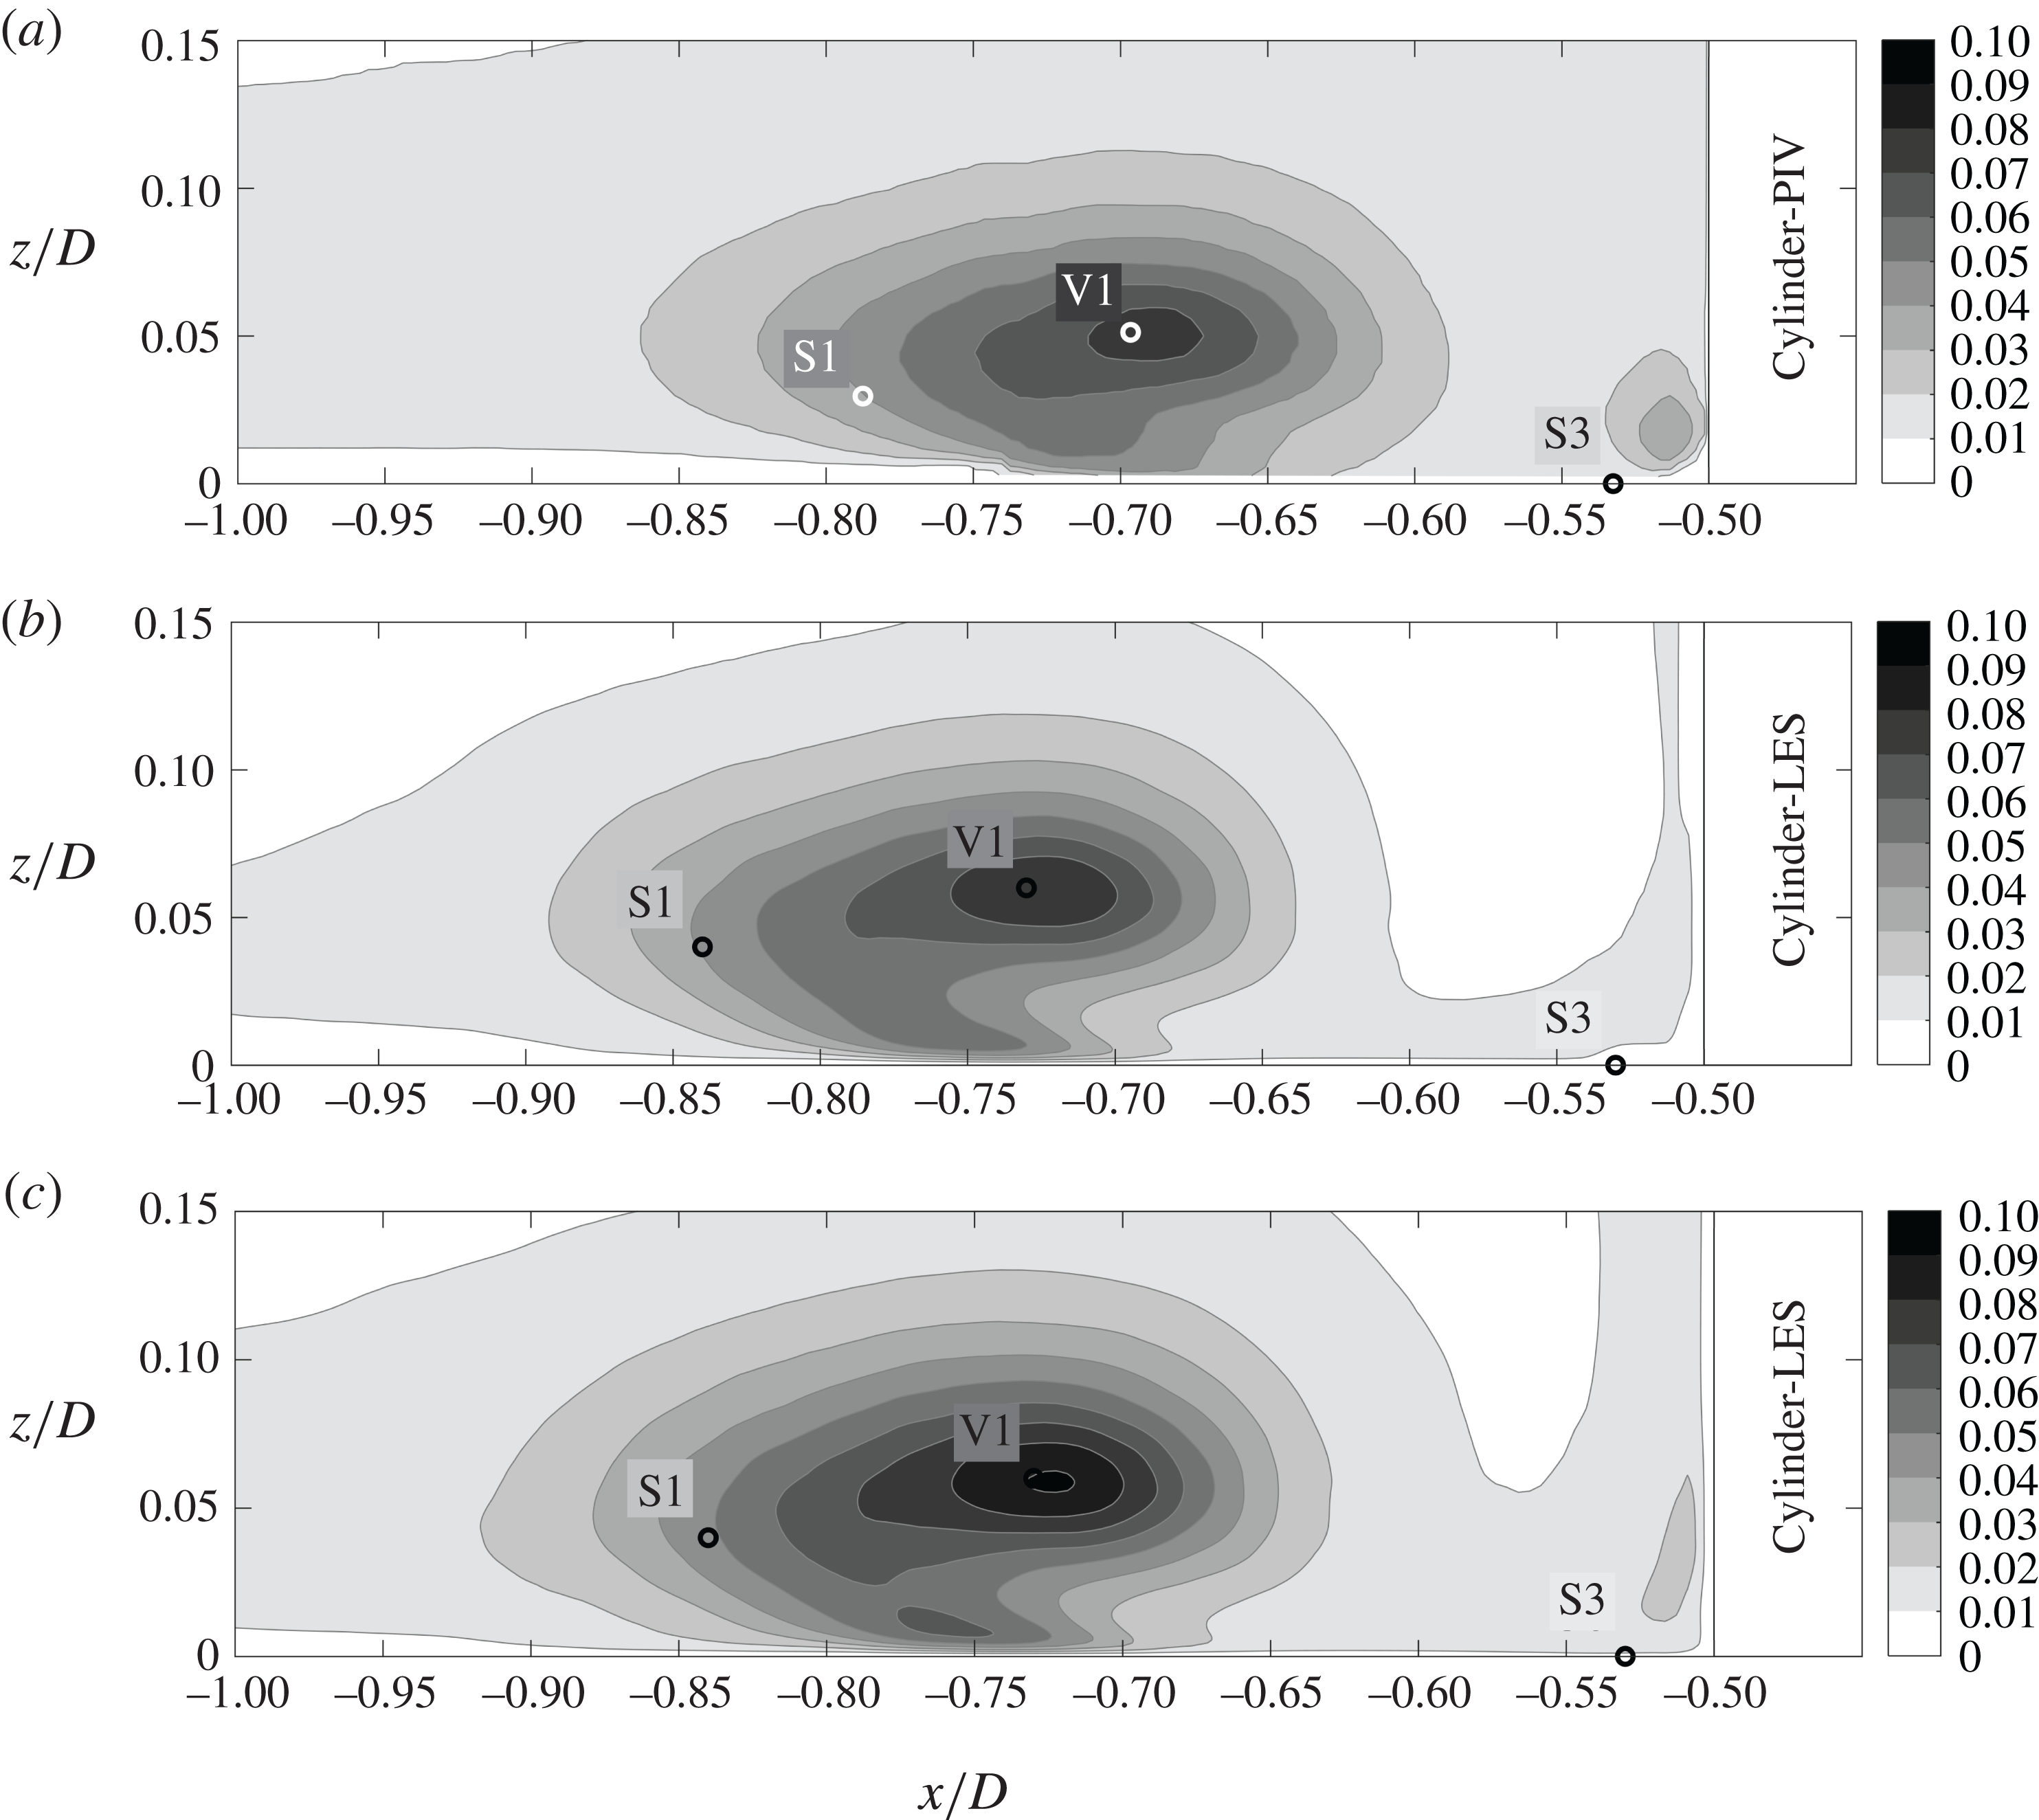
Figure 12. Turbulent kinetic energy in the symmetry plane in front of the cylinder. In-plane turbulent kinetic energy
![]() $k_{ip}/u_{b}^{2}$
measured by PIV (a) and simulated by LES (b). Full turbulent kinetic energy
$k_{ip}/u_{b}^{2}$
measured by PIV (a) and simulated by LES (b). Full turbulent kinetic energy
![]() $k/u_{b}^{2}$
simulated by LES (c).
$k/u_{b}^{2}$
simulated by LES (c).
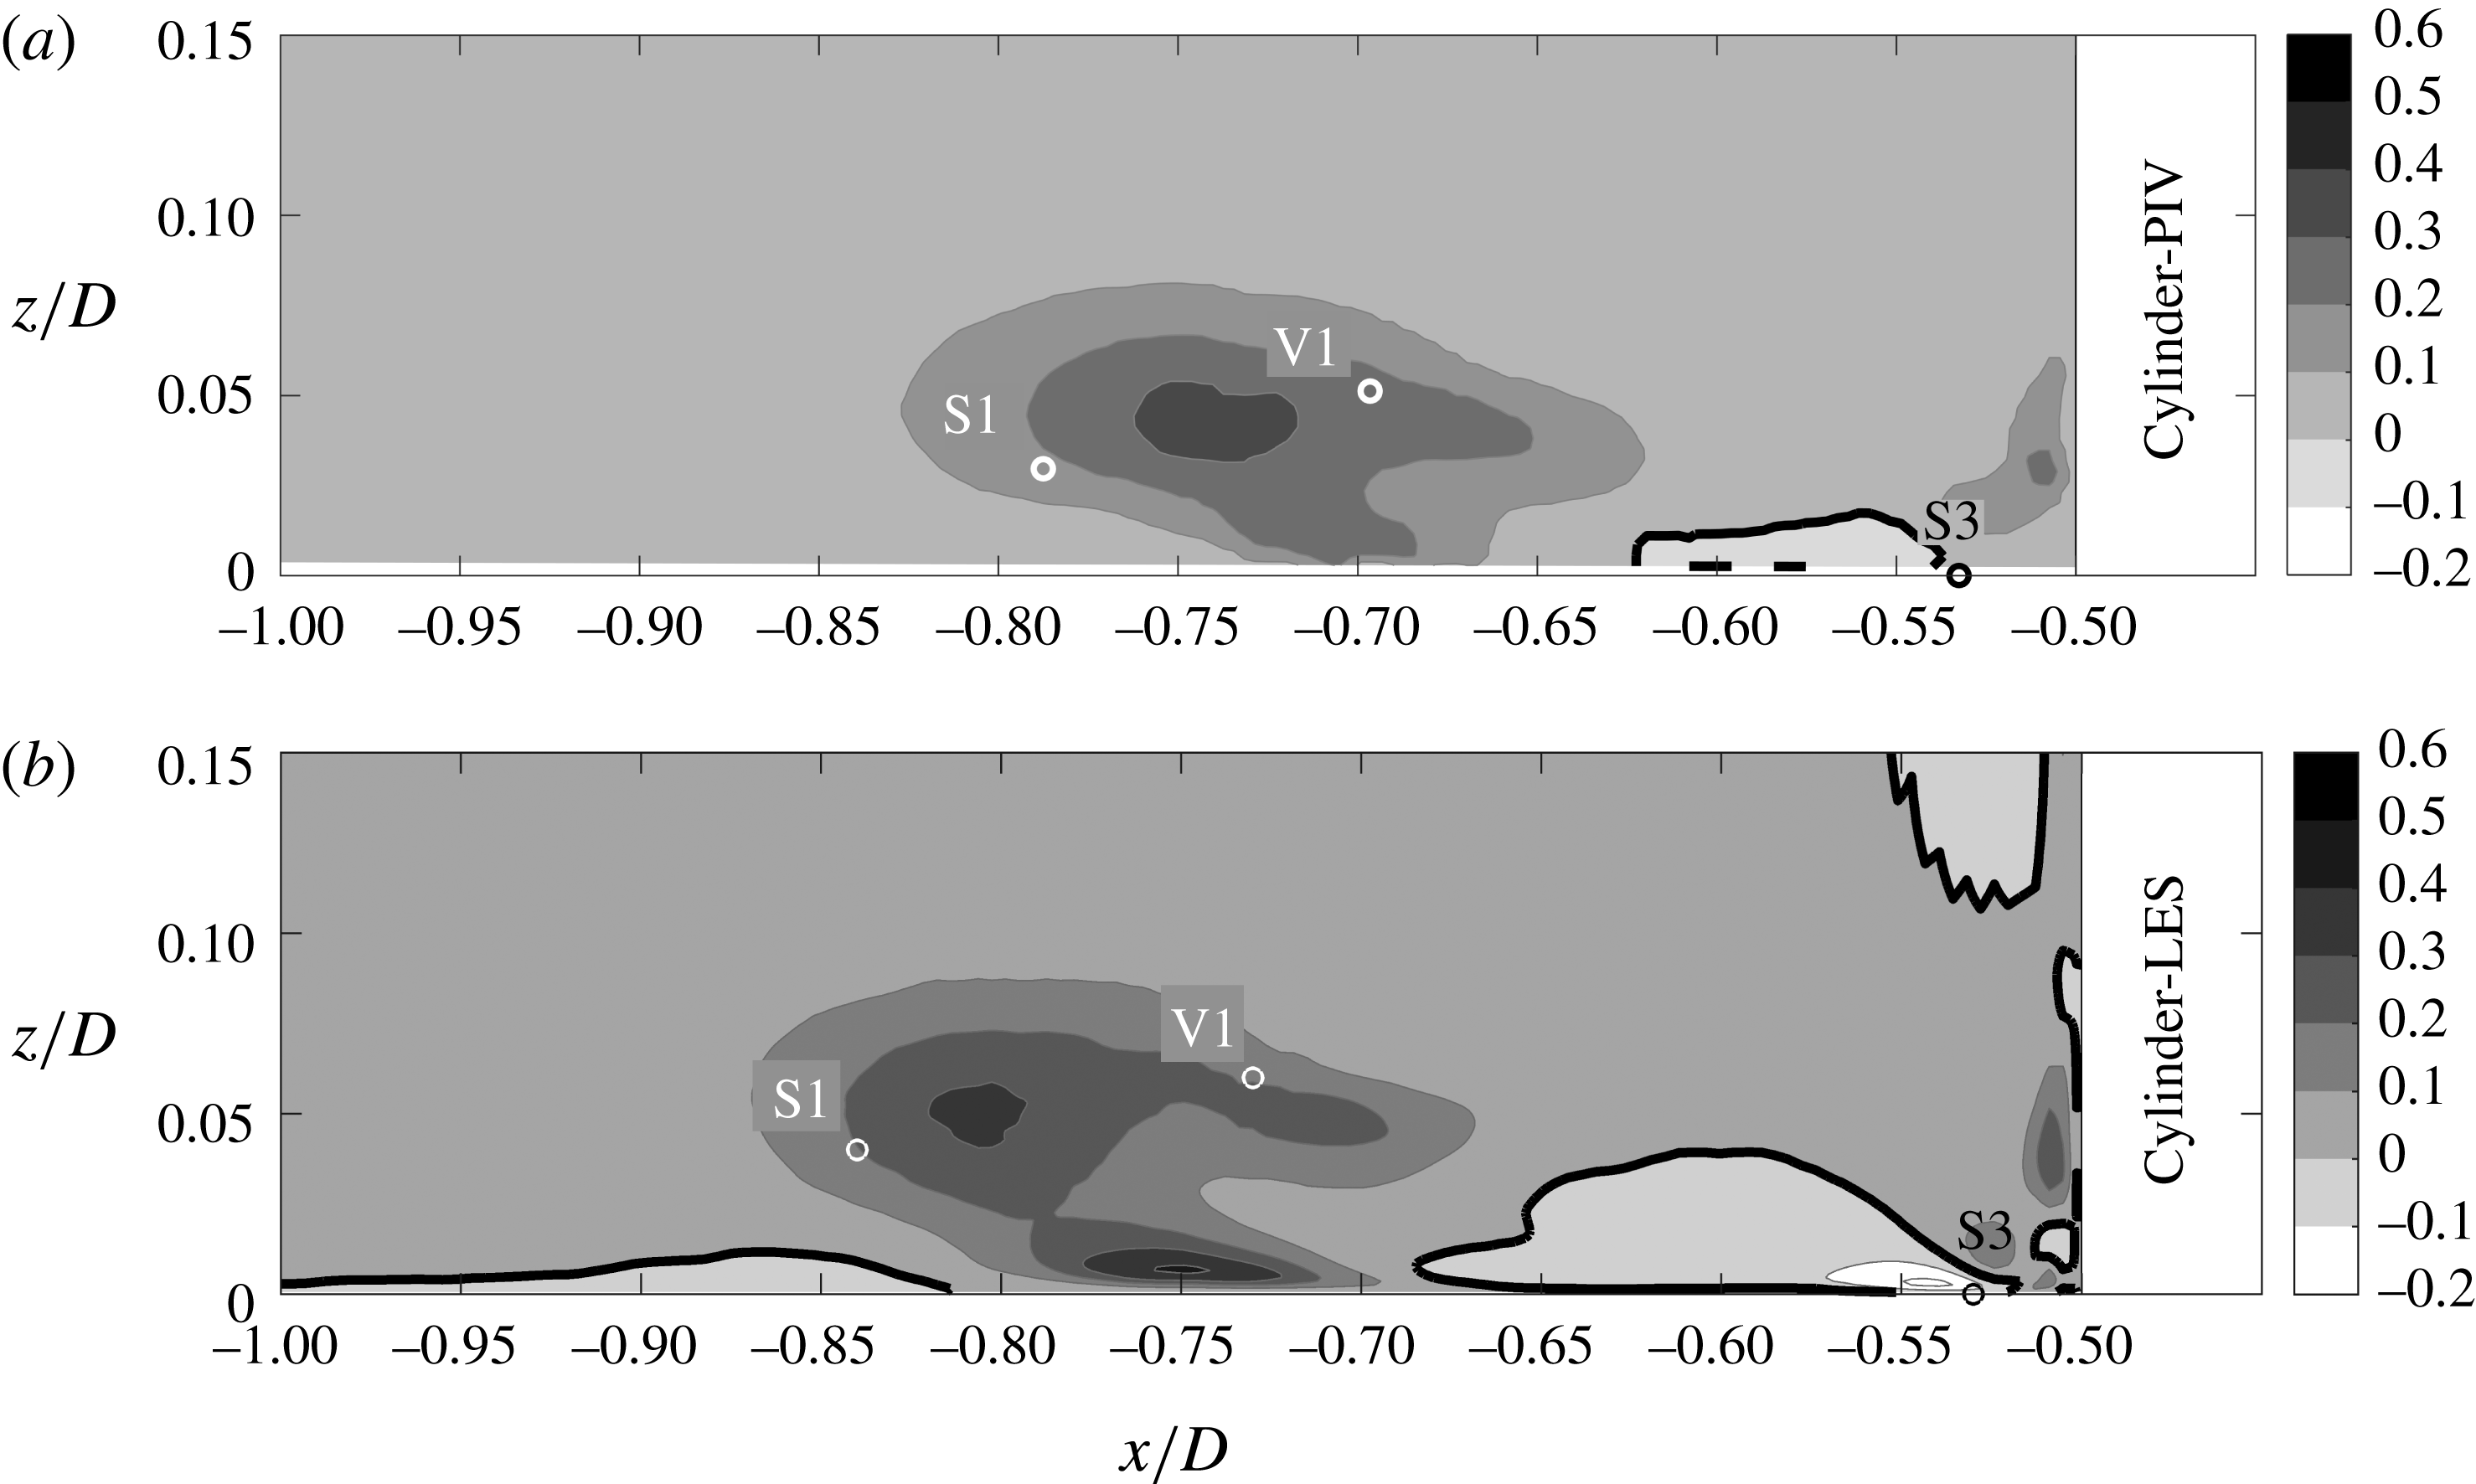
Figure 15. Production of turbulent kinetic energy in the symmetry plane in front of the cylinder. In-plane production from PIV (a) and total production from LES (b). The isoline marks
![]() $PD/u_{b}^{3}=0$
.
$PD/u_{b}^{3}=0$
.
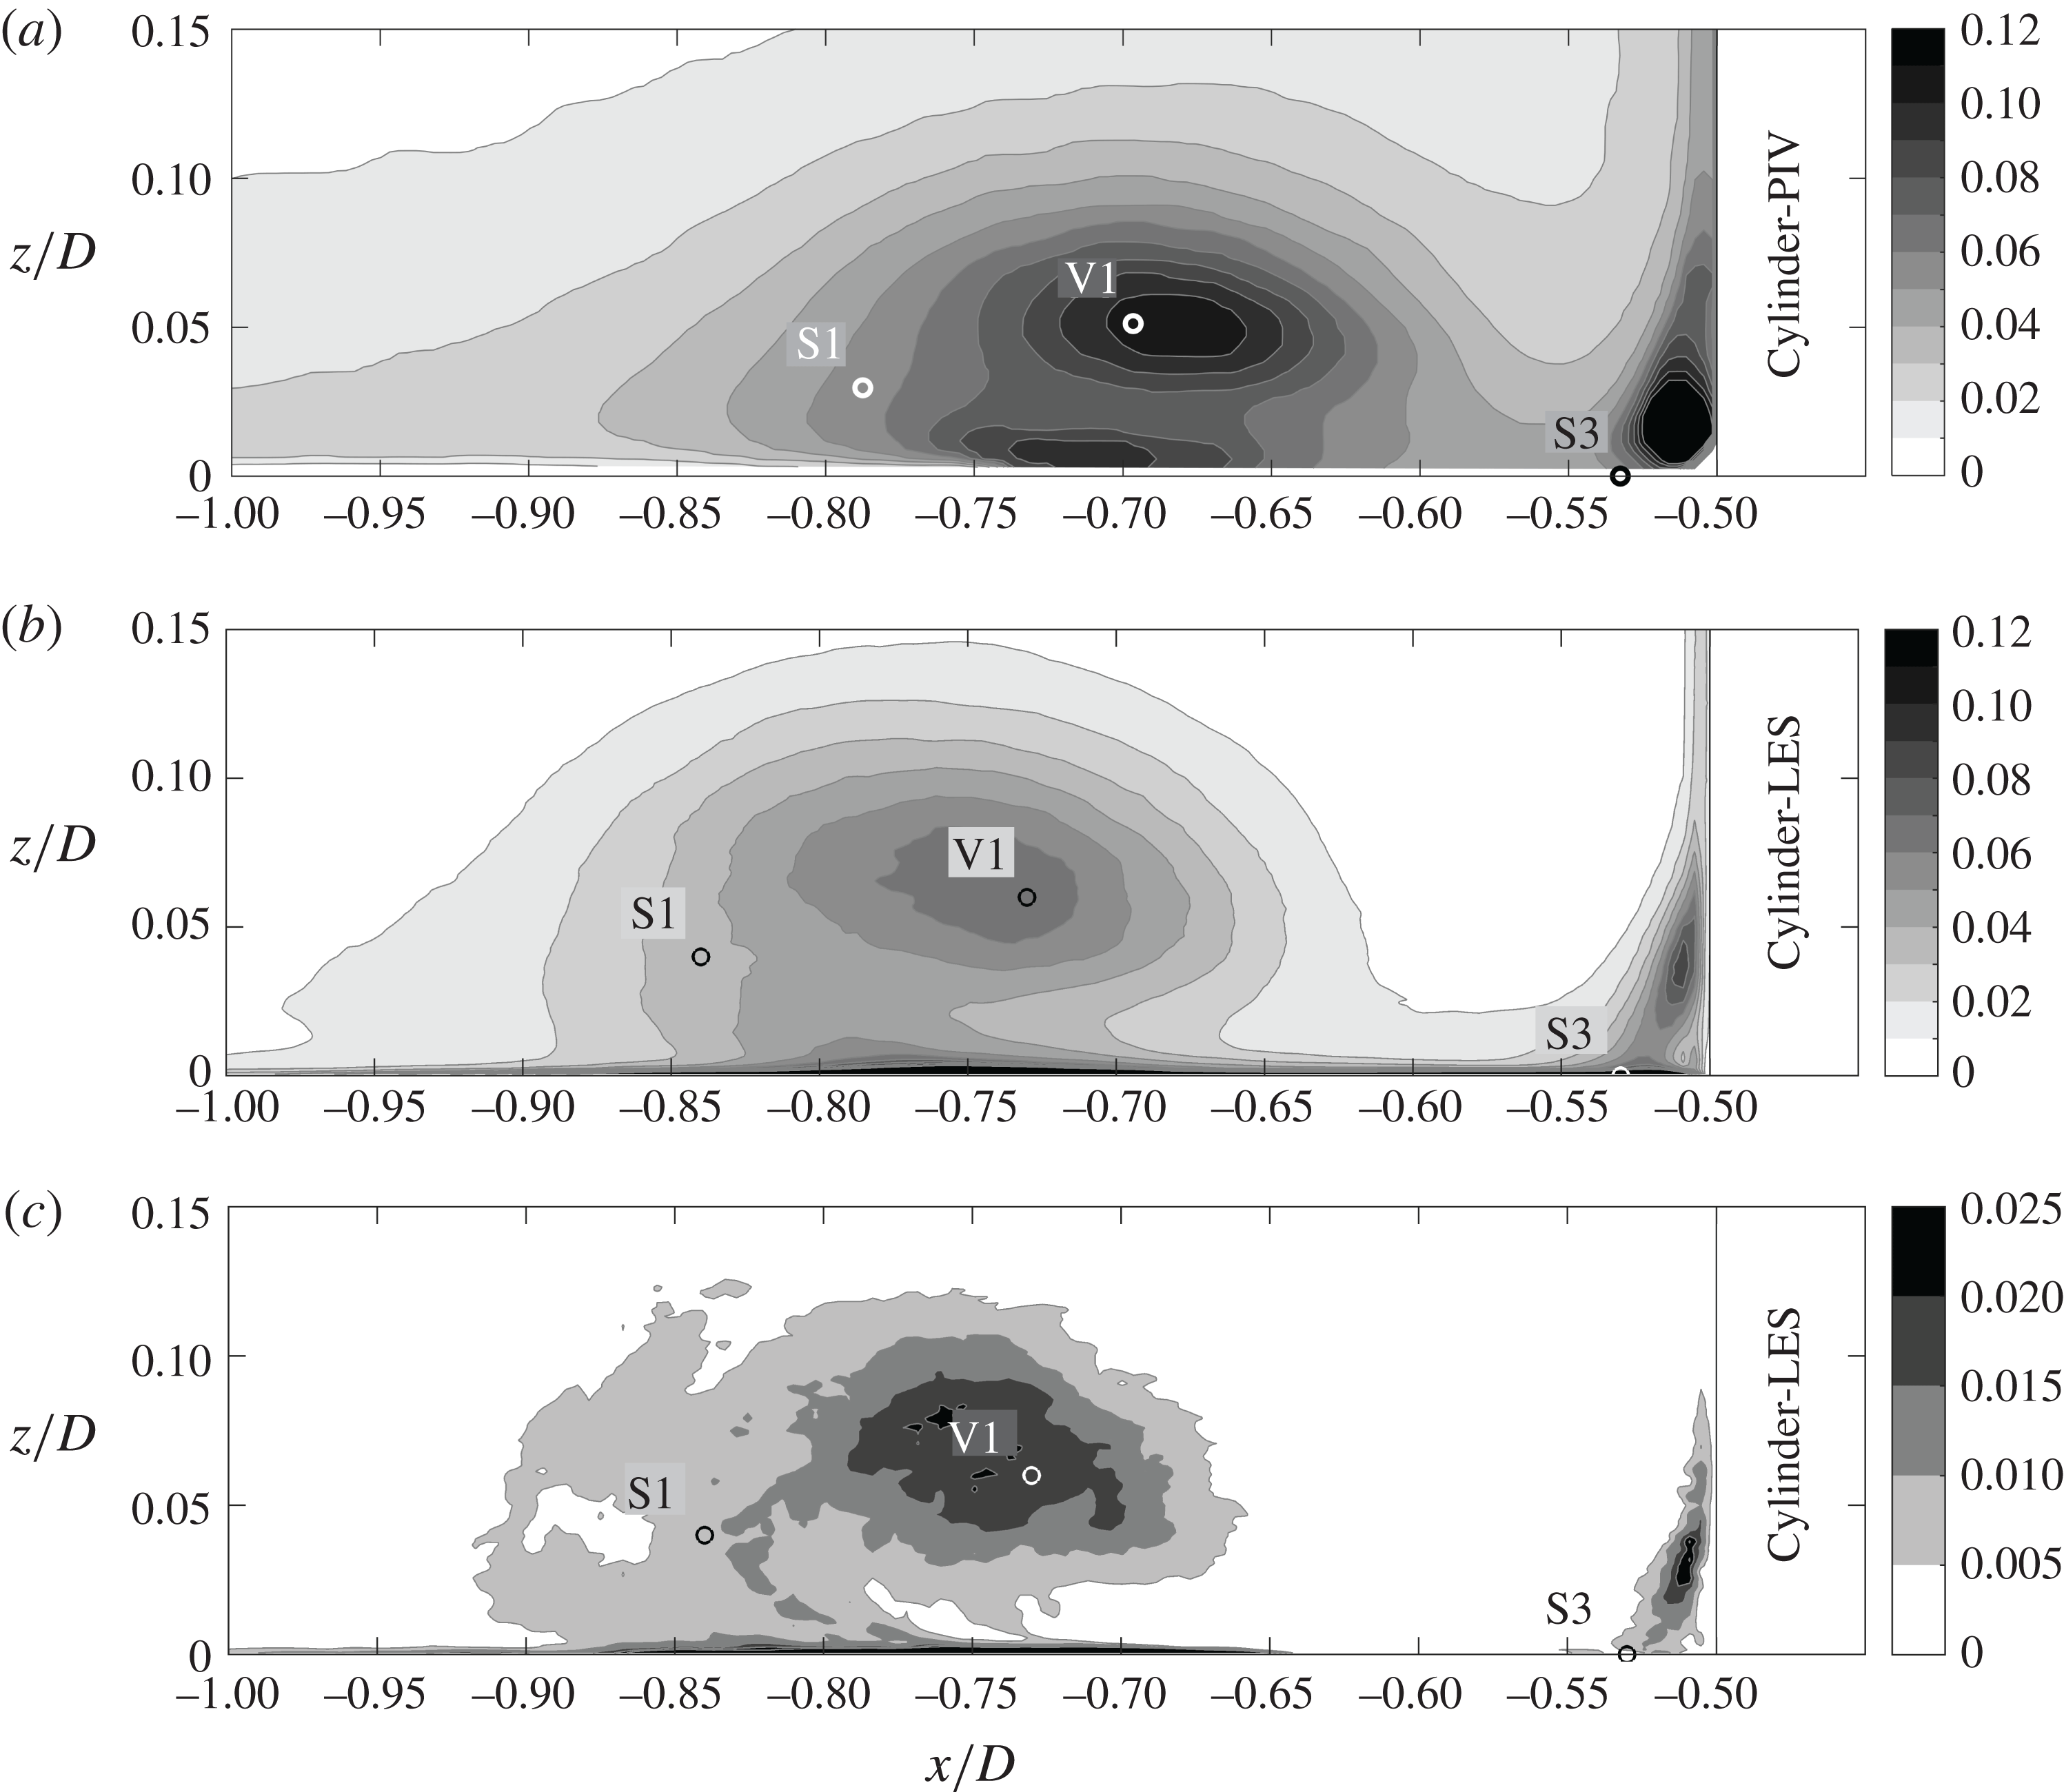
Figure 18. Total dissipation of turbulent kinetic energy
![]() $\unicode[STIX]{x1D716}D/u_{b}^{3}$
taken from PIV (a) and LES (b) and modelled dissipation
$\unicode[STIX]{x1D716}D/u_{b}^{3}$
taken from PIV (a) and LES (b) and modelled dissipation
![]() $\unicode[STIX]{x1D716}_{SGS}D/u_{b}^{3}$
taken from the LES (c) in the symmetry plane in front of the cylinder. Note the different amplitudes of the colour bars.
$\unicode[STIX]{x1D716}_{SGS}D/u_{b}^{3}$
taken from the LES (c) in the symmetry plane in front of the cylinder. Note the different amplitudes of the colour bars.


