Implications
The reported equations of macro- and trace mineral composition and relative deposition rates in the body of growing pigs can be used to revisit net requirements for growth of minerals and to assess input–output mineral balances to realize an efficient use of dietary minerals and a sustainable pig production. Neither gender nor dietary protein level seems necessary to be taken into account to assess the mineral net requirements for growth, when based on BW.
Introduction
An improved efficiency of nutrient use in pig production, while fulfilling animal’s nutrient requirements has received increasing attention by the last decades. As the mineral metabolism is well regulated over homeostatic mechanisms, high dietary safety margins on top of mineral requirements obviously result in increased mineral excretion which compromises the sustainability of livestock production, especially regarding phosphorus (P), copper (Cu) and zinc (Zn) (Dourmad and Jondreville, Reference Dourmad and Jondreville2007; Spiess, Reference Spiess2011; Lopez-Alonso, Reference Lopez-Alonso2012). Dietary safety margins include numerous uncertainties and variabilities in nutrient contents of feed ingredients and in mineral requirements of modern genetics.
The chemical composition and nutrient deposition rates in pigs have evolved with the continuous selection towards lean carcasses (Brocks et al., Reference Brocks, Klont, Buist, de Greef, Tieman and Engel2000). The thrive for diet formulations lower in CP and amino acids contents can also result in modified body composition and nutrient deposition rates (Ruiz-Ascacibar et al., Reference Ruiz-Ascacibar, Stoll, Kreuzer and Bee2018) and can improve bone mineral concentration along with limited dietary P (Varley et al., Reference Varley, Flynn, Callan and O’Doherty2011). In this context, the effect of gender, especially entire males which are more efficient than castrates in converting feed to BW may be of increasing interest. Evolution in genetics, diet composition and increased societal demand for entire males illustrate the need of regular updates about the chemical composition and nutrient deposition rates in the empty body (EB), including minerals.
As the amount of mineral in the EB or the mineral deposition rates represent a major part of the net mineral requirement for growing pigs, their values in modern lean genotypes and their eventual distinction between genders may be used to fine tune net mineral requirement. Challenging the animal by feeding reduced levels of CP and amino acids may also be helpful to model the pig’s metabolic fate (Létourneau-Montminy et al., Reference Létourneau-Montminy, Narcy, Dourmad, Crenshaw and Pomar2015). Finally, dietary intake together with the amount and deposition rates of minerals in the pig’s EB are needed to assess the mineral input-output balances (Jondreville et al., Reference Jondreville, Revy, Dourmad, Nys, Hillion, Pontrucher, Gonzales, Soler, Lizardo and Tibau2004; Rigolot et al., Reference Rigolot, Espagnol, Pomar and Dourmad2010; Menzi et al., Reference Menzi, Stoll and Schlegel2016). These data are necessary to optimize nutrient cycles and planning soil fertilization with animal manure to promote a sustainable agriculture, such as proposed for example in France (Dourmad et al., Reference Dourmad, Levasseur, Daumer, Hassouna, Landrain, Lemaire, Loussouarn, Salaün and Espagnol2015), the Netherlands (Minerals Accounting System) or Switzerland (Richner and Sinaj, Reference Richner and Sinaj2017) now legally bound for 20 years (Swiss Federal Council, 1998).
Thus, the objective of the present study was to assess the dynamics of macro and trace mineral amounts and calculate their relative deposition rates in the EB of female (FE), castrated (CA) and entire male (EM) pigs from birth to 140 kg live weight and fed with two dietary protein levels. The two dietary protein levels also permitted to study their impact on body composition and protein efficiency and validate amino acid requirements (Ruiz-Ascacibar et al., Reference Ruiz-Ascacibar, Stoll, Kreuzer, Boillat, Spring and Bee2017 and Reference Ruiz-Ascacibar, Stoll, Kreuzer and Bee2018).
Material and methods
Animals, experimental diets and design
A detailed description of the experimental design, diets and management protocol was previously presented by Ruiz-Ascacibar et al. (Reference Ruiz-Ascacibar, Stoll, Kreuzer, Boillat, Spring and Bee2017). In brief, a total of 190 Swiss Large White pigs (66 FE, 66 EM and 58 CA) were used which originated from four farrowing rounds from the Agroscope sow herd. The two first farrowing rounds consisted of 106 Premo® (SUISAG, Sempach, Switzerland)×Large White crossbred pigs (serie 1) and the next two of 84 Large White×Large White pigs (serie 2). At birth, each pig received 100 mg of Fe via intramuscular injection (Ferridex®; Werner Stricker AG, Zollikofen, Switzerland). In total, eight of each FE and EM were slaughtered at birth, weighing 1.4±0.44 kg (mean±standard deviation). Thereafter, two pigs at 8.9±0.20 kg BW and eight pigs at 20.8±1.66 kg BW from each gender were slaughtered. At 20 kg BW, the 144 remaining pigs were equally allotted per gender, to one of the six subsequent slaughter weight categories (40, 60, 80, 100, 120 or 140 kg BW) and assigned to either control (C) or low CP (LP) diet. The ad libitum fed starter (weaning – 20 kg BW), grower (20 to 60 kg BW), finisher I (60 to 100 kg BW) and finisher II diets (100 to 140 kg BW) were formulated for pigs weighing 10, 40, 80 and 120 kg BW, respectively and to contain, per kilogram, 13.9, 13.2, 13.2 and 13.2 MJ digestible energy, 6.5, 6.5, 7.0, 5.8 and 4.4 g total Ca and 2.8, 2.8, 2.7, 2.2 and 1.8 g apparent total tract digestible P, respectively. Supplemental Ca and P sources were calcium formate (providing 3.12 g Ca/kg diet) and calcium butyrate (providing 0.28 g Ca/kg diet) in the starter diet and calcium carbonate and mono- or dicalcium phosphate in all diets. All diets contained 500 FTU/kg of microbial phytase (Natuphos® 5000G; BASF, Ludwigshafen, Germany, 0.16 g digestible P/100 FTU). Trace minerals and vitamins were added to the diet via a premix (Table 1). The LP grower, finisher I and II diets were formulated to contain 80% digestible CP, lysine, methionine+cystine, threonine and tryptophan compared with the respective treatment C diets. In both treatments, the grower, finisher I and II diets for EM contained 5% more digestible CP, digestible lysine, methionine+cystine, threonine and tryptophan than the diets for FE and CA. The diet formulation, as well as, the analyzed contents of crude fat, crude fibre, ADF, NDF, CP and amino acids are outlined by Ruiz-Ascacibar et al. (Reference Ruiz-Ascacibar, Stoll, Kreuzer, Boillat, Spring and Bee2017). Diets were produced at the Agroscope experimental feed mill and were pelleted (60°C, 4 mm diameter). The software Allix2 (A-Systems SA, Versailles, France) was used to formulate the diets, based on the analyzed DM, CP, essential amino acids, crude fibre and ash contents of each batch of the feedstuff. The macro mineral contents and the coefficients for digestible P of each feedstuff were formulated according to reference values (Agroscope, 2016).
Table 1 Ash, macro mineral (g/kg as fed) and trace mineral (mg/kg as fed) concentration of the control and low protein grower, finisher I and finisher II diets
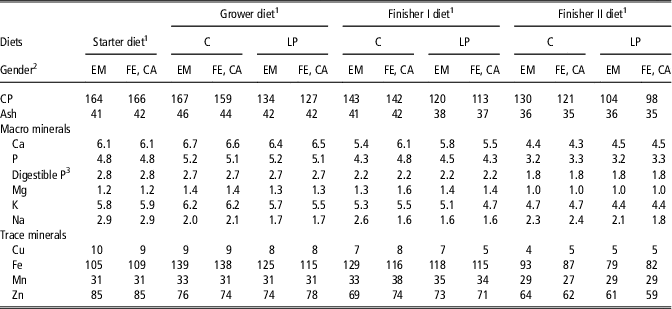
C=control diets formulated to meet nutrient requirements; LP=reduced protein diet formulated to contain, 80% of digestible dietary CP, lysine, methionine+cystine, threonine and tryptophan of C; EM=entire males; FE=females; CA=castrates.
1 Starter, grower, finisher I and finisher II diets were offered ad libitum from weaning (4 weeks of age) to 20, 20 to 60, 60 to 100 and 100 to 140 kg BW, respectively. Trace minerals and vitamins were added to the diet via a premix to provide, respectively per kilogram of starter diet and per kilogram of grower, finisher I and finisher II diets, 6 and 4 mg of Cu (CuSO4*5H2O), 80 and 20 mg of iron (Fe; FeSO4*H2O), 10 and 10 mg manganese (Mn; MnO), 75 and 55 mg Zn (ZnO), 0.15 and 0.15 mg Iodine (Ca(IO3)2), 0.20 and 0.15 mg selenium (Na2SeO3), 8000 and 4000 IU vitamin A, 1000 and 400 IU vitamin D3, 25 and 65 mg vitamin E, 3 and 1 mg vitamin K3, 2 and 2 mg thiamine, 5 and 3 mg riboflavin, 0.1 and 0.05 mg biotin, 20 and 15 mg niacin, 15 and 15 mg pantothenic acid, 300 and 200 mg choline, 4 and 3 mg vitamin B6, 0.5 and 0.5 mg folate and 0.02 and 0.02 mg vitamin B12.
2 The diets fed to EM contained 5% more lysine, methionine+cystine, threonine and tryptophan than the respective diets for FE and CA.
3 Calculated.
Slaughter procedure and sampling
The serial slaughter method, sampling and grinding procedures were detailed by Ruiz-Ascacibar et al. (Reference Ruiz-Ascacibar, Stoll, Kreuzer, Boillat, Spring and Bee2017). In brief, when the individual pigs reached their target BW for slaughter, they were fasted for ~16 h, stunned with CO2 and exsanguinated. The mineral composition of the EB of each pig was determined from a representative homogenous subsample of each of the following, previously weighted, five fractions: (I) carcass (including head, tail and feet), (II) viscera (including heart, kidneys, liver, lungs, tongue, spleen, eyes, brain, ear, mesentery, belly fat, empty bladder, empty gallbladder, empty stomach, empty large intestine and empty hindgut), (III) blood, (IV) skin and claws and (V) bile. All subsamples were stored at −20°C until lyophilization (Christ, delta 2-24 LSC, Newtown, UK) for 70 h before their chemical analysis.
Chemical analyses
Separate aliquots of the different body fractions, as well as diets were analyzed for dry matter, ash and mineral content. Dry matter content was quantified thermo-gravimetrically by heating at 105°C for 3 h (Leco, Mönchengladbach, Germany) and ash content was subsequently determined after incineration at 550°C until constant weight was attained. A second DM determination was performed on an aliquot sample in a ventilated oven to determine its residual water content after freeze-drying. Dry ashed samples were solubilized with nitric acid and their mineral (Ca, P, Mg, K, Na, Fe, Zn, Mn, Cu) content was analyzed according to the European Standard EN 155510:2008 using an inductively coupled plasma optical emission spectrometer (ICP-OES, Optima 7300 DV; Perkin-Elmer, Schwerzenbach, Switzerland). Mineral analysis was performed in duplicate. The defined limit of quantification was, per kilogram, 0.12 g for Ca, P, K and Mg, 0.05 g for Na and 2.5 mg for Cu, Fe, Mn and Zn. Those were defined according to signal-to-noise approach of a reference sample. If the obtained duplicated mean was below the limit of quantification, the considered mean of the duplicated signal was re-calculated by defining the individual positive signals as such and individual negative signals as 0.
Calculations and statistical analysis
The proportionate hot wet weight of each fraction together with the chemical content of each of the five fractions were used to calculate the hot EB mineral composition in each pig (Supplementary Tables S1 and S2). The amount of macro and trace mineral in the hot EB and amount of ash, Ca and P relative to body protein were analyzed using the ANOVA procedure of SYSTAT 13 (SYSTAT Software, Inc.) considering the combinations of diet and gender being the experimental groups (C-FE, C-EM, C-CA, LP-FE, LP-EM, LP-CA), serie and the two-way interaction as fixed effects. Significant differences in the EB weight (EBW) between diets and among genders, within each slaughter weight category were observed when data were first analyzed. This might explain the general lack of normally distributed data. Thus, as pre-treatment of the data was necessary which is described in the Supplementary Material S1. In brief, the original individual amounts of minerals in the EB were transformed using an allometric model with standardized EBW categories. Ranks were then assigned to the transformed data within each BW category from 40 to 140 kg. The ranked transformed data were subsequently subjected to the ANOVA procedure of SYSTAT 13 (SYSTAT Software, Inc.) considering the experimental groups (C-FE, C-EM, C-CA, LP-FE, LP-EM, LP-CA), serie and the two-way interaction as fixed effects. When the effect of the aforementioned experimental group factor was P<0.10, the factor was considered and predefined orthogonal contrasts were tested (FE v. CA fed diet C, FE v. CA fed LP, EM pigs v. FE/CA fed diet C, EM pigs v. FE/CA fed LP and Diet C v. diet LP, regardless of gender) to assess whether any of the experimental groups could be plotted in the same regression equation. Contrasts were considered different when P<0.05 and tendencies were noted at P<0.10. Based on the outcome of the orthogonal contrast, the amount of original mineral (ash, Ca, P, Mg, K, Na, Cu, Fe, Mn and Zn) in the EB and the amount of ash, Ca and P relative to body protein from birth to 140 kg BW were grouped and fitted using the original data and the non-linear procedure of SYSTAT 13, to the following respective allometric regressions; Y=a×EBWb and Y=a×amount of protein in the EBb where Y is the predicted amount of mineral in the EB, b the allometric coefficient and a the constant. The EB mineral relative deposition per gain of EBW was calculated as the first derivative of the aforementioned allometric function for each EBW (Y=a×b×EBW(b-1)). The coefficient of determination (R 2) was used to calculate the goodness of fit. The residual standard error (RSE) was used to evaluate the variability in the dependent variable unexplained by the model.
Results
Diet composition
The analyzed major nutrient concentrations, including CP and amino acids are described by Ruiz-Ascacibar et al. (Reference Ruiz-Ascacibar, Stoll, Kreuzer, Boillat, Spring and Bee2017) and the CP, ash, macro- and trace mineral concentrations of the experimental diets are shown in Table 1. The dietary mineral concentrations were consistent with expected values, except that Ca concentration in the starter and grower diets were 5% to 7% lower than expected. Sodium concentration in the grower and finisher I C-diets fed to EM were higher than and Ca and P concentrations in the finisher I C-diets fed to FE and CA were slightly higher than in the other corresponding treatment diets.
Effects of gender and diet on the amounts of minerals in the empty body
The ash, macro- and trace mineral composition in the EB of FE, EM and CA pigs fed either the C or LP diets are shown, according to BW category, in the Supplementary Tables S1 and S2 and their amount in the two major fractions being carcass and viscera, are presented in the Supplementary Tables S3 to S6. The estimated least square means of water and macro and trace mineral amount in the EB and of ash, Ca and P amount relative to body protein are presented in Table 2. No experimental group×serie interactions were observed for any of the body components. Amount of water was greater (P<0.05) in pigs fed C than LP and decreased (P<0.05) from EM to FE and to CA. Amounts of Ca, P, Mg, Cu, Mn and Zn were independent from experimental groups (P>0.10). Nevertheless, pigs fed LP tended to have 5% greater (P<0.10) amount of ash and had 4% lower (P<0.001) amount of K. Entire males had respectively 4% and 8% greater (P<0.001) amounts of K and Na and tended (P<0.10) to have greater amounts of Fe than FE and CA pigs. The amounts of ash, Ca and P in the EB relative to body protein were respectively 9%, 10% and 12% greater (P<0.001) in pigs fed LP than C. In addition, LP-CA had a 6% higher (P<0.001) amount of Ca relative to body protein than LP-FE and C-CA and C-FE had a 5% greater (P<0.001) amount of P relative to body protein than C-EM.
Table 2 AmountFootnote 1 of water, protein, ash, macro mineral (g) and trace mineral (mg) in the empty body of female, entire male and castrated pigs fed either a control or low CP diet from 20 kg BW onwards
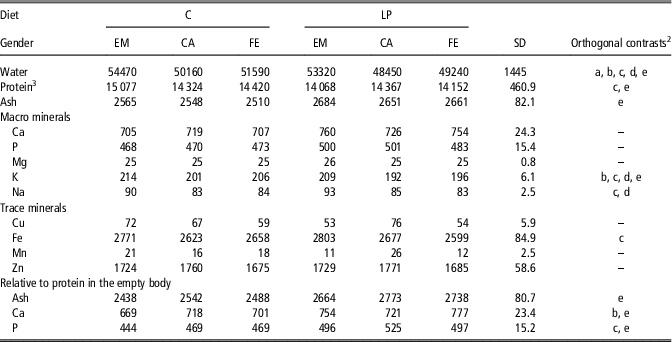
C=control diets formulated to meet nutrient requirements; LP=reduced protein diet formulated to contain 80% of digestible dietary CP, lysine, methionine+cystine, threonine and tryptophan of C; EM=entire males; CA=castrates; FE=females.
1 Results are expressed as means of the mineral amount of the transformed data (detailed description in Supplementary Material S1). These transformed data correspond to an average empty BW of 87±6.9 kg and to an average protein amount in the empty BW of 14.4±5.53 kg. Values estimated across the BW categories of 40, 60, 80, 100, 120 and 140 kg. To assess whether any of the experimental groups could be plotted in the same regression equation, transformed data were subjected to the ANOVA procedure considering the experimental groups (C-FE, C-EM, C-CA, LP-FE, LP-EM and LP-CA), period and the two-way interaction as fixed effects, followed by orthogonal contrast in case of P<0.10.
2 Significant (P<0.05) orthogonal contrast were expressed by a letter as follows: a=C-FE v. C-CA; b=LP-FE v. LP-CA; c=C-EM v. C-FE/CA; d=LP-EM v. LP-FE/CA; and e=C-FE/EM/CA v. LP-FE/EM/CA.
3 Protein amount in the empty body of the different pig groups was published by Ruiz-Ascacibar et al. (Reference Ruiz-Ascacibar, Stoll, Kreuzer and Bee2018) and included here for illustrative reasons.
Dynamics of ash and mineral amount and relative deposition rates
The allometric regression coefficients determined for the amounts of the macro and trace minerals in the EB and for the amounts of ash, Ca and P relative to body protein in the EB are grouped according to the outcome of the orthogonal test (Table 3) and presented for each treatment separately (Supplementary Tables S7 and S8). The R 2 of the allometric equations was high (from 0.923 to 0.993) for the amounts of ash, Ca, P, Mg, K, Na, Fe and Zn in the EB and the RSE represented 4% to 14% of the average amount of minerals. The R 2 of the allometric equations for the amounts of ash, Ca and P relative to body protein were also high (from 0.923 to 0.988). The amounts of Mn and Cu in the EB were however extremely low and their inter-individual variation was high resulting to low R 2 (Mn=0.063; Cu=0.330) and high RSE (Mn=27.6; Cu=50.6) of their allometric equations.
Table 3 Allometric growth coefficientsFootnote 1 for the amounts of macro mineral (g) and trace mineral (mg) in the empty body of female, entire male and castrated pigs from birth to 140 kg BW, fed either a control or low CP diet from 20 kg BW onwards
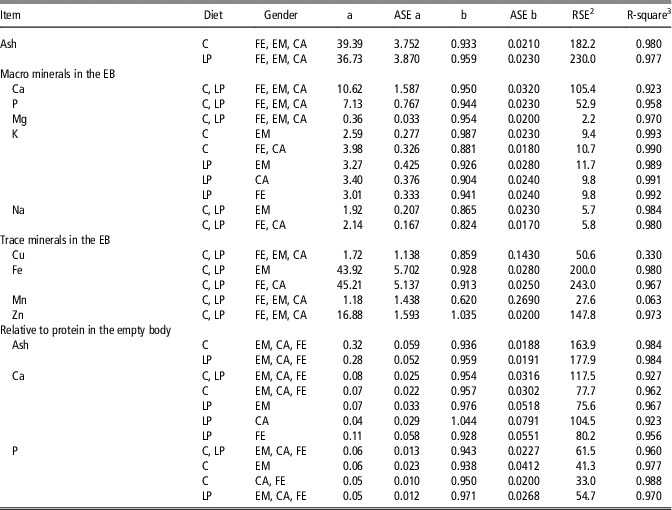
ASE=Asymptotic standard error; C=control diets formulated to meet nutrient requirements; LP=reduced protein diet formulated to contain 80% of digestible dietary CP, lysine, methionine+cystine, threonine and tryptophan of CFE=females; EM=entire males; CA=castrates.
1 The allometric regressions used were as follows: Y=a×EBWb or Y=a×amount of protein in the EBb where Y=predicted amount of ash or mineral in the EB; EBW=empty BW; b=allometric coefficient; a=constant; R 2 is based on the original and untransformed data. Grouped based on orthogonal contrasts in Table 2.
2 Residual standard error (RSE)=((SSE)/(n-2))1/2; where SSE=error sum of squares; n-2=degrees of freedom.
3 R-square=coefficient of determination.
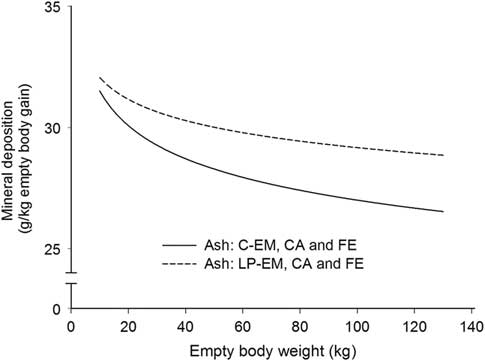
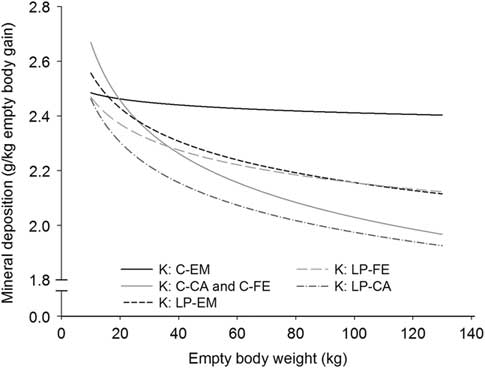
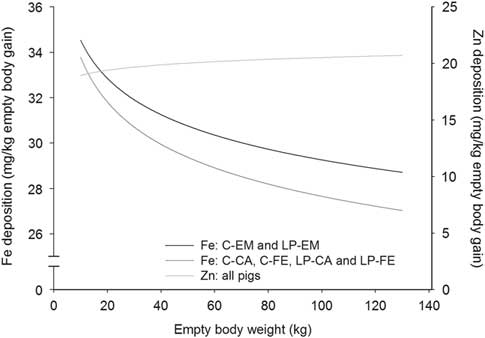
With the exception for Zn in the EB and for Ca relative to body protein of CA pigs fed LP, all b coefficients were below 1, explaining the decline of ash, Ca, P, Mg, K, Na and Fe relative deposition rates with increasing EBW, illustrated in Figures 1–5 as derivates of the respective allometric regressions of the amounts (Table 3). With increasing EBW, the amount of K in the EB of C-CA C-FE, LP-EM and LP-FE were overlaid and thus seemed similar during almost the whole growth period, but were lower than C-EM and greater than LP-CA. From ~26 kg EBW, the relative K deposition rate was greatest in C-EM which was also constant and lowest in LP-CA which drastically decreased with increasing EBW (Figure 3). Finally, relative Na and Fe deposition rates in FE and CA declined faster than in EM (Figures 4 and 5).
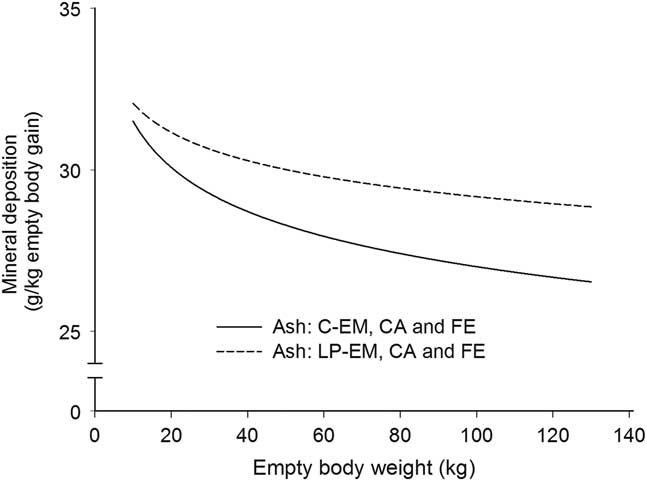
Figure 1 Deposition rate of ash in the empty body with increasing empty BW of pigs grouped according to orthogonal contrast of treatments. C=control diet formulated to meet nutrient requirement according to the Swiss feeding recommendations for pigs; LP=low protein diet with 80% CP, lysine, methionine +cystine, threonine and tryptophan of C. EM=entire male; CA=castrated; FE=female.
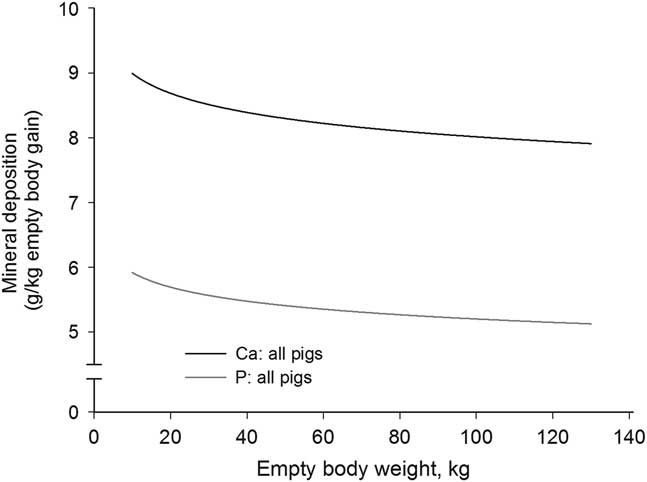
Figure 2 Deposition rate of calcium (Ca) and phosphorus (P) in the empty body with increasing empty BW of pigs grouped according to orthogonal contrast of treatments.
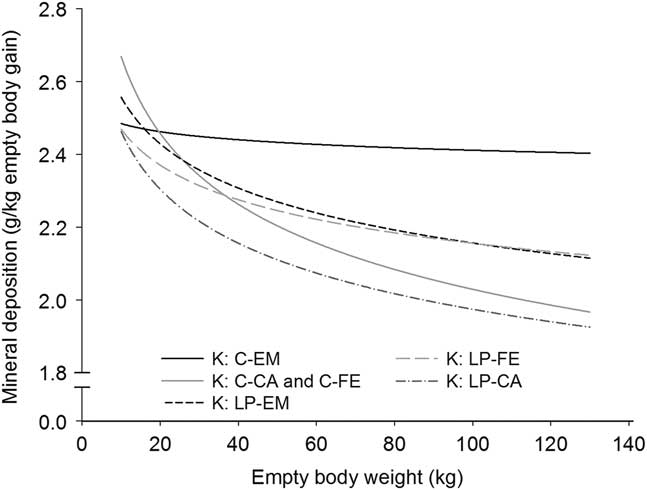
Figure 3 Deposition rate of potassium in the empty body with increasing empty BW of pigs grouped according to orthogonal contrast of treatments. C=control diet formulated to meet nutrient requirement according to the Swiss feeding recommendations for pigs; LP=low protein diet with 80% CP, lysine, methionine +cystine, threonine and tryptophan of C. EM=entire male; CA=castrated; FE=female.
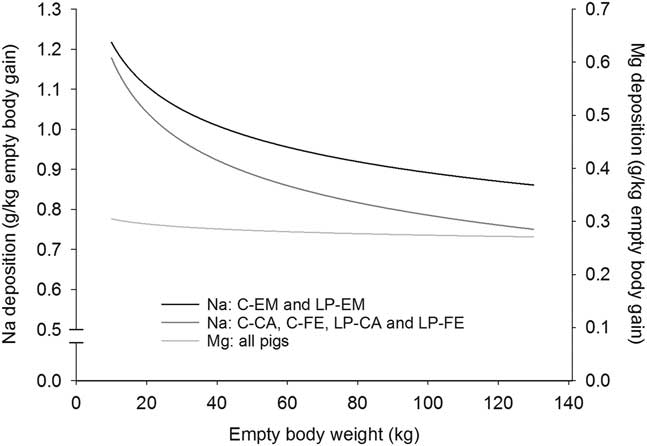
Figure 4 Deposition rate of magnesium (Mg) and sodium (Na) in the empty body with increasing empty BW of pigs grouped according to orthogonal contrast of treatments. C=control diet formulated to meet nutrient requirement according to the Swiss feeding recommendations for pigs; LP=low protein diet with 80% CP, lysine, methionine +cystine, threonine and tryptophan of C. EM=entire male; CA=castrated; FE=female.
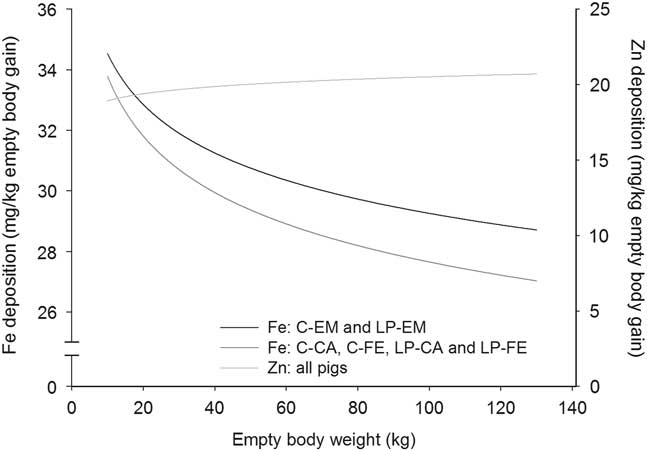
Figure 5 Deposition rate of iron (Fe) and zinc (Zn) in the empty body with increasing empty BW of pigs grouped according to orthogonal contrast of treatments. C=control diet formulated to meet nutrient requirement according to the Swiss feeding recommendations for pigs; LP=low protein diet with 80% CP, lysine, methionine+cystine, threonine and tryptophan of C; EM=entire male; CA=castrated; FE=female.
Discussion
Suitability of the used allometric model
The allometric model was chosen to describe the dynamics of mineral amounts in the EB according to BW as its biological interpretation is easy and the derivates are simple and stable (Schinckel et al., Reference Schinckel, Mahan, Wiseman and Einstein2008). Earlier research showed a good fitting of allometric functions for body components in numerous animal species (Maeno et al., Reference Maeno, Oishi and Hirooka2013). Their suitability for minerals is confirmed in the present study as R 2 were high (>0.92) and RSEs were acceptable. The low quality of the allometric equations for the amounts of Cu and Mn in the EB are the exceptions and can be attributed to individual analysis of pig’s body fractions often found under the defined limit of quantification.
Mineral amount in new born piglets
The net mineral requirement for gestation includes the amounts of placenta and foetus, but the foetus represents the major part, at least for P (Jondreville and Dourmad, Reference Jondreville and Dourmad2005). Approximately 50% of the mineral amount at birth is transferred from the sow to the foetuses within the last 2 weeks of gestation (Mahan et al., Reference Mahan, Watts and St-Pierre2009). Whereas Na and Zn composition in the new born piglets were comparable with the findings by Mahan et al. (Reference Mahan, Watts and St-Pierre2009), Ca, P, Mg, K, Cu, Fe and Mn values were 27%, 32%, 28%, 39%, 63%, 49% and 61% greater. The case of Fe may be relativized as it may be partly be explained by the Fe injection applied to piglets at birth in the present study. These novel data in amounts of minerals in the new born piglets may be useful for revising the net requirements of the modern gestating sows. However, litter size as well as the average neonate weight must be taken in account together with the rest of sow conceptus.
Dynamics of ash and mineral amount and relative deposition rates
In order to study the impact of protein on the amount of mineral in the EB, the present study included one genotype (Swiss Large White), but two dietary CP levels, whereas previous comparable studies included several genetic lines with different potential for leanness (Schinckel et al., Reference Schinckel, Mahan, Wiseman and Einstein2008; Wiseman et al., Reference Wiseman, Mahan and St-Pierre2009), fed one diet. The effect of dietary CP content on changes in body composition was illustrated by protein deposition relative to EB gain, which was higher in C pigs until 50 kg BW and higher in LP pigs thereafter (Ruiz-Ascacibar et al., Reference Ruiz-Ascacibar, Stoll, Kreuzer and Bee2018). A reduced dietary CP can effectively improve metacarpal bone mineralization (Varley et al., Reference Varley, Flynn, Callan and O’Doherty2011), but the present study only showed a tendency for increased amount and deposition rate of ash in the EB. However, when expressed relative to body protein, the amount of ash, Ca and P were nicely increased with diet LP. This confirms the separate body ash and protein growth when pigs cannot express their full growth potential (Létourneau-Montminy et al. (Reference Létourneau-Montminy, Narcy, Dourmad, Crenshaw and Pomar2015), here expressed with limited dietary CP and amino acids, but without limited dietary minerals. Indeed, the amount of ash relative to body protein from C and LP pigs (allometric regression in Table 3) was comparable to the relationship from literature values presented by Létourneau-Montminy et al. (Reference Létourneau-Montminy, Narcy, Dourmad, Crenshaw and Pomar2015) when dietary Ca and P were not deficient. In addition, the amount of P relative to body protein (allometric regression in Table 3) was 23% higher and the P relative to protein deposition rate was greater until pigs reached 13.2 kg of protein and lower from then on than the quadratic regression presented in National Research Council (NRC) (2012). Thus, a stable amount of P relative to body protein such as proposed by NRC (2012) is only valid under condition that all nutrients are fed at or above animal’s requirement for a sufficient time period. Finally, a separated approach of body mineral and protein accretion may be advantageous to develop feeding strategies aiming for the limited use of mineral phosphates.
There was however no major gender effect on the amounts of ash, Ca and P, expressed per EB or body protein as explained by NRC (2012). Globally, experimental groups had limited effects on the other amounts of minerals in the EB and in their deposition rates. The gender effect increased the amounts of K and Na by respectively 4% and 8% in the EB of EM pigs is consistent with data presented by Fandrejewski and Rymarz (Reference Fandrejewski and Rymarz1986) and Jondreville et al. (Reference Jondreville, Revy, Dourmad, Nys, Hillion, Pontrucher, Gonzales, Soler, Lizardo and Tibau2004). Sodium and K are involved in the osmotic regulation; K is largely an intracellular element, whereas Na is mostly found in the circulatory fluid (Mahan and Shields, Reference Mahan and Shields1998). Therefore, the difference observed between genders could partly be explained by the amount of water in the EB, which was found to be greater in EM pigs. The decrease of the relative water deposition rate with increasing BW in detriment of the increase of other tissues (i.e. fat and muscle tissue) can thus also explain the faster relative K deposition rate when compared with Na, which was previously observed (Hendriks and Moughan, Reference Hendriks and Moughan1993; Jondreville et al., Reference Jondreville, Revy, Dourmad, Nys, Hillion, Pontrucher, Gonzales, Soler, Lizardo and Tibau2004). The reason for the greater Fe amount observed in EM compared with FE and CA remains unclear, but the difference was relatively small (6%). Finally, mineral amounts in the EB were not affected to a sufficient relevant way by gender, suggesting that the net requirement for growth on BW basis and the exported amount of mineral produced by pigs may not need to be differentiated by gender.
The amounts of ash and macro minerals in the mean EB of 87±6.9 kg were in agreement with other multi mineral studies obtained by Jondreville et al. (Reference Jondreville, Revy, Dourmad, Nys, Hillion, Pontrucher, Gonzales, Soler, Lizardo and Tibau2004) and Rymarz et al. (Reference Rymarz, Fandrejewski and Kielanowski1982). However, values were consistently higher than the ones obtained by Hendriks and Moughan (Reference Hendriks and Moughan1993) and Pettey et al. (Reference Pettey, Cromwell, Jang and Lindemann2015). They were also greater when estimated from the respective live weight amounts reported by Wiseman et al. (Reference Wiseman, Mahan and St-Pierre2009) using the EB to live BW ratios from the present study (data not shown). Except for Cu, the mean trace mineral amounts in the EB were in agreement with the values obtained by Jondreville et al. (Reference Jondreville, Revy, Dourmad, Nys, Hillion, Pontrucher, Gonzales, Soler, Lizardo and Tibau2004) and Rymarz et al. (Reference Rymarz, Fandrejewski and Kielanowski1982). Compared to Wiseman et al. (Reference Wiseman, Mahan and St-Pierre2009), Fe and Zn were higher and Cu was lower.
The relative Ca and P deposition rates differed slightly with those by Jondreville et al. (Reference Jondreville, Revy, Dourmad, Nys, Hillion, Pontrucher, Gonzales, Soler, Lizardo and Tibau2004) as their respective b coefficients from the allometric equations were positive. Thus, the present Ca and P amounts in the EBW were 40% greater at 20 kg EBW, difference which continuously decreased until ~100 kg EBW to remain similar from then on. The relative Ca and P mean deposition rates were also 48% greater than those estimated from the linear equations by Wiseman et al. (Reference Wiseman, Mahan and St-Pierre2009) and 23% for Ca and 17% for P greater than the constant values by Pettey et al. (Reference Pettey, Cromwell, Jang and Lindemann2015). The present Mg, K and Na relative deposition rates were comparable to Rymarz et al. (Reference Rymarz, Fandrejewski and Kielanowski1982) and Jondreville et al. (Reference Jondreville, Revy, Dourmad, Nys, Hillion, Pontrucher, Gonzales, Soler, Lizardo and Tibau2004), however higher than values reported by Hendriks and Moughan (Reference Hendriks and Moughan1993) and by Wiseman et al. (Reference Wiseman, Mahan and St-Pierre2009).The Fe deposition rate was slightly higher, but still in good agreement with Jondreville et al. (Reference Jondreville, Revy, Dourmad, Nys, Hillion, Pontrucher, Gonzales, Soler, Lizardo and Tibau2004). They were however twice as high as the ones obtained from the quartic regression by Wiseman et al. (Reference Wiseman, Mahan and St-Pierre2009). As the b coefficient for Zn was negative in Jondreville et al. (Reference Jondreville, Revy, Dourmad, Nys, Hillion, Pontrucher, Gonzales, Soler, Lizardo and Tibau2004), the present Zn amount in the EB was 30% lower at 20 kg EBW difference which progressively decreased to become equal at 77 kg EBW and then increased again to result to a 14% greater amount at 125 kg EBW. The values from Wiseman et al. (Reference Wiseman, Mahan and St-Pierre2009) resulted in similar values during the grower period with the present data and in similar values during the finisher I period with those of Jondreville et al. (Reference Jondreville, Revy, Dourmad, Nys, Hillion, Pontrucher, Gonzales, Soler, Lizardo and Tibau2004). Despite the lower Cu amount in the EBW, its relative deposition rate was equal to Jondreville et al. (Reference Jondreville, Revy, Dourmad, Nys, Hillion, Pontrucher, Gonzales, Soler, Lizardo and Tibau2004) but 82% lower than Wiseman et al. (Reference Wiseman, Mahan and St-Pierre2009). Finally, the amount of Mn in the EB was similar at 20 and 100 kg EBW (8 and 20 mg, respectively) with those published by Wiseman et al. (Reference Wiseman, Mahan and St-Pierre2009) (6 and 22 mg, respectively).
Conclusion
The mineral amount and relative deposition rates generated in the present experiment were obtained by the chemical analysis of the different body fractions of pigs. Therefore, they can be used to update the basis for the factorial system to estimate mineral requirements of growing pigs. They can also be used, together with the intestinal content to define nutrient export values and reference values for nutrient excretion and to calculate mineral input–output balances at farm level. All are useful to potentially improve the sustainable use of minerals, especially P, Cu and Zn in agriculture. Mineral amounts increased with increasing BW, but apart from Zn, all relative mineral deposition rates decreased with increasing EBW, suggesting a relative increasing importance of the soft tissue deposition over bone during growth. Finally, gender and dietary protein did not affect to a sufficient relevant way the body mineral composition and deposition rates in the EB, suggesting that their distinction may not be necessary to assess, on BW basis, the mineral net requirements for growth and the exported amount of minerals by the pig in input–output balances. However, expressed relative to body protein amount, the amounts of ash, Ca and P can be modified by dietary CP and amino acid limitations.
Acknowledgements
The authors acknowledge G. Maïkoff and his staff for the management of the pigs; P. Silacci and his team for the assistance during sampling and S. Dubois and his team for the mineral analysis.
Declaration of interest
The authors declare no conflicts of interest.
Ethics statement
The experimental procedure was approved by the Office for Food Safety and Veterinary Affairs (2012-14-FR 22119 and 2013-24-FR 24064) and all procedures were conducted in accordance with the Ordinance on Animal Protection and the Ordinance on Animal Experimentation.
Software and data repository resources
None.
Supplementary material
To view supplementary material for this article, please visit https://doi.org/10.1017/S1751731118002495


