1 Introduction
Air bubbles in polar glacier ice are formed during the densification process of firn to ice. Air channels in firn become isolated and form air bubbles during the process. This process has been studied by measuring air permeability of firn ice samples (Reference Macno, Narita and AraokaMaeno and others, 1978; Reference Langway, Shoji, Mitani and ClausenLangway and others, 1993) and by measuring total bubble volume in firn-ice samples (Reference Sehwandcr and StaufferSchwander and Stauffer, 1984; Reference Stauffer, Sehwander and OeschgerStauffer and others, 1985; Reference Martinerie, Raynaud, Etheridge, Barnola and MazaudierMartinerie and others, 1992; Reference SchwanderSchwander and others, 1993). Reference Sehwandcr and StaufferSchwander and Stauffer (1984) found that this process occurred rapidly from 64 to 76 m depth in an ice core from Siple Station, Antarctica. The bubble-formation process at Summit in Greenland was examined by Reference Martinerie, Raynaud, Etheridge, Barnola and MazaudierMartinerie and others (1992) and by Reference SchwanderSchwander and others (1993). However, air-bubble formation processes by bubble-volume measurements have not been examined in detail, except for these two ice cores.
We focus on total bubble volumes in firn-ice transition layers using five ice cores from the Greenland and Antarctic ice sheets and discuss the regional characteristics of the bubble-volume profile. The method of volume measurement is briefly described.
2 Methods of measurements
For measurements of density and total bubble volumes, we cut cylindrical samples 35–40 mm in diameter and 40–60 mm in length. Total bubble volume, defined as the total volume of pores that are sealed by the ice matrix, was measured by a method similar to that developed by Reference BaderSchwander and Stauffer (1984). They employed a classical method based on Boyle-Mariotte's law for an ideal gas (pressure × volume = constant at a constant temperature). We modified the method as follows: the ice sample was disconnected from the measuring system when air pressures in the system were measured. This modification enabled us to eliminate the effect of vapor pressure of ice during the measurements of pressure drops (∆P1 and ∆P2 in the following paragraph).
Figure 1 shows a schematic diagram of our measuring system. For the measurements, volume V1 containing a firn ice sample is disconnected from the atmosphere and connected to V2+V3, that was evacuated previously (∆P1; about 30 Torr). Opening valve 1, air in the V1 (atmospheric pressure, Pa is expanded to V2 and V3. After 30 s, valve 1 is closed and the pressure drop ∆P2 in V2 and V3 is measured. Assuming an isothermal process, the impermeable volume of the sample (Vi + Vt) is measured using the following equation:

where Pa is atmospheric pressure; ∆P1 is first pressure drop in V2 by a hand pump; ∆P2 is second pressure drop in V1 + V2 + V3 by an expansion of air; V1 is the inner volume of V1 (169.46cm3); V2 is the inner volume of V2 (82.52 cm3); V3 is the inner volume of tubes in the measuring system (30.58 cm3); Vi is volume of the ice matrix and Vt is total bubble volume in a firn-ice sample. Vi is obtained from measurements of weight and temperature of firn-ice samples using a bubble-free ice density Reference Bader(Bader, 1964). The weights of samples were measured with an absolute accuracy of ±0.01 g and temperature was measured with an accuracy of ± 0.1°C. The pressure drops (∆P1and ∆P2) were measured with an accuracy of ± 0.04 Torr (type PH-22-D, SOKKEN Co. Ltd). Then Vt is calculated from (Equation 1).

Fig.1. Generalized geometry for photoclinometrx Definitions of the angles are given in the text.
Bubble volume (Vb) is defined as the total bubble volume (Vt) per weight of the sample (Vb = Vt/m; m is the weight of the sample). Air-channel volume (Va) is defined as the total air-channel volume per weight of the sample. Air channels refer to pores which connect with surfaces of the samples. As total pore volume per unit mass of the sample is identical with Va + Vb, Va is calculated as follows:
where ρ is the bulk density of the sample and ρi IS the bubble-free ice density at toC Reference Bader(Bader, 1964).
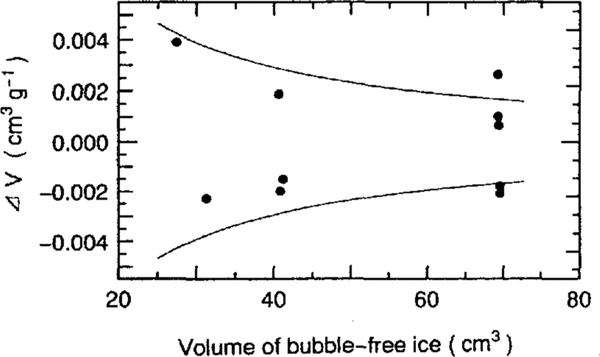
Errors in the volume measurements were investigated using bubble-free single crystals of ice taken from Mendenhall Glacier, Alaska Reference Higashi(Higashi, 1988). It was found that the standard deviation of the volume measurements of the ice samples was 0.11 cm3. Relations between sample volumes and analytical errors per unit mass (∆V) are shown in Figure 2. Standard deviations per unit mass of ice are expressed by two curves. For 30-70 g ice samples, the errors in the measurements were in the range ± 0.004 to ± 0.002 cm3 g-1, i.e. ± 0.004 to ± 0.002 m3 Mg-1.

Fig.2. The accuracy of bubble-volume measurements for bubble-free ice samples with standard-deviation lines.
Optical microscopic observation was conducted on thin-section samples from each ice core to investigate the air-bubble size, shape and configuration.
3 Results
The positions, ice temperatures and annual accumulation rates of five ice-coring sites are summarized in Table 1. Results of bubble volumes (Vb) and air-channel volumes (Va) of these ice cores are shown in Figure 3. It should be noticed that air bubbles are rapidly formed at the following depth intervals: H231 (from about 41–49 m depth); Mizuho (about 44–53m depth); GIS (about 63 74m depth); AC (about 72–80 m depth) and site) (about 54–65 m depth). Air-channel volumes rapidly decrease in these depth intervals. These characteristic features of bubble formation are confirmed by microscopic observations on thin-section samples from each core.
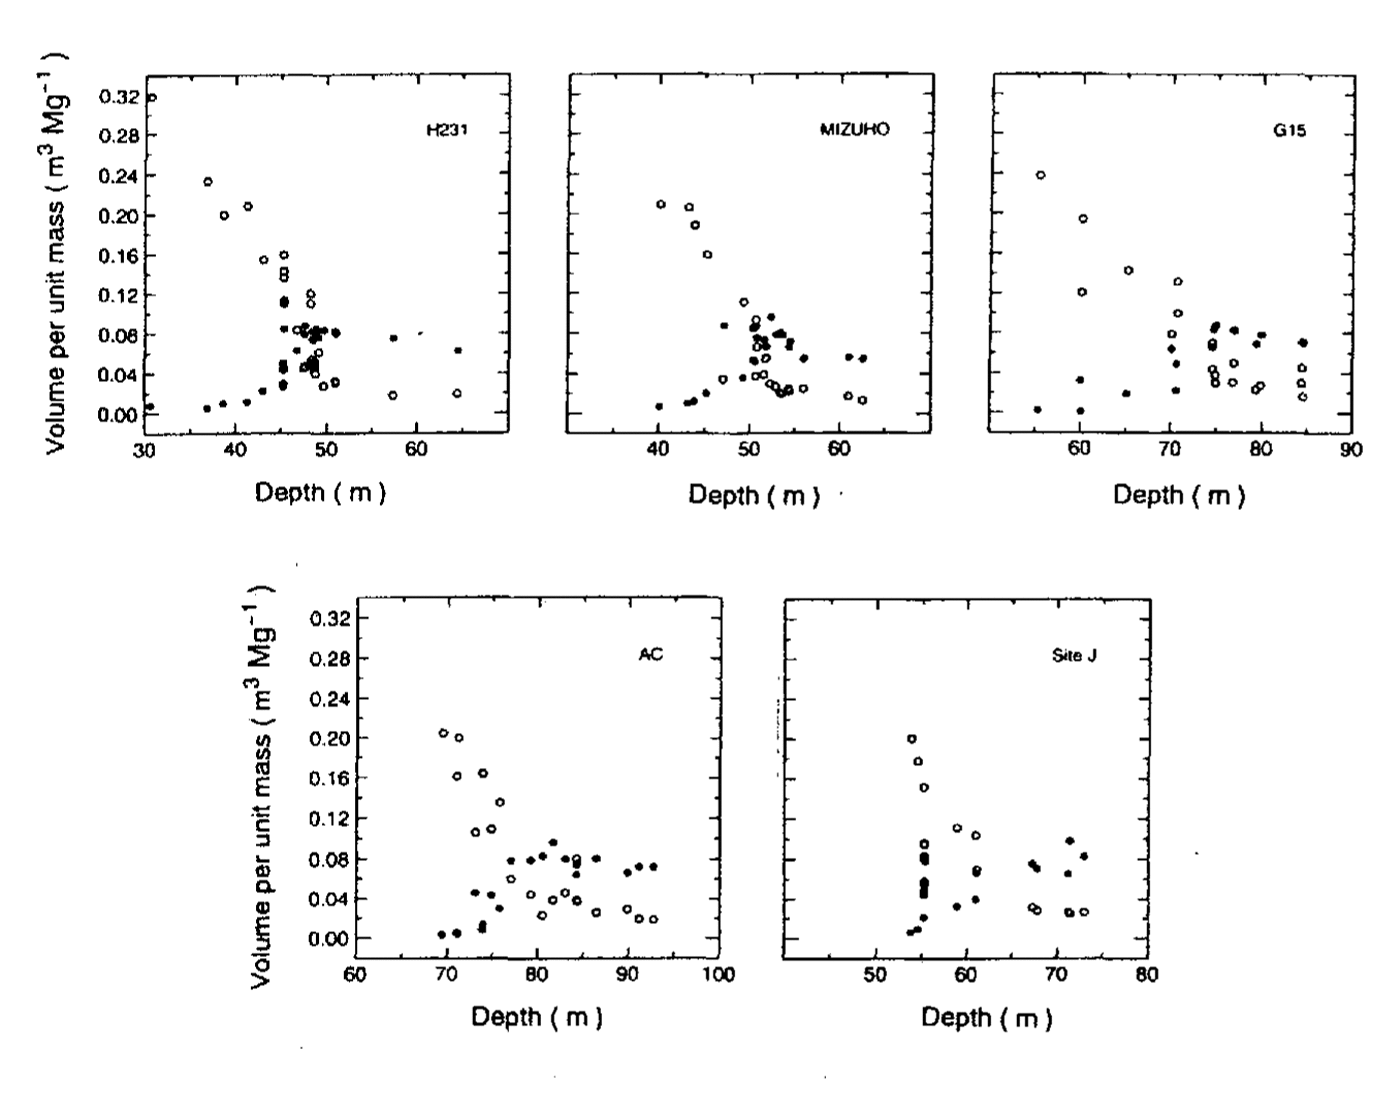
Fig.3. Bubble volume and air-channel volumes versus depth in five ice cores from the Greenland and Antarctic ice sheets.
Table 1 Glaciological data and references for Antarctic and Greenland ice cores. Tc was measured at the following depths in the firn-ice transition layer: H231 (40 m), Mizuho Station (51 m), G15 (68 m), A C (80 m) and site ℱ (60 m)

4 Discussions
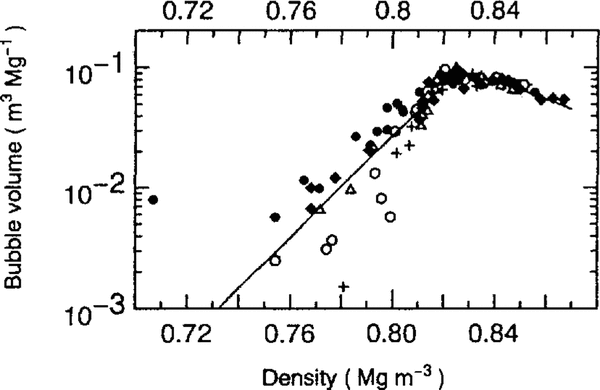
An examination was made to find a relation between bulk density (ρ) and bubble volume (Vb) using the bubble volume data in Figure 3. It was found that there is a linear relation between ρ and In(Vb), as shown in Figure 4, in a density range from 0.75 to 0.825 Mg m-3 . The straight line for the lower density of 0.825 Mg m-3 in Figure 4 is expressed as follows:
Bubble volume (Vb) and density (ρ) are expressed in units of m3 Mg-l and Mg m-3,respectively. The correlation coefficient and the degrees of freedom of this relation are 0.91 and 68, respectively.

Fig.4. Relation between logarithm of bubble volume (In(Vb)) and bulk density (ρ) for jive ice cores with calculated fit lines.
On the other hand, bubble volumes of ice samples at the higher density of 0.825 Mg m-3 decrease with bulk density as in the following equation, because the increase in ice density is caused by a decrease of total bubble volume:

where ρc is a pore close-off density, at which firn turns into ice by the definition of ice, and Vc is bubble volume per unit mass of ice at pore close-off.
We can determine the coefficient in (Equation 4) using bubble-volume data, in which densities are over 0.825 Mg m-3 and also the average ice temperatures at five sites (-31.19°C) are as follows:
where the correlation coefficient and the degrees of freedom are 0.62 and 33, respectively.
Bubble volumes in five ice cores with the calculated curves of (Equations 3) and (5) are shown in Figure 5. They show a sharp increase from bulk density of about 0.78 Mgm-3 and have a peak value in bulk density between 0.820 and 0.830 Mg m-3. Bubble-volume profiles, expressed by the two curves, have the maximum value (0.091 m3 Mg-1) at a bulk density of 0.825 Mg m-3 Figure 5

Fig.5. Relation between air-bubble volume (Vb) and bulk density (ρ) for five ice cores with calculated-fit curves.
Results of microscopic observation show that the number and mean diameter of the air bubbles depend on the mean annual temperatures at the coring site: the number of air bubbles per unit mass decreases with temperature and the mean diameter of air bubbles increases with temperature. However, these two factors contribute to an increase in the bubble volume in an opposite way and may cause the data scatter shown in Figure 5
Table 2 Values of ρcb, porosity Scb, depthfrom surface hcb, overburden pressure Pcb and corresponding bubble volume Vcb for five ice cores

In Figure 5, it seems that Vb of H231 and Mizuho are slightly higher than those of other cores in a density range 0.76–0.81 Mg m-3. In order to examine these regional differences of bubble volumes with bulk density, the above methods of two-curve fittings were again employed for each set of coring-site data.
Vb with calculated two-fit curves for each site are shown in Figure 6. The peak bubble volume probably corresponds to completion of the bubble-formation zone in the firn-ice transition layer. This bubble volume is denoted as Vcb. Firn density at Vcb (ρcb), porosity (![]() ), overburden pressure (ρcb) and Vcb are summarized in Table 2. It was found that ρcb was in a density range 0.819–0.832 Mg m-3. The standard deviation of ρcb is 0.005 Mg m-3. This deviation is almost the same as errors in density measurements
(= 0.004 Mg m-3)
), overburden pressure (ρcb) and Vcb are summarized in Table 2. It was found that ρcb was in a density range 0.819–0.832 Mg m-3. The standard deviation of ρcb is 0.005 Mg m-3. This deviation is almost the same as errors in density measurements
(= 0.004 Mg m-3)

Fig.6. Relation between bubble volume(Vb) and bulk density (ρ) for each ice core with calculated fit curves
For examining rapid bubble formation in the fim-ice transition zone, a 10% value of peak bubble volume is selected here as a reference parameter. This bubble volume seems to correspond to the initiation of the rapid bubble-formation zone in the firn-ice transition layer. This bubble volume is denoted as Vib. Firn density at Vib (ρib), porosity (sib), overburden pressure (ρib) and Vib are summarized in Table 3. It was found that ρib ranges from 0.763 to 0.797 Mg m-3. The standard deviation of ρib is 0.013 Mgm-3. The deviation is about three times larger than the error in the density measurements.
The ρib and ρcb with ice temperatures are shown in Figure 7. It seems that ρib of four Antarctic ice cores has a correlation with ice temperature (correlation coefficient: r = O.8l). The value of ρib at site J (0.780Mg m3) was slightly larger than the expected value from four Antarctic ice cores. ρcb does not seem to be correlated with ice temperature or accumulation rate of the coring site.
Table 3 Values of ρib, porosity sib depth from surface hib, overburden pressure Pib and Vib (10% of Vcb). for five ice cores.


Fig.7. Relation between ice temperature and ρib (triangles) and also ice temperature and ρcb (squares). ρcb is identical with peak bubble-volume density.
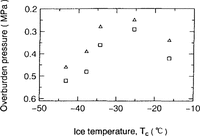
Overburden pressures for ρib and ρcb (denoted as Pib and ρcb, respectively) in ice sheets and ice temperatures are examined in Figure 8. It was found that Pib ranges from 0.25 to 0.46 MPa and Pcb ranges from 0.29 to 0.52 MPa. A correlated relation between Pib and ice temperature for four Antarctic ice cores is again observed (r = 0.93). A correlated relation between Pcb and ice temperature (r = 0.92) is also observed.
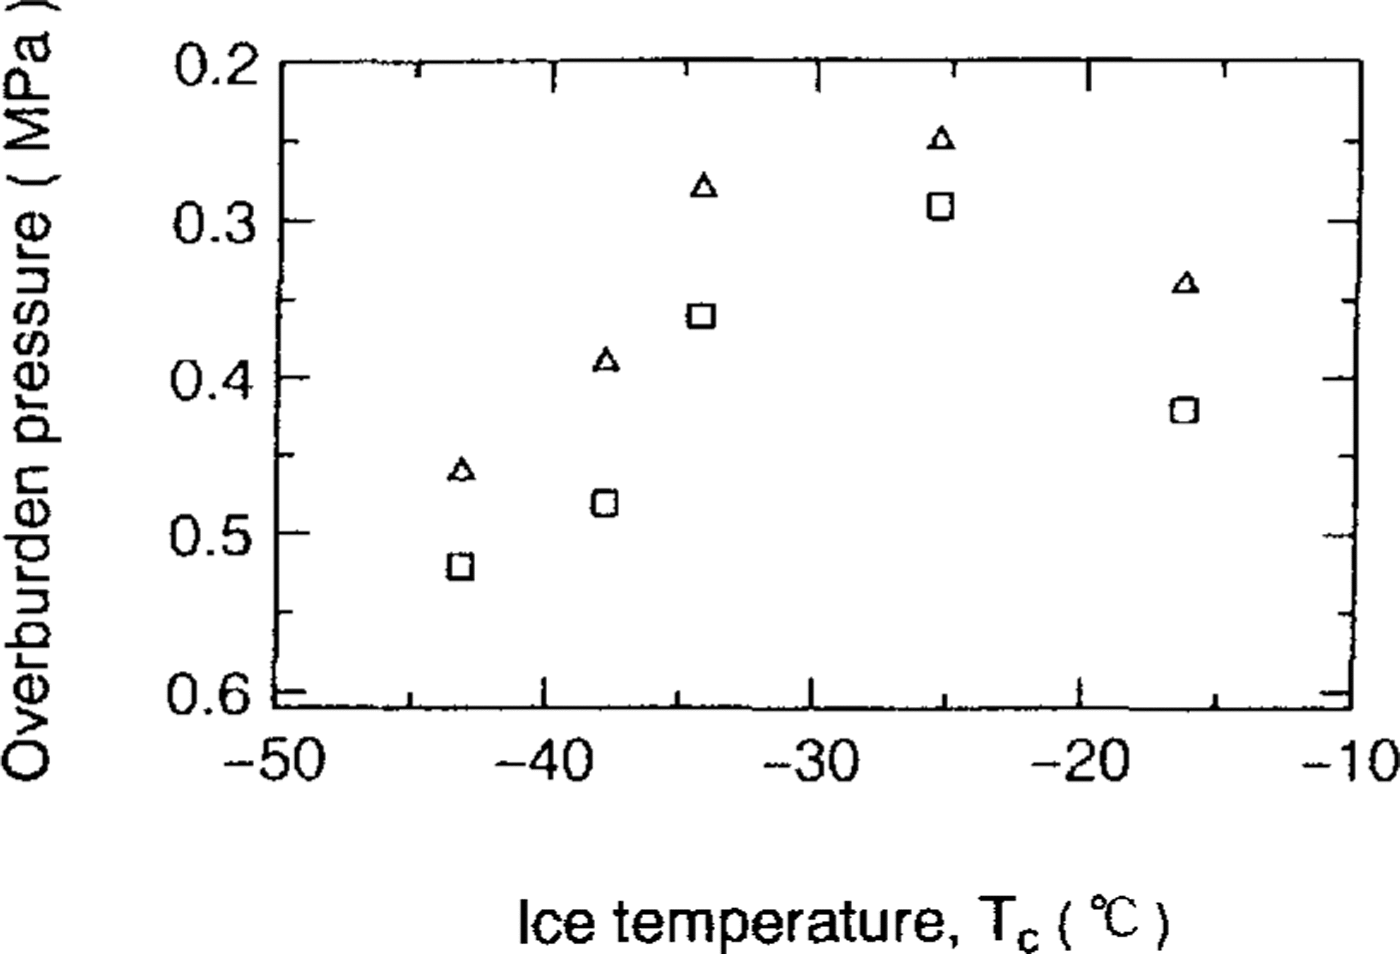
Fig.8. Relation between ice temperature and Pib (triangles) and also ice temperature and Pcb (squares). Pib is identical with the overburden pressure, from which bubble volumes start to increase rapidly. Pcb is identical with the overburden pressure at which bubble volume shows the maximum value by two-fit curves
Reference Kameda, Shoji, Kawada, Watanabe and ClausenKameda and others (1994) have demonstrated that firn-density profiles in ice sheets are determined primarily by overburden pressure and firn temperature contributes to a lesser degree. Thus, density ranges from Pib to Pcb in ice sheets are primarily determined by these two parameters.
5 Conclusion
We have measured bubble volumes (Vb) in the firn-iee transition layer using five ice cores from Greenland and Antarctica. It was found that Vb (m3 Mg-1) in five ice cores was expressed by a function of density as in the following equations:

There is a regional difference for the profile of Vb for each site; Vb in ice cores from warmer sites is slightly higher than those for ice cores from colder sitcs in a density range 0.76–0.81 (Mgm-3). Peak bubble volumes at which the above two lines are crossed (Vcb) are selected as a reference parameter. The 10% value of Vcb (Vib) is also selected as another reference parameter. It was found that ρib (corresponding density of Vib) ranges from 0.763 to 0.791 Mgm-3 and ρcb (corresponding density of Vcb) ranges from 0.819 to 0.832 Mg m-3. ρib seems to be correlated with ice temperature in ice sheets (r = 0.81). The corresponding porosity of ρcb does not seem to be correlated with ice temperature or accumulation rate. Pcb (overburden pressure for ρcb) ranges from 0.29 to 0.52 MPa and Pib (overburden pressure for ρib) ranges from 0.25 to 0.46 MPa. A correlation between Pib and ice temperaturc (r = 0.93) and also between Pcb and ice temperature (r = 0.92) is observed.
For further studies on the firn-ice transition, the ice deformation behavior should be considered as explaining the bubble formation and compression processes separately. In particular, the bubble-compression process in the firn-ice transition layer must be clarified quantitatively to understand the regional difference in the total air content in glacier ice and also for understanding the densification behavior of glacier ice after pore close-off.
Acknowledgements
We should like to thank Professor S. Mae and Dr M. Nakawo for useful suggestions prior to this study. We also acknowledge Professor E. Akitaya for support during the development of a measuring system for air bubble volume in ILTS, Hokkaido University. Fruitful discussions with Professors H. Shoji and S. Takahashi are acknowledged. Ice cores from Antarctica were recovered by the 21st, 24th, 25th and 26th Japanese Antarctic Research Expeditions in the Glaciological Research Program in east Dronning Maud Land. The recovery of the site J ICE core was supported by a grant-in-aid from the International Scientific Research Program of the Japanese Ministry of Education, Science and Culture.


