In 1996, over 26 000 people in England with mental disorders were deprived of their liberty and detained in hospital without their consent under the Mental Health Act 1983 (Reference Hotopf, Wall and BuchananHotopf et al, 2000). Despite the rapidly increasing use of existing legislation, there has been little research into the operation of the Act and the various measures it incorporates, to ensure against unjustified detention in hospital (Reference Wall, Buchanan and FahyWall et al, 1999). Such research is particularly pressing given the current review of mental health legislation (Department of Health, 1999).
Among the current safeguards of patients' civil liberties is the right of the nearest relative to discharge their next of kin from either a 1-month assessment order (section 2) or a treatment order (section 3). The Act stipulates that such moves can be opposed by a psychiatrist if they feel there is ‘likely harm’ to either the patient or the public if the patient were to be discharged. The nearest relative then has a final right of appeal to the Mental Health Review Tribunal (MHRT) — an independent body consisting of a psychiatrist, lawyer and lay member.
We hypothesised that patients discharged by their nearest relative would have a poor clinical outcome as the discharges occurred against medical advice. We also hypothesised that patients whose nearest relative application was ‘blocked’ because of possible danger to self or others would have a similar outcome on all clinical measures to controls, as both groups are discharged by the psychiatrist.
Method
Subjects
All patients studied were under the care of a large south London NHS trust. Because one of the central outcome measures was time to first readmission, the study was powered to detect a 50% increase in the rate of readmission (with 80% power and 95% confidence intervals) over the follow-up period of 2.5 years, among patients discharged by their nearest relatives. This was based on a small pilot study of patients in one area and clinical opinion, which suggested an increase in readmission rate of nearly 50% over 2 years. To obtain the required sample of 51 subjects, all patients placed under section 2 or 3 from March 1993 to September 1998 were included and followed up until 1 September 1999.
Over the same time period, all cases where the nearest relative's request was barred were also identified. For both of these groups, the next consecutive patient placed on the same section was identified and used as a control. They were thus matched for the section of the Mental Health Act and its time of onset. Demographic and clinical characteristics of each patient were extracted from the case notes, discussion with keyworkers or the general practitioner (GP).
Several measures were studied as markers of clinical outcome. Foremost was the time from discharge, by either the nearest relative or psychiatrist, to first readmission. The length of the index admission, total number of subsequent readmissions and time spent in hospital were also studied.
Analysis
Dichotomous data were analysed using McNemar's test for paired data to see whether any feature was significantly associated with the group of interest. Non-dichotomous categorical data were analysed using the chi-squared test. Normally distributed continuous variables were compared with the Student's t-test, and non-normally distributed continuous data were analysed using the Wilcoxon signed ranks test.
The times to first readmission for each group and its control were compared using Cox's proportional hazards model. Hazard ratios for readmission with 95% confidence intervals were calculated, representing the relative risk of being readmitted if the nearest relative applied for discharge compared with controls. Thus, a hazard ratio greater than one implies an increased risk of readmission for that group, compared with controls.
Finally, three of the more frequent outcomes were subjected to a conditional logistic regression to control for the potential confounding by demographic or clinical variables listed in Tables 1 and 2. Crude odds ratios with 95% confidence intervals were calculated and then adjusted firstly for demographic and then demographic and clinical variables.
Table 1. Demographic characteristics of the patients whose nearest relative applied for discharge from section

| Nearest-relative discharge (n=51) | Controls (n=51) | Statistical significance | RMO blocks nearest-relative discharge (n=33) | Controls (n=33) | Statistical significance | |
|---|---|---|---|---|---|---|
| Gender (%) | ||||||
| Male | 26 (51) | 25 (49) | NS (χ2=0.001, d.f.=1, P=0.97) | 17 (56.7) | 13 (39.3) | NS (χ2=0.98, d.f.=1, P=0.32) |
| Female | 25 (49) | 26 (51) | 16 (43.3) | 20 (60.7) | ||
| Age | ||||||
| Mean (years) (95% CI) | 36.9 (33.5-40.3) | 41.1 (38.1-44.2) | NS (t=1.84, d.f.=100, P>0.05) | 35.0 (31.2-38.9) | 37.8 (33.9-41.6) | NS (t=0.97, d.f.=64, P>0.05) |
| Civil status (%) | ||||||
| Partner | 15 (29.4) | 20 (39.2) | NS (χ2=0.76, d.f.=1, P=0.38) | 11 (33.3) | 11 (33.3) | NS |
| Single | 36 (70.6) | 31 (60.8) | 22 (66.7) | 22 (66.7) | ||
| Living with nearest relative (%) | 15 (29.4) | 22 (43.1) | NS (χ2=2.08, d.f.=1, P=0.15) | 13 (39.4) | 14 (42.4) | NS (χ2=0.06, d.f.=1, P=0.81) |
| Ethnicity (%) | ||||||
| White | 28 (54.9) | 30 (58.8) | NS (χ2=3.95, d.f.=3, P=0.26) | 12 (36.4) | 17 (51.5) | NS (χ2=3.59, d.f.=3, P=0.31) |
| Black African | 12 (23.6) | 8 (15.7) | 5 (15.2) | 7 (21.2) | ||
| Black Caribbean | 7 (13.7) | 12 (23.5) | 14 (42.3) | 7 (21.2) | ||
| Other | 4 (7.8) | 1 (2.0) | 2 (6.1) | 2 (6.1) |
Table 2. Clinical characteristics of the groups

| Nearest-relative discharge (n=51) | Controls (n=51) | Statistical significance | RMO blocks nearest-relative discharge (n=33) | Controls (n=33) | Statistical significance | |
|---|---|---|---|---|---|---|
| Diagnosis (%) | ||||||
| Schizophrenia | 30 (58.8) | 30 (58.8) | NS (χ2=0.64, d.f.=3, P=0.89) | 25 (75.8) | 25 (75.8) | NS (χ2=1.33, d.f.=3, P=0.72) |
| Bipolar affective disorder | 15 (29.4) | 13 (25.5) | 6 (18.2) | 6 (18.2) | ||
| Depression | 3 (5.9) | 3 (5.9) | 0 | 1 (3.0) | ||
| Other | 3 (5.9) | 5 (9.8) | 2 (6.0) | 1 (3.0) | ||
| Number of previous admissions | ||||||
| Median (IQR) | 1 (0-3) | 3 (1-5) | Significant (Wilcoxon signed ranks test Z=-1.96, P=0.05) | 3 (0-5) | 2 (0-5.5) | NS (Wilcoxon signed ranks test Z=-0.55, P=0.58) |
| History of violence to others (%) | ||||||
| Present | 20 (39.2) | 18 (35.2) | NS (χ2=0.05, d.f.=1, P=0.82) | 23 (69.7) | 12 (36.4) | Significant |
| Absent | 31 (60.8) | 33 (64.8) | 10 (30.3) | 21 (63.6) | (χ2=5.88, d.f.=1, P=0.007) | |
| History of DSH (%) | ||||||
| Present | 12 (23.5) | 17 (33.3) | NS (χ2=0.64, d.f.=1, P=0.42) | 7 (21.2) | 3 (9.1) | NS (χ2=1.13, d.f.=1, P=0.29) |
| Absent | 37 (72.5) | 34 (66.7) | 26 (78.8) | 30 (90.9) |
Results
Demographic and clinical
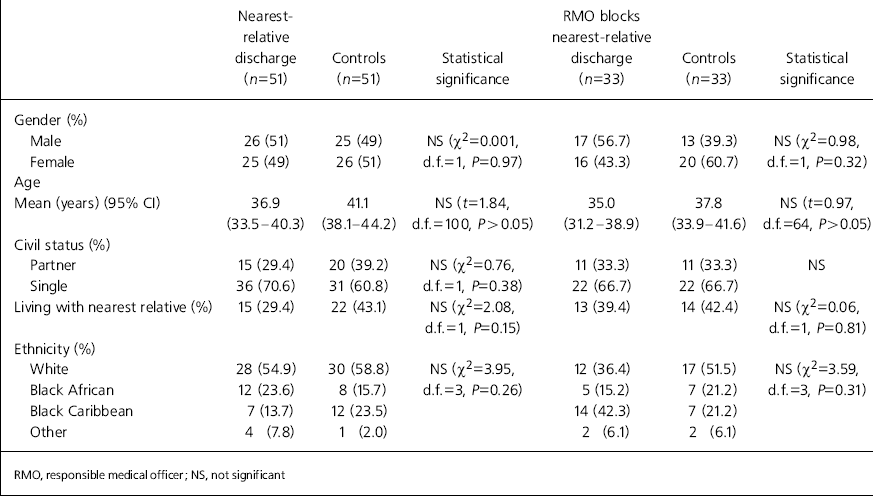
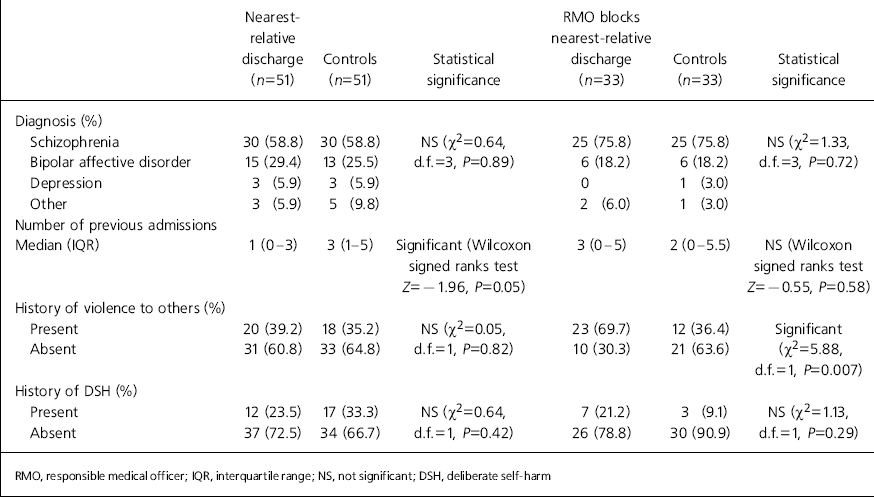
None of the demographic variables studied was significantly associated with a successful or unsuccessful nearest-relative application for discharge (Table 1). Although there was a high proportion of Black Caribbeans among patients whose nearest-relative application was blocked, this did not reach statistical significance. The clinical characteristics of the groups were very similar — most had a diagnosis of schizophrenia and previous hospital admissions, and a substantial minority had a history of violence to others or self (Table 2). Two positive findings emerged. Patients successfully discharged by their nearest relatives had significantly fewer previous admissions. Also, patients whose nearest-relative application was barred had a history of significantly more recorded episodes of physical violence to others.
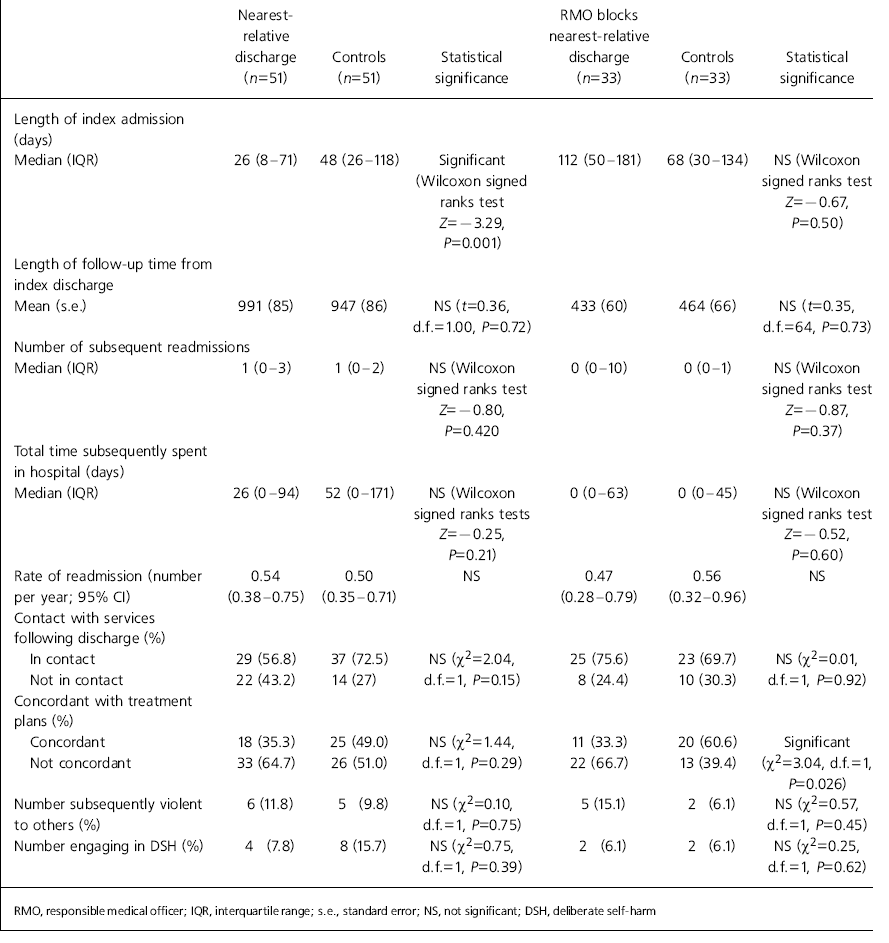
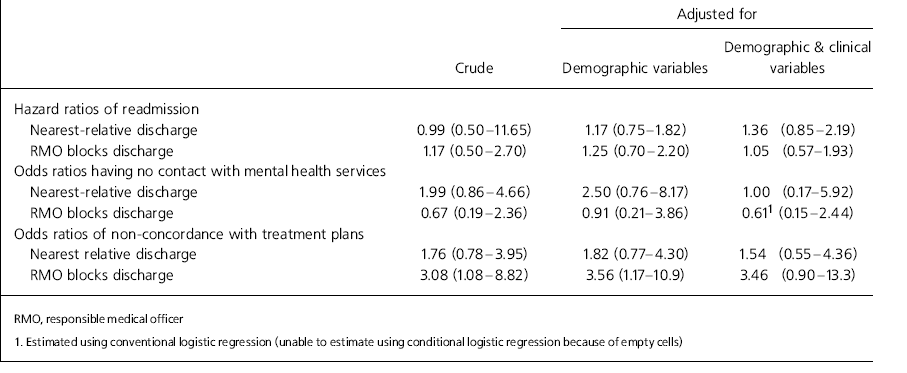
There was no evidence for a poorer clinical outcome among patients who were successfully discharged by their nearest relative. They did not have an increased number of subsequent readmissions and did not spend a significantly different amount of time in hospital during any subsequent readmissions (Table 3). These patients were not readmitted more quickly following nearest-relative discharge, as the hazard ratios for readmission were not raised (Table 4). There were no significant differences in the contacts established with mental health services on discharge, nor in concordance with treatment plans (Table 3). These last three findings were sustained, even after controlling for potential confounding demographic and clinical variables (Table 4).
Table 3. Outcomes of patients whose nearest relative applied for discharge

| Nearest-relative discharge (n=51) | Controls (n=51) | Statistical significance | RMO blocks nearest-relative discharge (n=33) | Controls (n=33) | Statistical significance | |
|---|---|---|---|---|---|---|
| Length of index admission (days) | ||||||
| Median (IQR) | 26 (8-71) | 48 (26-118) | Significant (Wilcoxon signed ranks test Z=-3.29, P=0.001) | 112 (50-181) | 68 (30-134) | NS (Wilcoxon signed ranks test Z=-0.67, P=0.50) |
| Length of follow-up time from index discharge | ||||||
| Mean (s.e.) | 991 (85) | 947 (86) | NS (t=0.36, d.f.=1.00, P=0.72) | 433 (60) | 464 (66) | NS (t=0.35, d.f.=64, P=0.73) |
| Number of subsequent readmissions | ||||||
| Median (IQR) | 1 (0-3) | 1 (0-2) | NS (Wilcoxon signed ranks test Z=-0.80, P=0.420 | 0 (0-10) | 0 (0-1) | NS (Wilcoxon signed ranks test Z=-0.87, P=0.37) |
| Total time subsequently spent in hospital (days) | ||||||
| Median (IQR) | 26 (0-94) | 52 (0-171) | NS (Wilcoxon signed ranks tests Z=-0.25, P=0.21) | 0 (0-63) | 0 (0-45) | NS (Wilcoxon signed ranks test Z=-0.52, P=0.60) |
| Rate of readmission (number per year; 95% CI) | 0.54 (0.38-0.75) | 0.50 (0.35-0.71) | NS | 0.47 (0.28-0.79) | 0.56 (0.32-0.96) | NS |
| Contact with services following discharge (%) | ||||||
| In contact | 29 (56.8) | 37 (72.5) | NS (χ2=2.04, d.f.=1, P=0.15) | 25 (75.6) | 23 (69.7) | NS (χ2=0.01, d.f.=1, P=0.92) |
| Not in contact | 22 (43.2) | 14 (27) | 8 (24.4) | 10 (30.3) | ||
| Concordant with treatment plans (%) | ||||||
| Concordant | 18 (35.3) | 25 (49.0) | NS (χ2=1.44, d.f.=1, P=0.29) | 11 (33.3) | 20 (60.6) | Significant |
| Not concordant | 33 (64.7) | 26 (51.0) | 22 (66.7) | 13 (39.4) | (χ2=3.04, d.f.=1, P=0.026) | |
| Number subsequently violent to others (%) | 6 (11.8) | 5 (9.8) | NS (χ2=0.10, d.f.=1, P=0.75) | 5 (15.1) | 2 (6.1) | NS (χ2=0.57, d.f.=1, P=0.45) |
| Number engaging in DSH (%) | 4 (7.8) | 8 (15.7) | NS (χ2=0.75, d.f.=1, P=0.39) | 2 (6.1) | 2 (6.1) | NS (χ2=0.25, d.f.=1, P=0.62) |
Table 4. Outcomes of patients whose nearest relative applies for discharge — controlling for demographic and clinical variables

| Adjusted for | |||
|---|---|---|---|
| Crude | Demographic variables | Demographic & clinical variables | |
| Hazard ratios of readmission | |||
| Nearest-relative discharge | 0.99 (0.50-11.65) | 1.17 (0.75-1.82) | 1.36 (0.85-2.19) |
| RMO blocks discharge | 1.17 (0.50-2.70) | 1.25 (0.70-2.20) | 1.05 (0.57-1.93) |
| Odds ratios having no contact with mental health services | |||
| Nearest-relative discharge | 1.99 (0.86-4.66) | 2.50 (0.76-8.17) | 1.00 (0.17-5.92) |
| RMO blocks discharge | 0.67 (0.19-2.36) | 0.91 (0.21-3.86) | 0.611 (0.15-2.44) |
| Odds ratios of non-concordance with treatment plans | |||
| Nearest relative discharge | 1.76 (0.78-3.95) | 1.82 (0.77-4.30) | 1.54 (0.55-4.36) |
| RMO blocks discharge | 3.08 (1.08-8.82) | 3.56 (1.17-10.9) | 3.46 (0.90-13.3) |
In line with predictions, there was no evidence for a clinically poor outcome on measures relating to hospitalisation for patients whose nearest-relative application was blocked by the psychiatrist (Tables 3 and 4). These patients appeared to be less concordant with treatment plans, but this effect did not hold when clinical and demographic characteristics were considered.
There were no significant differences between the groups in the occurrence of violence to others or deliberate self-harm following discharge, by whatever means.
A re-analysis of the data, separating those from patients on section 2 and section 3, did not reveal any significant differences between the groups in any of the outcome measures.
Discussion
Key findings of the study
In the authors' experience, many psychiatrists have expressed the fear that discharge by the nearest relative leads to a premature discharge which can have a detrimental effect on the patient and potentially disastrous consequences for the public. Reservations about the power of the nearest relative, which is second only to that of the psychiatrist and exceeds that of the approved social worker, have also been raised by the Mental Health Act Commission (Department of Health, 1998). However, this study failed to demonstrate any significant difference in the clinical outcome of patients discharged by their nearest relative and those discharged by the psychiatrist. It was against expectations that a key management decision made by a lay person did not lead to a worse clinical course. This held across a wide range of outcome indices, including time to the first readmission, total number of readmissions and contact with services. This finding echoes the lack of an adverse effect on clinical outcome following discharge by the mental health review tribunal in both the UK and Canada (Reference Wilkinson and SharpeWilkinson et al, 1993; Reference Adams, Pitre and CieszkoswkiAdams et al, 1997; Reference MyersMyers, 1997).
Perhaps reassuringly, there was also no clear evidence of a detrimental outcome among patients whose nearest-relative applications for discharge were ‘blocked.’ Although there was a trend for this group to be non-concordant with treatment plans, this finding did not hold when potential confounding variables were considered.
Limitations of the study
Several factors could explain the unexpected absence of an association between successful discharge by the nearest relative and poor clinical outcome. First, read-mission to hospital may not be a reliable index of mental health, as different thresholds for readmission may operate for the various groups. It is possible that psychiatrists may be more reluctant to readmit patients who were previously discharged by their nearest relative, leading to longer periods in the community, despite deteriorating mental health. Second, patients discharged by their nearest relative may have derived a benefit from their, albeit foreshortened, admissions to hospital which endures after their discharge into the community. Third, as there were no differences in contact with mental health services and concordance with treatment plans between patients discharged by their nearest relative and controls, parity in the community-based treatment each group received could account for their similar rates of readmission. Finally, a significant difference in outcome could have been missed because of the limited statistical power of the study.
The study was limited by the data available in case notes and thus a systematic investigation of key factors, such as the reasons behind a nearest-relative application or its barring by the responsible medical officer, was not possible.
Issues for future mental health legislation
Throughout the 20th century, there has been a trend in mental health legislation to bolster the legal safeguards of patients' rights, and the ability of the nearest relative to discharge their next of kin was itself a novel feature of the 1983 Act. The tide appears to be turning. Recent legislation on supervised discharge orders has reduced the role of the nearest relative to that of a ‘consultee whose views must be taken into account but with no power to prevent or discharge the order’ (Department of Health, 1998). Future plans to remove this safeguard and replace it with a ‘nominated person’ with no powers of discharge should be supported by research to demonstrate its detrimental effects. This study does not support fears that a discharge by the nearest relative places patients in ‘relative’ danger.
Acknowledgements
We thank all the administrators of the Mental Health Act in the trust and the secretarial staff in the Department of Psychological Medicine at King's College Hospital for help with finding notes.


eLetters
No eLetters have been published for this article.