INTRODUCTION
There is emerging interest in the epidemiology of cytomegalovirus (CMV) and the burden of disease attributed to it, particularly congenitally acquired CMV infection, reflected by the body of publications recently arising on this topic [Reference Kenneson and Cannon1–Reference Dollard, Grosse and Ross5]. CMV is a member of the herpes virus family and is able to establish latent infection in the host following primary infection, from which it can periodically reactivate. It is transmitted via close personal contact through infected body fluids (usually saliva or urine) [Reference Kenneson and Cannon1, Reference Ross and Boppana6] and can also be transmitted from mother to fetus at any time during pregnancy [Reference Dollard, Grosse and Ross5].
The public health impact of CMV results mainly from its often overlooked role as a leading cause of congenital infection, and also as an opportunistic pathogen complicating the care of immunocompromised patients [Reference Kenneson and Cannon1, Reference Colugnati2, Reference Ross and Boppana6]. Whilst CMV is recognized as perhaps the most common intrauterine infection in humans [Reference Ross and Boppana6], both raising the risk of infant mortality and causing permanent physical sequelae such as sensorineural hearing loss, visual impairment and mental retardation [Reference Dollard, Grosse and Ross5, Reference Ross and Boppana6], the true burden of congenital infection and its consequences remain unclear since maternal CMV infection is often asymptomatic and there is a lack of data on important outcomes and follow-up of infected children [Reference Kenneson and Cannon1, Reference Cannon and Davis3]. Estimates of the burden of infection with CMV at the population level, particularly in pregnant women, are therefore important for assessing the extent of CMV infection as a public health issue.
Within the United Kingdom large antibody prevalence studies have been carried out but are restricted to samples from antenatal women [Reference Tookey, Ades and Peckham7, Reference Griffiths, McLean and Emery8], and there are no estimates of CMV antibody prevalence and burden of infection across the complete age range representative of the contemporary general population. A large population-based antibody prevalence study in the United States for those aged ⩾6 years using sera collected between 1988 and 1994 has recently been published [Reference Staras4] and was subsequently used to estimate incidence in the general population aged 12–49 years [Reference Colugnati2]. This study estimated the force of infection to be 1·6% in this age group and suggested that ~27 000 new CMV infections occur annually in seronegative pregnant females, indicating a public health problem of some magnitude in the United States.
In the present study we describe the seroepidemiology of CMV in England and Wales using sera approximating the general population and representing the complete age range collected in 1991 and a decade later in 2002 [Reference Kelly9, Reference Osborne10]. This enabled an estimate of the burden of CMV infection to be made, and using samples collected at two time points 11 years apart enabled the effect of time trends to be addressed when calculating an incidence.
MATERIALS AND METHODS
Samples
A total of 5237 serum samples were used in this study with 2477 collected in 1991 (43% from males and 57% from females) and 2760 collected in 2002 (44% from males and 56% from females), the complete age range (1 to ⩾80 years) was represented by samples used from each year of collection. These sera were randomly selected from a convenience collection considered to approximate the general population of England and Wales consisting of anonymized residues of specimens submitted for microbiological or biochemical testing to laboratories that were then part of the Public Health Laboratory Service (PHLS) and contributing to the PHLS Serological Surveillance Programme (now the HPA Seroepidemiology Programme) [Reference Kelly9, Reference Osborne10]. A total of 12 laboratories provided the sera used in this study.
Laboratory methods
All samples were tested for evidence of CMV-specific IgG by ELISA (Behring Enzygnost, Dade Behring, Milton Keynes, UK) at Lancashire Teaching Hospitals NHS Trust. Results were expressed quantitatively according to the manufacturer's instructions.
Data
Individual quantitative data from each year of sample collection were aggregated into 35 reactivity categories (equal width bands based on the log10 of the quantitative result) and stratified by 12 age groups (1–4, 5–9, 10–14, 15–19, 20–24, 25–29, 30–34, 35–39, 40–44, 45–54, 55–64 and ⩾65 years; number of samples in each age group ranging from 142 to 337) and 11 common birth cohorts (born 1920–1929, 1930–1939, 1940–1949, 1950–1954, 1955–1959, 1960–1964, 1965–1969, 1970–1974, 1975–1979, 1980–1984 and 1985–1989; number of samples in each birth cohort ranging from 72 to 340), enabling frequency distributions to be viewed.
Mixture models
Serological data were modelled as previously described [Reference Vyse11, Reference Vyse12], fitting two components to the observed distributions of quantitative results in each age group or birth cohort. For a given component (reactivity level) the distribution of results in the assay is assumed to follow a Normal distribution. Age and birth cohort-related changes in reactivity are reflected in the model by changes in the proportions attributed to each component distribution. A single model was fitted simultaneously to data from each year of sample collection. This was the primary method used to estimate CMV antibody prevalence.
Fixed cut-off
Mixture models enable the proportion of a population with (and without) evidence of specific antibody to be estimated but do not classify results individually according to antibody status, which may be required for statistical modelling with other information available at an individual level. CMV-specific IgG status for individual samples was therefore assigned using a fixed cut-off that yielded an equal number of false-positive and false-negative results, estimated using a least-squares technique from the degree of overlap between the two component distributions used by the mixture model fitted to the study data to describe those susceptible and those with evidence of previous CMV infection, assuming an overall prevalence of 45% in the population.
Estimating incidence
A model was used to estimate the average proportion of those aged 2–71 years in 1991 susceptible to CMV who acquired this infection over the 11 years between 1991 and 2002. This modelled the prevalence in each birth cohort according to the equation:
where λ91-02=the proportion of those susceptible to CMV aged 2–71 years in 1991 who acquire this infection over the 11 years between 1991–2002; P02c=model prevalence in 2002 in birth cohort ‘c’; P91c=model prevalence in 1991 in birth cohort ‘c’.
A binomial maximum-likelihood method was used to fit the model to the observed antibody prevalence data made using the mixture model for each time point, obtaining maximum log-likelihood estimates for the parameters for each time period of the 20th century represented. The model assumed no waning of antibody over time and was constrained to return values for λ91-02 that were ⩾0, and was not able to consider the potential of CMV to recrudesce.
The complexity of the model was varied by systematically increasing the number of parameters for λ91-02 affecting different age groups/birth cohorts to explore the possibility that the risk of CMV infection varied for different age groups/birth cohorts over the time period under investigation. A χ2 distribution test was used to compare the deviance of each more complex nested model to that of its immediate simpler predecessor, enabling the simplest model that best described the data to be determined [Reference Vyse12]. Likelihood-based 95% confidence intervals for estimates of each value for λ91-02 included in the final model were obtained by finding the maximum and minimum values for which the deviance was within 3·84 of the minimum [Reference Vyse12].
Using mid-1991 population estimates for England and Wales for those aged 2–71 years (www.statistics.gov.uk) and age-specific susceptibility estimates in 1991 made using the mixture model, the average number of CMV infections occurring in those born 1920–1989 susceptible to this infection over the 11 years between 1991 and 2002 were estimated. Thus:
The average annual number of CMV infections occurring during pregnancy in women of childbearing age (15–44 years) was also estimated [Reference Vyse13, Reference Gay14]. This used the numbers of age-specific live births in England and Wales in 2002 (www.statistics.gov.uk), the age-specific proportion susceptible to CMV in 2002 estimated using the mixture model, assuming the duration of a pregnancy to be 9 months and applied the appropriate average annual incidence estimates made over the period 1991–2002 considered to affect females of childbearing age. Thus:

Statistical methods
Samples were classified individually according to age group (as previously described), sex, region, year of sample collection and CMV-specific IgG status. Region was classified as North (50·5%) and South (49·5%) according to the location of the laboratory providing the sample. CMV-specific IgG status for individual samples was assigned using the fixed cut-off identified that gave an equal number of false-positive and false-negative results. A multivariable analysis was then undertaken using logistic regression with CMV-specific IgG status as the dependent variable and age group, region, gender and year of sample collection included as independent variables (Stata 8.2; StataCorp., College Station, TX, USA).
RESULTS
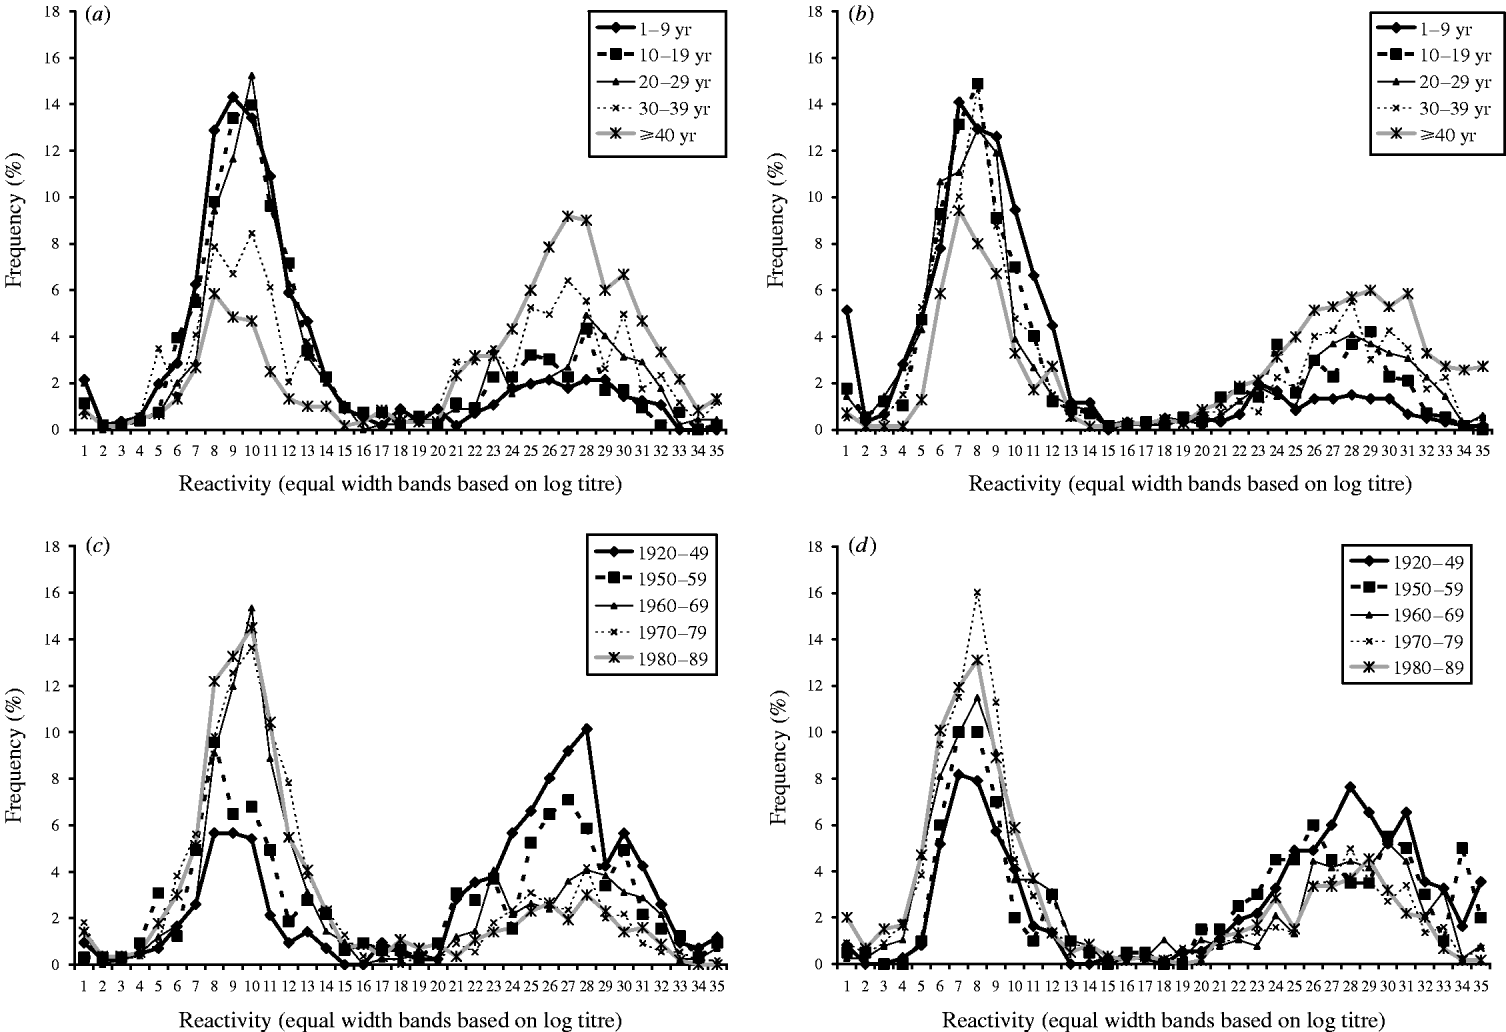
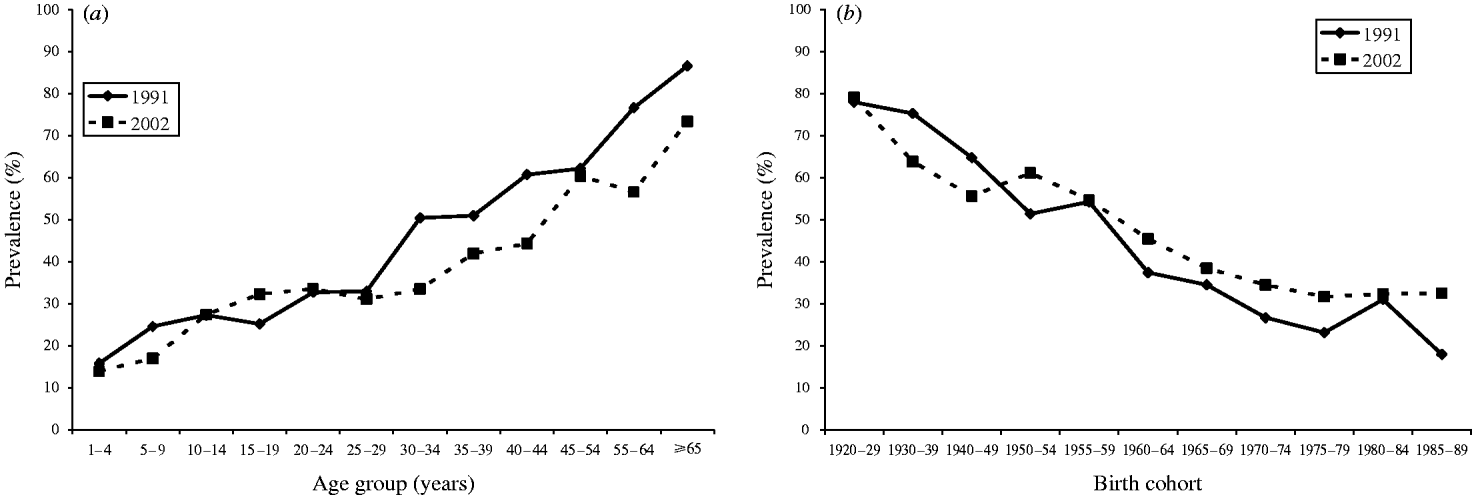
Frequency distributions of age group and birth cohort stratified quantitative serological data are shown in Figure 1(a–d). These show that data aggregates into two distinct distributions. Two normal distributions were therefore used to model these data, which provided a reasonable fit [age group: deviance=1764 on 812 degrees of freedom (d.f.); birth cohort: deviance=1435 on 774 d.f.). CMV antibody prevalence estimates resulting from fitting the mixture model to these data are shown by age group (Fig. 2 a) and birth cohort (Fig. 2 b). Prevalence was very similar for each of the two time points represented for those aged 1–29 years, but consistently higher in those aged ⩾30 years using samples collected during 1991.

Fig. 1. Frequency distributions of cytomegalovirus serological data stratified by age group. (a) 1991 data, (b) 2002 data and birth cohort, (c) 1991 data, (d) 2002 data.

Fig. 2. Model estimates of cytomegalovirus antibody prevalence by (a) age group and (b) birth cohort, stratified by year of sample collection.
The final model used to estimate the incidence of CMV in those born 1920–1989 over the period 1991–2002 categorized birth cohort according to period of birth (from 1920–1929 to 1985–89 as previously described) and fitted the data well (deviance=10·2 on 8 d.f.). There was evidence that incidence varied for different age groups over the period investigated with the simplest model that best described the data requiring separate parameters for λ91-02 for those born 1920–1949, 1950–1984 and 1985–1989 (P=0·05) (see Table 1).
Table 1. Average estimates of cytomegalovirus incidence calculated over the period 1991–2002 in persons born 1920–1989

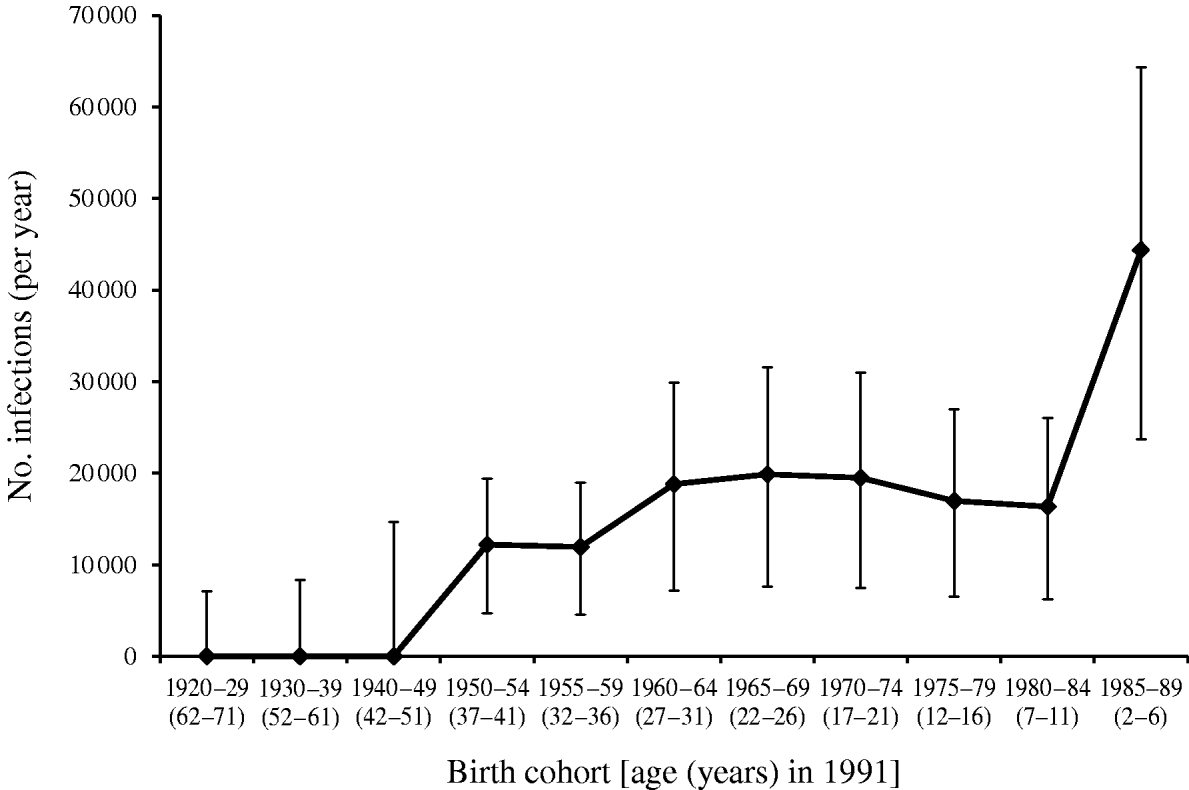
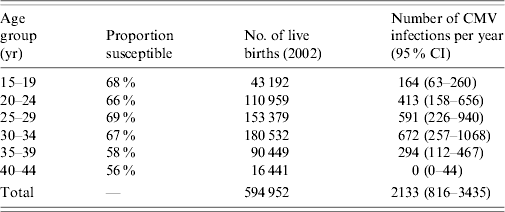
Applying these estimates to population data for England and Wales obtained in 1991 suggests that between 1991 and 2002 a total of 1 759 951 (95% CI 747144–3061046) CMV infections occurred in those born 1920–1989. The annual average estimated incidence of CMV infection stratified by birth cohort using these data is shown in Figure 3. Table 2 shows the average annual number of CMV infections estimated to occur in pregnant females in England and Wales, applying an average annual incidence of 0·75% (95% CI 0·29–1·19) to females aged 15–39 years and 0% (95% CI 0–0·64) to females aged 40–44 years. This equates to ~1 (95% CI 0·38–1·61) CMV infection in every 279 pregnancies annually.

Fig. 3. Model estimates of average annual cytomegalovirus incidence measured over the period 1991–2002.
Table 2. The average annual incidence of cytomegalovirus (CMV) infection estimated to occur in pregnant females

CMV-specific IgG status for individual samples was assigned using a fixed cut-off that gave equal numbers of false-positive and false-negative results, identified as 630 ELISA units (corresponding to the bottom of reactivity category 17). This cut-off was used for the multivariable analysis which showed there was a strong association between CMV antibody prevalence and increasing age (P<0·001) but no strong evidence to suggest that prevalence increased with age group in those aged 1–29 years in a nonlinear fashion (P=0·4). There was no strong evidence of an association with gender [odds ratio (OR) 0·93, 95% confidence interval (CI) 0·82–1·06, P=0·27] or region (OR 1·03, 95% CI 0·91–1·18, P=0·62), and no evidence of an association with year of sample collection for those aged 1–29 years (OR 1·00, 95% CI 0·85–1·17, P=0·98). However, there was strong evidence that compared to data from 1991, prevalence was lower in samples collected in 2002 for those aged ⩾30 years (OR 0·57, 95% CI 0·47–0·69, P<0·001).
DISCUSSION
The frequency distributions of quantitative data stratified by both age group and birth cohort demonstrates that data aggregate into two very clearly distinguishable distributions reflecting those susceptible and those with evidence of past CMV infection. This suggests that the Behring Enzygnost CMV ELISA assay used in the present study performed extremely well and supports the assumption that CMV-specific IgG persists for life and does not wane with time. If there was a tendency for antibody to decline over time, more results falling in between these two major distributions might be expected. Moreover, the proportion in the distribution representing those susceptible consistently decreases with increasing age/birth cohort suggesting that waning of antibody is not a significant factor. Applying the same mixture model to data from each year of collection enabled direct comparisons between prevalence estimates to be made for each time point. However, as only a very small proportion of samples gave a quantitative result that fell into the area where the two distributions overlapped suggests that a fixed cut-off is also a feasible and accurate alternative approach for categorizing these data qualitatively at the population level and will give very similar results to the mixture model.
When stratifying by age group antibody prevalence increased with age from ~15% in those aged 1–4 years to ~80% in those aged ⩾65 years, reflecting other antibody prevalence studies in developed countries recently carried out [Reference Staras4, Reference Tookey, Ades and Peckham7, Reference Griffiths, McLean and Emery8]. A notable feature is that whilst antibody prevalence is very similar for each of the two time points represented for those aged 1–29 years, it is consistently higher in those aged ⩾30 years using samples collected during 1991. This was supported by the multivariable analysis and suggests that the epidemiology of CMV affecting those aged 1–29 years did not change significantly at the end of the 20th century. However, since no information is available to determine precisely when and at what age infection occurred, all that can be inferred from this difference in prevalence observed in older age groups is that at some stage in the more distant past the epidemiology of CMV has altered with the force of infection subsequently decreasing. Low socioeconomic status has been identified as a risk factor for acquiring CMV infection [Reference Kenneson and Cannon1], suggesting this observation may reflect improvements in living conditions and hygiene in the latter half of the 20th century.
CMV antibody prevalence was comparatively high in those aged 1–4 years, and was surprisingly high in those aged 1 year (11·5%, data not shown). This phenomenon has also been observed for varicella zoster virus which is also a member of the herpes virus family [Reference Vyse11]. Other published large-scale antibody prevalence studies for CMV in similar populations from developed countries do not include samples from those aged 1 year [Reference Staras4, Reference Griffiths, McLean and Emery8]. The high prevalence in this very young age group is unlikely to be due to the persistence of maternal antibody since all persons providing specimens for this study were aged at least 12 months, and the incidence estimated in women of childbearing age indicates that maternal infections during pregnancy will not account for such a high prevalence of antibody at this early age. One explanation is that CMV infection may be acquired particularly rapidly by infants. There is some evidence to support this possibility, a previous study finding that 20% of infants with no evidence of congenital infection were excreting the virus at 12 months [Reference Peckham15]. Alternatively, this may reflect a specificity problem with the assay when testing samples from the very young, possibly as a result of some cross-reactivity with antibody to other herpes viruses with a high prevalence in this age group such as HHV-6 and HHV-7. The possibility of maternal recrudescence as a potential explanation for the high prevalence in the very young also needs to be considered, which cannot be addressed by the present study.
When stratifying by common birth cohorts those samples collected from persons in 2002 represent an opportunity to observe the effect of an additional 11 years of time for exposure to CMV infection in comparison to those collected in 1991. Therefore, unless CMV-specific IgG has a tendency to wane significantly, prevalence estimates for common birth cohorts should be higher in 2002 (or at least remain similar if there has been no acquisition of infection), which was observed consistently for those born post-1950. This approach to analysing these antibody prevalence data enabled an incidence of CMV infection to be calculated over the time period investigated (1991–2002).
The model used to estimate CMV incidence between 1991 and 2002 suggested that over this period most infection occurred in children and young adults, with little infection in older adults aged ⩾40 years. There was some evidence that the rate of acquisition of CMV infection did not vary in older children and young adults but was higher in the very young. This is consistent with previous findings of high CMV antibody prevalence in young children attending pre-school day-care facilities [Reference Ross and Boppana6]. This suggests transmission of the virus is propagated by the close person-to-person contact common in this environment, particularly as the likelihood of contact with body fluids such as saliva and urine that are important in the transmission of CMV will be increased in this less hygienically aware population [Reference Kenneson and Cannon1, Reference Cannon and Davis3, Reference Ross and Boppana6]. A previous study found that child-to-parent transmission of infection plays a significant part in the acquisition of CMV infection in adult life, suggesting that adults with young children are most at risk [Reference Tookey, Ades and Peckham7]. This is also supported by our finding that between 1991 and 2002 there was no evidence of CMV infection in older adults aged >40 years, but infection was acquired by younger adults more likely to be parents of young children.
The incidence of CMV estimated by this study in older children and young adults was comparable although slightly lower than contemporary force-of-infection estimates made in a UK population of antenatal women [Reference Griffiths, McLean and Emery8] and the general US population aged 12–49 years [Reference Colugnati2]. This small difference could be attributed to the latter two studies using data from a single point in time where time trends and current incidence could not be addressed, high antibody prevalence in older cohorts possibly causing the models to overestimate the force of infection. The relatively modest incidence estimated by this study in older children and young adults also reflects the low estimates for the basic reproduction number currently available for CMV [Reference Colugnati2, Reference Griffiths, McLean and Emery8] (~2·5 in a UK population of antenatal women and ~1·7 in the general US population aged 12–49 years). This indicates that CMV is not an easily transmitted infection and supports the conclusion that should a suitable vaccine become available, relatively low levels of coverage will be required to control or eradicate the disease [Reference Griffiths, McLean and Emery8].
Applying the incidence estimates derived from these data to population estimates and pregnancy data for England and Wales suggests that despite a relatively modest incidence, infection with CMV may represent a significant and overlooked public health concern [Reference Kenneson and Cannon1]. Additionally, it is likely that the incidence estimates calculated may be underestimates since a proportion of cases will be due to a reactivation of the latent virus previously acquired earlier in life and not measured by this study, and the estimates in pregnant females do not account for any fetal mortality during pregnancy or abortions as a result of maternal CMV infection. However, whilst it is widely recognized that further work is needed to evaluate more precisely the risk of serious sequelae following a CMV infection, particularly following infection acquired during pregnancy [Reference Kenneson and Cannon1–Reference Dollard, Grosse and Ross5], some assessment of the scale of the public health burden in England and Wales due to congenitally acquired CMV can be made using results provided by a recent study that estimated the prevalence of neurological and sensory sequelae and mortality associated with congenital CMV infection [Reference Dollard, Grosse and Ross5]. This suggested that 0·5% of children born with congenital CMV will die and 17–20% of those surviving will demonstrate one or more long-term sequelae [Reference Dollard, Grosse and Ross5]. Combining these estimates with the incidence estimates provided by the present study implies that in infants born with congenital CMV in England and Wales, an annual total of 11 deaths might be expected with 363–427 children going on to demonstrate long-term sequelae.
Throughout 1992 and 1993 a total of 2938 laboratory reports of CMV infection in England and Wales were received by the Public Health Laboratory Service Communicable Disease Surveillance Centre [Reference Ryan, Miller and Waight16], representing only a small fraction of the total annual number of cases estimated by this study. Approximately 50% of these reports were from immunocompromised patients and only 47 were from pregnant females. This probably reflects the mild or asymptomatic nature of CMV infection in otherwise healthy individuals and indicates that CMV infection is considerably under-recognized outside of immunocompromised groups, particularly in pregnant females who are considered a key risk group.
The present study therefore highlights a need for increased public awareness of CMV infection, particularly in pregnant females, and for interventions to be developed to reduce the substantial burden of this disease. Until a suitable vaccine becomes available better education in key risk groups focusing on improved hygiene to interrupt key transmission routes may be an appropriate strategy that should be considered.
ACKNOWLEDGEMENTS
This work was supported by the Health Protection Agency Pump Priming Fund and has appropriate MREC approval. We thank all the HPA Regional and collaborating laboratories who have contributed serum samples to the HPA Sero-epidemiology Unit collection and also thank Nigel Gay and Nick Andrews (Health Protection Agency, Centre for Infections, Modelling, Statistics and Bioinformatics Unit) for valuable discussion on the analysis.
DECLARATION OF INTEREST
None.


