Public stigma against people with mental health problems is damaging to individuals with mental illness and is associated with substantial societal burden. Reference Link, Phelan, Bresnahan, Stueve and Pescosolido1,Reference Sharac, McCrone, Clement and Thornicroft2 It is a global phenomenon, Reference Thornicroft, Brohan, Rose, Sartorius and Leese3 which is prevalent and persists over time. Reference Pescosolido, Martin, Long, Medina, Phelan and Link4,Reference Schomerus, Schwahn, Holzinger, Corrigan, Grabe and Carta5 A recent systematic review and meta-analysis of public attitudes showed that despite improvements in mental health literacy, public attitudes and desire for social distance have remained stable over time. Reference Schomerus, Schwahn, Holzinger, Corrigan, Grabe and Carta5 Moreover, additional research suggests that there is a link between public stigma and the individual experiences of stigma among people with mental health problems. Reference Evans-Lacko, Brohan, Mojtabai and Thornicroft6 Prior research examining public attitudes towards people with mental health problems in England and Scotland demonstrated a deterioration of attitudes between 1994 and 2003. Reference Mehta, Kassam, Leese, Butler and Thornicroft7 Relative to Scotland, which initiated the national anti-stigma initiative ‘see me’ in 2002, attitudes in England showed worsening between 2000 and 2003. Reference Mehta, Kassam, Leese, Butler and Thornicroft7 These findings, in addition to the growing body of scientific evidence for reducing stigma and discrimination, supported the development of England's national Time to Change (TTC) programme against stigma and discrimination. The programme aimed to overcome criticisms of other anti-stigma programmes by targeting public behaviour, and by facilitating social contact and social inclusion of people with mental health problems.
We examined longitudinal trends in mental health-related knowledge, attitudes and behaviour among the general public in England associated with the implementation of the TTC programme, to determine whether such knowledge, attitudes and behaviour had improved since its inception.
Method
Data source
The UK Department of Health Attitudes to Mental Illness survey is conducted by Taylor Nelson Sofres plc as part of an omnibus survey and has been carried out annually since 2008 as a part of the Time to Change evaluation. Although TTC received funding in October 2007, the social marketing campaign activity did not begin until after the survey was run in 2009. Thus the Attitudes to Mental Illness survey provides baseline and follow-up indicators of mental health-related knowledge, attitudes and behaviour among a nationally representative sample of adults residing in England. Approximately 1700 respondents were surveyed each year from 2009 to 2012. The survey was carried out using a quota sample, with sample points selected by a random location method. Census small area statistics and the Postcode Address File were used to define sample points which were stratified by government office region and social status.
The sample surveyed had slightly higher representation of individuals in lower socioeconomic classes compared with individuals from middle and upper socioeconomic classes and this was corrected through sample weighting. The sample included equal numbers of men (47%) and women (53%) and the mean age was approximately 46 years (range 16-98, s.d. = 18.6). Interviews were conducted in participants' homes by fully trained personnel using computer-assisted personal interviewing, and demographic information was collected at the end of the interview. Additional information regarding the survey methods can be found at www.ic.nhs.uk/pubs/attitudestomi11. The study was classified as exempt by the King's College London psychiatry, nursing and midwifery research ethics subcommittee.
Measures
Knowledge
Mental health-related knowledge was measured by the Mental Health Knowledge Schedule (MAKS). Reference Evans-Lacko, Little, Meltzer, Rose, Rhydderch and Henderson8 Part A comprised six items covering stigma-related mental health knowledge areas (help-seeking, recognition, support, employment, treatment and recovery) and Part B consisted of six items that enquired about classification of various conditions as mental illnesses. Reference Rusch, Evans-Lacko and Thornicroft9 Overall test-retest reliability of the MAKS is 0.71 (Lin's concordance statistic) and the overall internal consistency among items was 0.65 (Cronbach's alpha). Reference Evans-Lacko, Little, Meltzer, Rose, Rhydderch and Henderson8 The total score was calculated so that higher MAKS scores indicate greater knowledge.
Attitudes
The UK Department of Health Attitudes to Mental Illness questionnaire was developed in 1993 based on previous research in Toronto, Canada, and the West Midlands, UK. It included 26 items based on the 40-item Community Attitudes toward the Mentally Ill (CAMI) scale Reference Taylor and Dear10 and the Opinions about Mental Illness Scale, Reference Cohen and Struening11 and an added item on employment-related attitudes. Items referred to attitudes about social exclusion, benevolence, tolerance and support for community mental healthcare and were rated from 1 (strong disagreement) to 5 (strong agreement). The total score was calculated so that higher CAMI scores indicated less stigmatising attitudes. We calculated the overall internal consistency among CAMI items in these data; Cronbach's α = 0.87.
Reported and intended behaviour
Mental health-related reported and intended behaviour were measured by the Reported and Intended Behaviour Scale (RIBS). Reference Evans-Lacko, Rose, Little, Flach, Rhydderch and Henderson12 We specifically assessed changes in four intended behaviour outcomes (domains comprised: living with, working with, living nearby and continuing a relationship with someone with a mental health problem), which were based on existing measures of social distance that assess willingness to engage with a member of the ‘outgroup’. Reference Phillips13,Reference Link, Yang, Phelan and Collins14 Four intended behaviour items assessed the level of intended future contact with people with mental health problems and an additional four reported behaviour items assessed past or current contacts. Overall test-retest reliability of the RIBS was 0.75 (Lin's concordance statistic). The overall internal consistency of the scale was 0.85 (Cronbach's α). The total intended behaviour score was calculated so that higher scores indicated more favourable intended behaviour. For reported behaviour prevalence estimates of any reported behaviour were calculated.
Socioeconomic status
Socioeconomic status of the respondent was categorised into one of four categories (AB, C1, C2 and DE) according to the Market Research Society's classification system. Classification was based on the occupation of the chief income earner in the household. Category AB represented individuals with professional/managerial occupations, C1 represented individuals with other non-manual occupations, C2 represented individuals having skilled manual occupations and DE represented individuals with semi-skilled or unskilled manual occupations and people dependent on state benefits.
Familiarity with mental health problems
Previous research demonstrates that knowing someone with a mental health problem or familiarity with mental illness is strongly associated with mental health-related knowledge, attitudes and behaviour. Reference Corrigan, Morris, Michaels, Rafacz and Rusch15-Reference Pettigrew and Tropp17 We measured familiarity with mental health problems/knowing someone with a mental health problem using the question ‘Who is the person closest to you who has or has had some kind of mental illness?’ Potential response options included immediate family (spouse, child, sister, brother, parent, etc.), partner (living with you), partner (not living with you), other family (uncle, aunt, cousin, grandparent, etc.), friend, acquaintance, work colleague, self, other (please specify) and no one known. Responses were then categorised into three groups: self, other and none.
Statistical analysis
We calculated basic descriptive statistics for participant characteristics in addition to all knowledge, attitude and behaviour items by year. To avoid multiple testing, statistical tests for annual changes were applied only to total instrument scores rather than each item. Three separate multivariate linear regression models examined changes in total knowledge (measured by total standardised MAKS score, part A), attitudes (measured by total standardised CAMI score) and intended behaviour (measured by total standardised RIBS score) between the start of the Time to Change programme in 2009 and the completion of phase one of the programme in 2012. To measure changes in reported behaviour (presence of social contact in any of the four contexts) we used a multivariable logistic regression. Other covariates included in each regression model included gender (female v. male), age (continuous), ethnicity (categorical: Asian, Black, Other and White), socioeconomic status (categorical: AB, C1, C2 and DE), and familiarity with mental health problems (categorical: self, other and none). Survey sampling weights were applied in all analyses so that respondents reflected a nationally representative sample in terms of sociodemographic characteristics within each region of England. Analyses were carried out using SAS version 9.1 for Windows.
Results
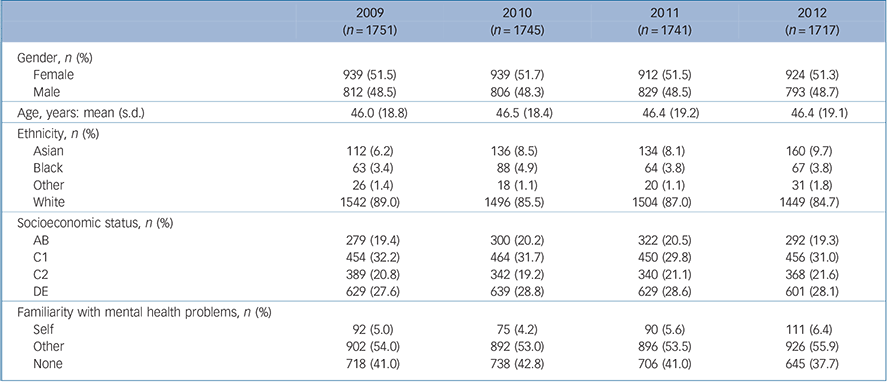
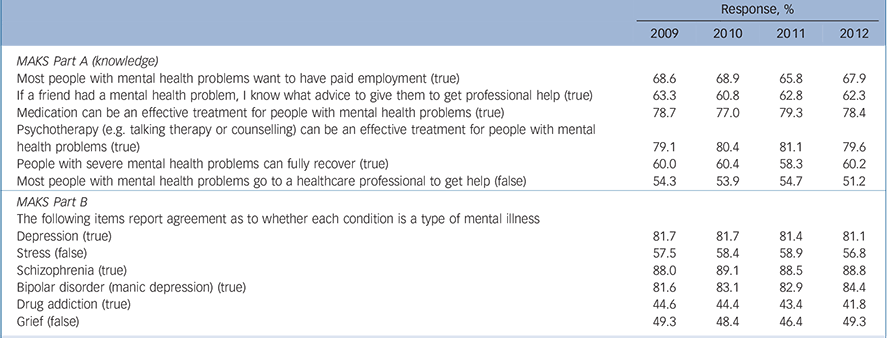
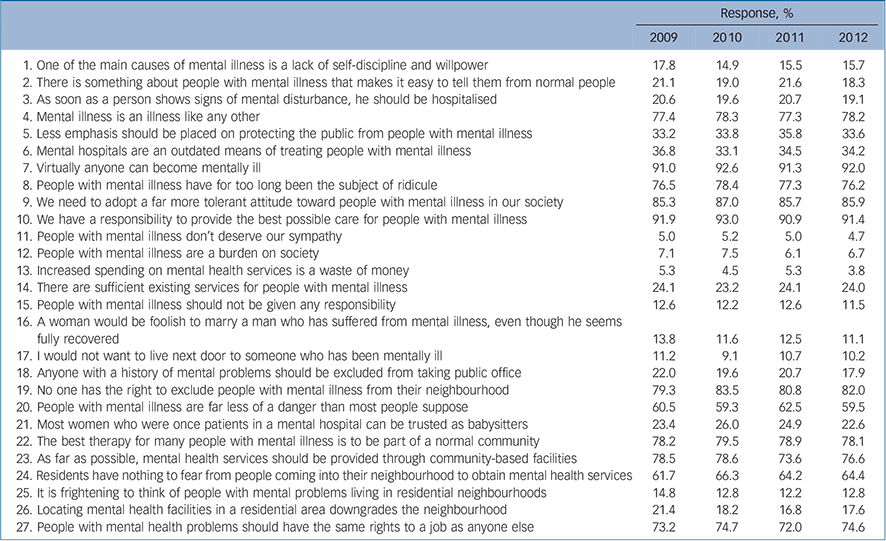
Table 1 provides details of the sample participants in terms of sociodemographic characteristics and familiarity with mental health problems. Tables 2, 3, 4 summarise the stigma-related knowledge, attitude and behaviour responses at the item level, stratified by year.
Table 1 Participant characteristics stratified by survey year (unweighted frequency and weighted percentage)
| 2009 (n = 1751) |
2010 (n = 1745) |
2011 (n = 1741) |
2012 (n = 1717) |
|
|---|---|---|---|---|
| Gender, n (%) | ||||
| Female | 939 (51.5) | 939 (51.7) | 912 (51.5) | 924 (51.3) |
| Male | 812 (48.5) | 806 (48.3) | 829 (48.5) | 793 (48.7) |
| Age, years: mean (s.d.) | 46.0 (18.8) | 46.5 (18.4) | 46.4 (19.2) | 46.4 (19.1) |
| Ethnicity, n (%) | ||||
| Asian | 112 (6.2) | 136 (8.5) | 134 (8.1) | 160 (9.7) |
| Black | 63 (3.4) | 88 (4.9) | 64 (3.8) | 67 (3.8) |
| Other | 26 (1.4) | 18 (1.1) | 20 (1.1) | 31 (1.8) |
| White | 1542 (89.0) | 1496 (85.5) | 1504 (87.0) | 1449 (84.7) |
| Socioeconomic status, n (%) | ||||
| AB | 279 (19.4) | 300 (20.2) | 322 (20.5) | 292 (19.3) |
| C1 | 454 (32.2) | 464 (31.7) | 450 (29.8) | 456 (31.0) |
| C2 | 389 (20.8) | 342 (19.2) | 340 (21.1) | 368 (21.6) |
| DE | 629 (27.6) | 639 (28.8) | 629 (28.6) | 601 (28.1) |
| Familiarity with mental health problems, n (%) | ||||
| Self | 92 (5.0) | 75 (4.2) | 90 (5.6) | 111 (6.4) |
| Other | 902 (54.0) | 892 (53.0) | 896 (53.5) | 926 (55.9) |
| None | 718 (41.0) | 738 (42.8) | 706 (41.0) | 645 (37.7) |
Table 2 Responses to Mental Health Knowledge Schedule items (strongly or slightly agree), weighted percentages
| Response, % | ||||
|---|---|---|---|---|
| 2009 | 2010 | 2011 | 2012 | |
| MAKS Part A (knowledge) | ||||
| Most people with mental health problems want to have paid employment (true) | 68.6 | 68.9 | 65.8 | 67.9 |
| If a friend had a mental health problem, I know what advice to give them to get professional help (true) | 63.3 | 60.8 | 62.8 | 62.3 |
| Medication can be an effective treatment for people with mental health problems (true) | 78.7 | 77.0 | 79.3 | 78.4 |
| Psychotherapy (e.g. talking therapy or counselling) can be an effective treatment for people with mental health problems (true) | 79.1 | 80.4 | 81.1 | 79.6 |
| People with severe mental health problems can fully recover (true) | 60.0 | 60.4 | 58.3 | 60.2 |
| Most people with mental health problems go to a healthcare professional to get help (false) | 54.3 | 53.9 | 54.7 | 51.2 |
| MAKS Part B | ||||
| The following items report agreement as to whether each condition is a type of mental illness Depression (true) | 81.7 | 81.7 | 81.4 | 81.1 |
| Stress (false) | 57.5 | 58.4 | 58.9 | 56.8 |
| Schizophrenia (true) | 88.0 | 89.1 | 88.5 | 88.8 |
| Bipolar disorder (manic depression) (true) | 81.6 | 83.1 | 82.9 | 84.4 |
| Drug addiction (true) | 44.6 | 44.4 | 43.4 | 41.8 |
| Grief (false) | 49.3 | 48.4 | 46.4 | 49.3 |
MAKS, Mental Health Knowledge Schedule.
Table 3 Responses to Community Attitudes toward the Mentally Ill items (strongly or slightly agree; weighted percentages)
| Response, % | ||||
|---|---|---|---|---|
| 2009 | 2010 | 2011 | 2012 | |
| 1.One of the main causes of mental illness is a lack of self-discipline and willpower | 17.8 | 14.9 | 15.5 | 15.7 |
| 2. There is something about people with mental illness that makes it easy to tell them from normal people | 21.1 | 19.0 | 21.6 | 18.3 |
| 3. As soon as a person shows signs of mental disturbance, he should be hospitalised | 20.6 | 19.6 | 20.7 | 19.1 |
| 4. Mental illness is an illness like any other | 77.4 | 78.3 | 77.3 | 78.2 |
| 5. Less emphasis should be placed on protecting the public from people with mental illness | 33.2 | 33.8 | 35.8 | 33.6 |
| 6. Mental hospitals are an outdated means of treating people with mental illness | 36.8 | 33.1 | 34.5 | 34.2 |
| 7. Virtually anyone can become mentally ill | 91.0 | 92.6 | 91.3 | 92.0 |
| 8. People with mental illness have for too long been the subject of ridicule | 76.5 | 78.4 | 77.3 | 76.2 |
| 9. We need to adopt a far more tolerant attitude toward people with mental illness in our society | 85.3 | 87.0 | 85.7 | 85.9 |
| 10. We have a responsibility to provide the best possible care for people with mental illness | 91.9 | 93.0 | 90.9 | 91.4 |
| 11. People with mental illness don't deserve our sympathy | 5.0 | 5.2 | 5.0 | 4.7 |
| 12. People with mental illness are a burden on society | 7.1 | 7.5 | 6.1 | 6.7 |
| 13. Increased spending on mental health services is a waste of money | 5.3 | 4.5 | 5.3 | 3.8 |
| 14. There are sufficient existing services for people with mental illness | 24.1 | 23.2 | 24.1 | 24.0 |
| 15. People with mental illness should not be given any responsibility | 12.6 | 12.2 | 12.6 | 11.5 |
| 16. A woman would be foolish to marry a man who has suffered from mental illness, even though he seems fully recovered | 13.8 | 11.6 | 12.5 | 11.1 |
| 17. I would not want to live next door to someone who has been mentally ill | 11.2 | 9.1 | 10.7 | 10.2 |
| 18. Anyone with a history of mental problems should be excluded from taking public office | 22.0 | 19.6 | 20.7 | 17.9 |
| 19. No one has the right to exclude people with mental illness from their neighbourhood | 79.3 | 83.5 | 80.8 | 82.0 |
| 20. People with mental illness are far less of a danger than most people suppose | 60.5 | 59.3 | 62.5 | 59.5 |
| 21. Most women who were once patients in a mental hospital can be trusted as babysitters | 23.4 | 26.0 | 24.9 | 22.6 |
| 22. The best therapy for many people with mental illness is to be part of a normal community | 78.2 | 79.5 | 78.9 | 78.1 |
| 23. As far as possible, mental health services should be provided through community-based facilities | 78.5 | 78.6 | 73.6 | 76.6 |
| 24. Residents have nothing to fear from people coming into their neighbourhood to obtain mental health services | 61.7 | 66.3 | 64.2 | 64.4 |
| 25. It is frightening to think of people with mental problems living in residential neighbourhoods | 14.8 | 12.8 | 12.2 | 12.8 |
| 26. Locating mental health facilities in a residential area downgrades the neighbourhood | 21.4 | 18.2 | 16.8 | 17.6 |
| 27. People with mental health problems should have the same rights to a job as anyone else | 73.2 | 74.7 | 72.0 | 74.6 |
Table 4 Responses to Reported and Intended Behaviour Scale items (strongly or slightly agree; weighted percentages)

| Response, % | |||||
|---|---|---|---|---|---|
| 2009 | 2010 | 2011 | 2012 | ||
| Reported behaviour | |||||
| Live with | 20.3 | 16.5 | 18.5 | 19.8 | |
| Work with | 27.3 | 25.2 | 26.3 | 27.4 | |
| Work nearby | 19.2 | 20.1 | 17.7 | 20.0 | |
| Continue a relationship | 35.2 | 33.8 | 32.5 | 34.2 | |
| Intended behaviour | |||||
| Live with | 56.5 | 58.0 | 55.9 | 56.6 | |
| Work with | 68.8 | 70.7 | 68.3 | 70.7 | |
| Work nearby | 71.8 | 73.6 | 71.7 | 74.1 | |
| Continue a relationship | 82.5 | 84.6 | 81.9 | 83.3 | |
National changes in responses
Knowledge
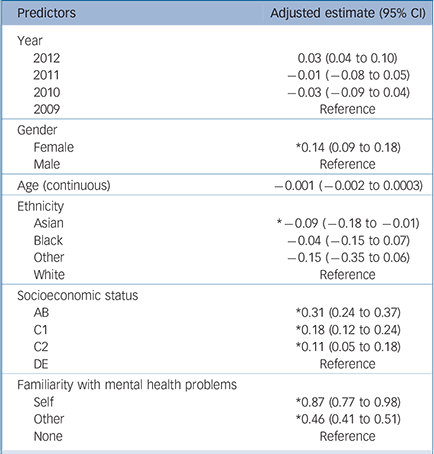
There was no significant improvement in overall knowledge score between 2009 and 2012. Factors associated with a statistically significant higher total knowledge score on the MAKS included female gender, higher socioeconomic status and knowing someone with a mental health problem (Table 5). Women scored 0.14 s.d. units higher on the MAKS than men. Compared with individuals in lower socioeconomic groups (DE), individuals in groups AB, C1 and C2 scored respectively 0.31, 0.18 and 0.11 s.d. units higher on the MAKS. Relative to individuals who stated that they did not know anyone with a mental health problem, respondents who indicated that they had a mental health problem themselves or knew someone with a mental health problem scored respectively 0.87 and 0.46 s.d. units higher on the MAKS. Being of Asian ethnicity (relative to White ethnicity) was associated with scoring 0.09 s.d. lower on the MAKS.
Table 5 Knowledge: linear regression analysis of predictors of mental health-related knowledge among the general public, measured by standardised Mental Health Knowledge Schedule scorea (n = 6754)
| Predictors | Adjusted estimate (95% CI) |
|---|---|
| Year | |
| 2012 | 0.03 (0.04 to 0.10) |
| 2011 | –0.01 (–0.08 to 0.05) |
| 2010 | –0.03 (–0.09 to 0.04) |
| 2009 | Reference |
| Gender | |
| Female | Footnote * 0.14 (0.09 to 0.18) |
| Male | Reference |
| Age (continuous) | –0.001 (–0.002 to 0.0003) |
| Ethnicity | |
| Asian | Footnote * –0.09 (–0.18 to −0.01) |
| Black | –0.04 (–0.15 to 0.07) |
| Other | –0.15 (–0.35 to 0.06) |
| White | Reference |
| Socioeconomic status | |
| AB | Footnote * 0.31 (0.24 to 0.37) |
| C1 | Footnote * 0.18 (0.12 to 0.24) |
| C2 | Footnote * 0.11 (0.05 to 0.18) |
| DE | Reference |
| Familiarity with mental health problems | |
| Self | Footnote * 0.87 (0.77 to 0.98) |
| Other | Footnote * 0.46 (0.41 to 0.51) |
| None | Reference |
a. Part A; total possible score for each item is 5.
* P = 0.05.
Attitudes
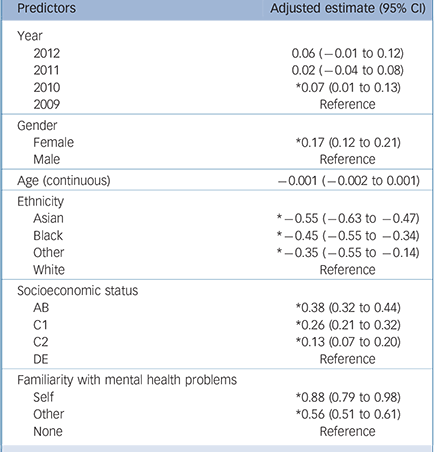
National public attitudes showed a clear improvement in 2010 (Table 6). Relative to 2009, respondents in 2010 scored 0.07 s.d. units higher on the CAMI. Public attitudes in 2012 showed a non-significant trend for improvement over 2009 (s.d. = 0.06, P = 0.08). Factors associated with a statistically significant higher total attitude score included female gender, White ethnicity, higher socioeconomic status and being familiar with mental health problems. Women scored 0.17 s.d. units higher on the CAMI than men. Compared with individuals in lower socioeconomic groups (DE), individuals in groups AB, C1 and C2 scored respectively 0.38, 0.26 and 0.13 s.d. units higher on the CAMI. Relative to individuals who stated that they did not know anyone with a mental health problem, individuals who indicated that they had a mental health problem themselves or knew someone with a mental health problem scored respectively 0.88 and 0.56 s.d. units higher on the CAMI. Relative to individuals of White ethnicity, individuals of Asian, Black and other ethnicities scored 0.55, 0.45 and 0.35 s.d. units lower on the CAMI.
Table 6 Attitudes: linear regression analysis of predictors of attitudes among the general public, measured by standardised Community Attitudes toward the Mentally Ill scoreFootnote a
| Predictors | Adjusted estimate (95% CI) |
|---|---|
| Year | |
| 2012 | 0.06 (–0.01 to 0.12) |
| 2011 | 0.02 (–0.04 to 0.08) |
| 2010 | Footnote * 0.07 (0.01 to 0.13) |
| 2009 | Reference |
| Gender | |
| Female | Footnote * 0.17 (0.12 to 0.21) |
| Male | Reference |
| Age (continuous) | –0.001 (–0.002 to 0.001) |
| Ethnicity | |
| Asian | Footnote * –0.55 (–0.63 to −0.47) |
| Black | Footnote * –0.45 (–0.55 to −0.34) |
| Other | Footnote * –0.35 (–0.55 to −0.14) |
| White | Reference |
| Socioeconomic status | |
| AB | Footnote * 0.38 (0.32 to 0.44) |
| C1 | Footnote * 0.26 (0.21 to 0.32) |
| C2 | Footnote * 0.13 (0.07 to 0.20) |
| DE | Reference |
| Familiarity with mental health problems | |
| Self | Footnote * 0.88 (0.79 to 0.98) |
| Other | Footnote * 0.56 (0.51 to 0.61) |
| None | Reference |
a. Total possible score for each item is 5 points.
* P = 0.05.
Intended behaviour
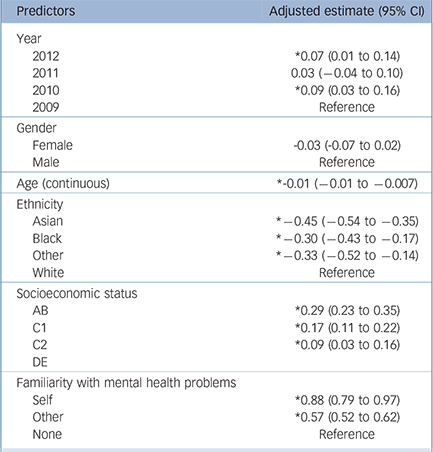
Public responses regarding intended behaviour improved significantly from 2009 to 2012; respondents in 2012 scored 0.07 s.d. units higher on the RIBS (Table 7). Other factors associated with a statistically significant higher intended behaviour score included being of younger age, White ethnicity, higher socioeconomic status and being familiar with a person with mental health problems. Specific to age, on average, respondents scored 0.01 s.d. units lower on the RIBS for each additional year. Compared with individuals in the lowest socioeconomic groups (DE), individuals in groups AB, C1 and C2 respectively scored 0.29, 0.17 and 0.09 s.d. units higher on the RIBS. Relative to individuals who stated that they did not know anyone with a mental health problem, individuals who indicated that they had a mental health problem themselves or knew someone who did scored respectively 0.88 and 0.57 s.d. units higher on the RIBS. Relative to individuals of White ethnicity, individuals of Asian, Black and other ethnicities scored 0.45, 0.30 and 0.33 s.d. lower on the RIBS.
Table 7 Intended behaviour: linear regression analysis of predictors of intended behaviour among the general public, measured by standardised Reported and Intended Behaviour Scale scores (n = 6754)
| Predictors | Adjusted estimate (95% CI) |
|---|---|
| Year | |
| 2012 | Footnote * 0.07 (0.01 to 0.14) |
| 2011 | 0.03 (–0.04 to 0.10 |
| 2010 | Footnote * 0.09 (0.03 to 0.16) |
| 2009 | Reference |
| Gender | |
| Female | -0.03 (−0.07 to 0.02) |
| Male | Reference |
| Age (continuous) | Footnote * -0.01 (–0.01 to −0.007) |
| Ethnicity | |
| Asian | Footnote * –0.45 (–0.54 to −0.35) |
| Black | Footnote * –0.30 (–0.43 to −0.17) |
| Other | Footnote * –0.33 (–0.52 to −0.14) |
| White | Reference |
| Socioeconomic status | |
| AB | Footnote * 0.29 (0.23 to 0.35) |
| C1 | Footnote * 0.17 (0.11 to 0.22) |
| C2 | Footnote * 0.09 (0.03 to 0.16) |
| DE | |
| Familiarity with mental health problems | |
| Self | Footnote * 0.88 (0.79 to 0.97) |
| Other | Footnote * 0.57 (0.52 to 0.62) |
| None | Reference |
* P = 0.05.
Reported behaviour
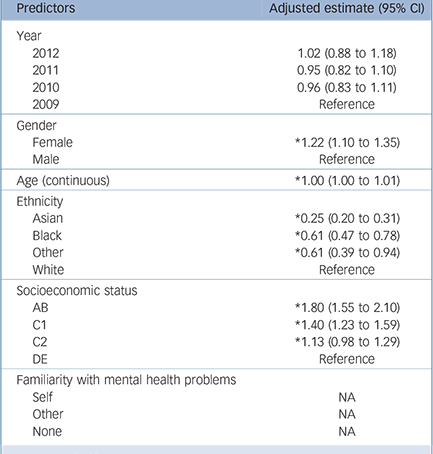
There was no significant improvement in reported behaviour from 2009 to 2012. Factors that were associated with a statistically significant higher likelihood of reported behaviour (endorsement of any of the reported behaviour items) included female gender (OR = 1.2), being of older age (OR = 1.00), White ethnicity (relative to White ethnicity, odds ratios for individuals of Black, Asian and other ethnicity were 0.2, 0.6 and 0.6 respectively) and higher socioeconomic status (relative to individuals in socioeconomic classes DE, odds ratios for individuals of AB, C1 and C2 were 1.8, 1.4 and 1.1 respectively) (Table 8).
Table 8 Reported behaviour: logistic regression analysis of predictors of public reported behaviour, measured by standardised Reported and Intended Behaviour Scale scores (n = 6754)
| Predictors | Adjusted estimate (95% CI |
|---|---|
| Year | |
| 2012 | 1.02 (0.88 to 1.18) |
| 2011 | 0.95 (0.82 to 1.10) |
| 2010 | 0.96 (0.83 to 1.11) |
| 2009 | Reference |
| Gender | |
| Female | Footnote * 1.22 (1.10 to 1.35) |
| Male | Reference |
| Age (continuous) | Footnote * 1.00 (1.00 to 1.01) |
| Ethnicity | |
| Asian | Footnote * 0.25 (0.20 to 0.31) |
| Black | Footnote * 0.61 (0.47 to 0.78) |
| Other | Footnote * 0.61 (0.39 to 0.94) |
| White | Reference |
| Socioeconomic status | |
| AB | Footnote * 1.80 (1.55 to 2.10) |
| C1 | Footnote * 1.40 (1.23 to 1.59) |
| C2 | Footnote * 1.13 (0.98 to 1.29) |
| DE | Reference |
| Familiarity with mental health problems | |
| Self | NA |
| Other | NA |
| None | NA |
NA, not applicable.
* P = 0.05.
Discussion
This study examined national trends associated with the implementation of the Time to Change programme. We assessed knowledge, attitudes and reported and intended behaviour in relation to people with mental illness from 2009 to 2012 using an annual, nationally representative data-set. Our findings indicate that over this period there were improvements in intended behaviour and a trend towards more positive attitudes (P = 0.08) among the English population. There was, however, no significant improvement in knowledge or reported behaviour at the national level.
Demonstration of a significant impact in relation to intended behaviour is in line with the findings specific to the TTC anti-stigma and social marketing campaign which showed modest but significant improvements, especially in relation to intended behaviour (see Evans-Lacko et al, this supplement), Reference Evans-Lacko, Malcolm, West, Rose, London and Rü sch18 and the evidence for a reduction in discrimination as reported by service users in relation to TTC. Reference Henderson, Corker, Lewis-Holmes, Hamilton, Flach and Rose19 This finding is in contrast to other naturalistic studies which have shown a general trend towards worsening of stigmatising attitudes and desire for social distance internationally alongside improvements in public knowledge or mental health literacy. Reference Pescosolido, Martin, Long, Medina, Phelan and Link4,Reference Schomerus, Schwahn, Holzinger, Corrigan, Grabe and Carta5 Interestingly, the TTC programme - which did not focus upon knowledge content - was not associated with improvements in knowledge among the public. We assessed knowledge alongside the campaign because improved knowledge can be a significant outcome in and of itself, Reference Brandli, Guimon, Fischer and Sartorius20-Reference Rusch, Evans-Lacko, Henderson, Flach and Thornicroft23 and improvement was demonstrated at a local pilot of the TTC initiative just prior to the launch of the national TTC programme; Reference Evans-Lacko, London, Little, Henderson and Thornicroft16 however, this was not a specific target of the programme. Reference Henderson and Thornicroft24 Other interventions have shown improvements in public knowledge, and we predicted that there would be significant improvements in knowledge following the TTC campaign. It is possible that differences in campaign messages, Reference Clement, Jarrett, Henderson and Thornicroft25 or explicit targeting of outcomes might have contributed to differences in effects.
Strengths and limitations of the study
The study used a large, nationally representative data-set which included baseline measures specifically targeted and developed for the evaluation of the TTC programme. Our findings provide new information about the impact of the programme against stigma and discrimination across England. Despite these strengths, there are some limitations associated with this study. Because there was no control group, it is impossible to know what would have happened without the programme and how much of the changes between 2009 and 2012 can be attributed to it. It is possible that events in the sociopolitical context, such as the economic downturn and associated policies that have been implemented in response, might have influenced public knowledge, attitudes and behaviours towards people with mental health problems. The economy may have influenced both the rates of recovery for people with mental illness and public reactions. Notably, TTC did demonstrate improvements despite strained economic conditions. An additional limitation is that we did not collect information about awareness or engagement with the TTC campaign in years 2009-2011 of this survey and thus we do not know the extent to which campaign awareness contributed to changes in knowledge, attitudes or behaviour. Data collected specifically to evaluate the social marketing campaign, however, suggest that there is a significant relationship between higher campaign awareness and better knowledge, attitude and behaviour outcomes. Reference Phillips13,Reference Evans-Lacko, Malcolm, West, Rose, London and Rü sch18 Finally, as all data collected were self-reported, we cannot be sure to what extent social desirability played a part in the responses. Reference Henderson, Evans-Lacko, Flach and Thornicroft26 Nevertheless, the mechanism of data collection did not change over the study period and so we have no reason to believe that this would influence the outcomes.
Implications
Our findings provide support for national anti-stigma programmes in improving intended behaviour but not mental health-related knowledge. An improvement in attitudes was clear but less substantial. These findings suggest that local and national activity might work synergistically to address a wide range of anti-stigma outcomes. Additional research is needed to better understand the relative contributions of different types of interventions when delivered locally v. nationally through the mass media or in a one-to-one manner, and how to deliver them according to best practices, i.e. in a targeted, local, credible and continuous manner. Reference Corrigan27 Differences in stigma-related outcomes analysed according to sociodemographic characteristics noted in the results suggest potential target groups for future anti-stigma work. Qualitative findings suggest the importance of considering culture and beliefs in the development of anti-stigma interventions such as TTC and that tailored interventions might improve engagement around mental health issues. Reference Knifton, Gervais, Newbigging, Mirza, Quinn and Wilson28,Reference Shefer, Rose, Nellums, Thornicroft, Henderson and Evans-Lacko29 The TTC campaign has already begun a pilot group study with a South Asian community in London, and phase 2 of the campaign will involve focused work with Black and minority ethnic communities, starting with African-Caribbean audiences. Finally, with regard to evaluation, these findings suggest that monitoring and evaluation of trends locally as well as nationally may be important for campaigns, as there may be differences in local needs, reception and reactions to different campaign messages.
Funding
The Time to Change evaluation was funded by the Big Lottery Fund, Comic Relief and Shifting Attitudes to Mental Illness (SHiFT), UK government Department of Health. G.T. and C.H. are funded in relation to a National Institute for Health Research (NIHR) Applied Programme grant awarded to the South London and Maudsley National Health Service (NHS) Foundation Trust (G.T.). G.T. is funded in relation to the NIHR Specialist Mental Health Biomedical Research Centre at the Institute of Psychiatry, King's College London and the South London and Maudsley NHS Foundation Trust. C.H. and S.E.L. were supported by a grant to Time to Change from Big Lottery and Comic Relief. C.H. is also funded by a grant from the Maudsley Charity and a grant from Guy's and St Thomas's Charity.
Acknowledgements
We are grateful for the comments and feedback provided by our statistical consultants, Clare Flach and Morven Leese, and to Bruce Link for his comments on an earlier draft of this article. We thank Sue Baker, Maggie Gibbons, Paul Farmer, Paul Corry, Katherine Crawshaw and Sarah Cohen for their collaboration on the evaluation.


eLetters
No eLetters have been published for this article.