Arginine (ARG) is known to be a versatile amino acid (AA), and its metabolic properties have been extensively studied( Reference Wu, Bazer and Davis 1 ). ARG is largely used at pharmacological dosages in pathological states (e.g. injured patients) and as a food supplement in healthy subjects (athletes, elderly). ARG is proposed to increase growth hormone secretion and to sustain nitric oxide production. Pharmacokinetics studies have thus been led to characterise ARG behaviour in plasma after oral administration and to clarify its mechanisms of action( Reference Cynober 2 ). It has also been proposed that citrulline (CIT) administration (a direct ARG precursor) could be a good alternative to further increase plasma ARG concentrations( Reference Moinard, Nicolis and Neveux 3 – Reference Bahri, Zerrouk and Aussel 5 ), as several experimental and clinical studies have found that CIT efficiently increases plasma ARG concentrations( Reference Moinard, Nicolis and Neveux 3 , Reference Osowska, Moinard and Neveux 6 , Reference Lassala, Bazer and Cudd 7 ). The metabolic pathways of ARG and CIT are closely inter-related, and metabolic channelling along with the respective complex inter-organ metabolisms( Reference Wu, Bazer and Davis 1 , Reference Bahri, Zerrouk and Aussel 5 , Reference Mistry, Greenfeld and Morris 8 ) may profoundly modify ARG metabolism and bioavailability according to original source (i.e. ARG or CIT). However, the available pharmacokinetic data refer solely to healthy young adults. Elderly people generally display a reduced lean body mass and alteration of organ functions (i.e. kidney and intestine, which have a key role in ARG and CIT metabolism), which means that what is true in young adults may not necessarily be true in the elderly. Even if ARG and CIT pharmacokinetics are well described in adult populations, there are still no data in elderly populations. We hypothesise that CIT is more suitable than ARG itself to generate ARG at the systemic level in the elderly. Accordingly, the aim of this study was to determine tolerance and pharmacokinetic characteristics after ARG or CIT administration in healthy older subjects, with special focus on systemic bioavailability of ARG according to original-source AA administered (i.e. ARG or CIT).
Methods
The study was approved by the Auvergne Region Institutional Review Board (IRB) and performed to the ethical standards of the Declaration of Helsinki. The protocol was not registered at http://clinicaltrials.gov, as it was accepted by the IRB before http://clinicaltrials.gov had gone online. All volunteers gave written informed consent after a full explanation of the study. One of the institutions involved in the study has French Ministry of Health authorisation to perform experiments on healthy volunteers.
Subjects
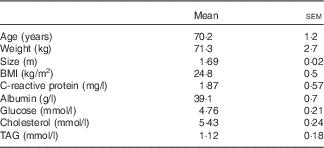
Volunteers were pre-selected from the General Clinical Research Center database. The study was performed on eight healthy elderly male volunteers (age 70·2 (sem 1·2) years; BMI 24·8 (sem 0·5) kg/m2). The number of volunteers was calculated according to the results obtained with previous study( Reference Moinard, Nicolis and Neveux 3 ), particularly the variability of primary outcome. We calculated, with a risk of first species α=5 % and second species β=20 %, the number of subjects necessary to obtain a significant change in the AUC of plasma levels of AA. Under these conditions, a staff of eight subjects was considered as sufficient. All volunteers were given a medical check-up to ensure that they had no acute or chronic diseases or signs of infection and inflammation; none of the subjects were taking any medication liable to affect AA metabolism. Subjects were screened by physical examination, blood tests, urinary analysis and electrocardiogram according to EURAGE Senieur protocol admission criteria( Reference Ligthart, Corberand and Fournier 9 ).
All volunteers received a normoproteic diet during the week before beginning the study and throughout the study.
Protocol
All volunteers received two isomolar oral loads consisting of CIT (10 g) and ARG (9·94 g) administered in random order, with each load separated by a washout period of 15 d. CIT and ARG were dissolved into 150 ml of water, and the solution was drunk rapidly. The glass was then rinsed in 50 ml of water, again rapidly drunk by the volunteers. The doses are similar to those used in previous pharmacokinetics and therapeutic studies on these two AA or other related AA (e.g. ornithine (ORN))( Reference Cynober 2 ). Blood samples were withdrawn just before administration (considered as time 0 h) and at 0·25, 0·5, 0·75, 1, 1·5, 2, 3, 5 and 8 h after the loads. Urine samples (for the determination of N excretion) were collected in vessels containing antiseptic during the 16 h before load and then at 0–8 h after load.
Measurements
Plasma amino acid concentrations
Blood samples were rapidly centrifuged and deproteinised with a 30 % (w/v) sulfosalicylic acid solution. The supernatant fractions were stored at −80°C until analysis. AA were separated and quantified by ion exchange chromatography using an AA autoanalyzer (Aminotac JLC-500/V; Jeol Ltd) with ninhydrin derivatisation, as described previously( Reference Moinard, Nicolis and Neveux 3 ). Our participation in the European Quality Control Scheme (ERNDIM) is evidence of the accuracy of our AA determinations.
Nitrogen excretion
N was quantified by chemiluminescence on an Antek 9000 analyzer (Antek)( Reference Grimble 10 ).
Other parameters
Biochemical markers (Na, K, Cl, urea, creatinine, alkaline phosphatase, alanine aminotransferase, aspartate aminotransferase, γ-glutamyltranspeptidase, total cholesterol, HDL-cholesterol, LDL-cholesterol, TAG, glucose, albumin, C-reactive protein) and haematological markers (leucocytes, polymorphonuclear cells, lymphocytes, monocytes, erythrocytes, prothrombin) were determined before and after the study period, as previously described( Reference Moinard, Nicolis and Neveux 3 ).
Pharmacokinetics and statistical analysis of plasma arginine after arginine or citrulline loads
Pharmacokinetic models and parameters
After various attempts, a model with a zero-order mechanism for the admission phase (i.e. appearance in systemic blood) and a first-order elimination mechanism was chosen as giving the best fits to individual curves for ARG plasma levels. Each of these mechanisms may be understood as approximations of Michaelis–Menten monoenzymatic kinetics, the first being saturated and the second being far from saturation.
Plasma concentration is then described by the following relation:
where B is a ‘size’ parameter dependent on the dose and volume of distribution, k E is the parameter governing kinetic elimination, related to elimination half life t 1/2 by the usual rate constant relation k E =0·693/t 1/2, T A is the duration of the zero-order admission kinetic, related to the duration of systemic appearance (probably because of the duration of transit through the part of the bowel where admission took place), b 0 is a baseline parameter to account for the non-zero physiological level of ARG.
To enable comparative analysis, secondary parameters were derived:
-
– AUC:
 $${AUC\left( {{\rm 0,}\;\infty} \right)=B\;T_{A} }$$
-
– time to reach peak concentration :
 $${t_{{{\rm max}}} =T_{A} }$$
where peak concentration C max=B (1−exp(−k E T A ))+b 0.
Statistical analysis
The statistical analysis was led in two steps: first, least square fitting of the model to individual curves to obtain primary and secondary parameters with assessments of their estimation precisions; second, comparison of the parameters between the two sets of values corresponding to either CIT or ARG administrations, which was conducted as simple paired comparisons for each parameter.
All computations were performed with R, with the functions optim() for the first part and classical tests (Student, Wilcoxon or ANOVA) for the second part( 11 ).
Results
Seven of the eight subjects completed the two trials. There was one dropout (for personal reasons and not because of the study) who was not replaced. Subject characteristics are reported in Table 1.
Table 1 Characteristics of the subjects (Mean values with their standard errors)
Tolerance
None of the volunteers suffered nausea, diarrhoea or any other side effects, regardless of the trial.
Safety
A clinical and biological check-up was performed in order to evaluate the potential adverse effect of ARG or CIT load. None of the biomarkers measured were affected by ARG or CIT supplementation, and no clinical symptoms manifested during the study (data not shown).
Urinary nitrogen excretion
N excretion was similar before and after ARG load (0·43 (sem 0·02) and 0·50 (sem 0·14) g N/h, respectively) or CIT load (0·48 (sem 0·08) and 0·48 (sem 0·12) g N/h, respectively).
Pharmacokinetic parameters of plasma arginine after oral arginine or citrulline administration
The model gives a satisfactory fit of plasma ARG levels for both CIT load and ARG load (Fig. 1 gives the kinetics for subject no. 1 as a representative example). A bi-compartmental model was unable to reproduce the sharpness of the max of the curves and constantly gave poorer fits than the model used here (data not shown).

Fig. 1 Time course of plasma arginine (ARG) after oral citrulline load (10 g; ![]() ) v. after oral ARG load (9·94 g;
) v. after oral ARG load (9·94 g; ![]() ) (kinetics of subject no. 1 shown here as a representative example). Means of experimental measures (
) (kinetics of subject no. 1 shown here as a representative example). Means of experimental measures (![]() ) and estimated values (
) and estimated values (![]() ).
).
Estimation of pharmacokinetic parameters
For each pharmacokinetic parameter, the fit of the individual curves gave the parameter values below, reported with CV (CV=asymptotic sd/estimated value).
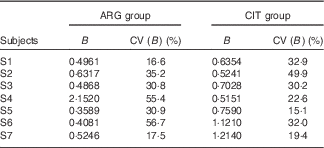
B (Table 2)
For subject no. 4, the value of the B parameter for the ARG group (2·1520) is probably an outlier. Accordingly, parametric (paired Student) and non-parametric (paired Wilcoxon) test comparisons were performed. Only the Student’s test without subject no. 4 gave a P value<5 % (0·0489), but it was so close that we concluded that the difference was not significant.
Table 2 Results of the fits of the pharmacokinetic model for parameter B (‘size’ parameter dependent on dose and volume of distribution) (Estimations and coefficients of variation)
ARG, arginine; CIT, citrulline.
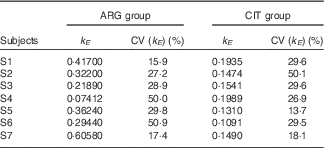
k E (Table 3)
There was a slightly significant difference between the two paired sets of k E parameters (paired Student’s test; P=4·1 %), which confirmed that the rate of ARG elimination differed between the two groups.
Table 3 Results of the fits of the pharmacokinetic model for parameter k E (parameter governing kinetic elimination) (Estimations and coefficients of variation)
ARG, arginine; CIT, citrulline.
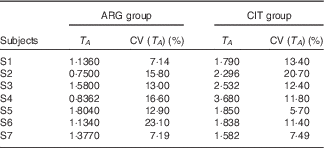
T A (Table 4)
There was a significant difference between the two paired sets of T A parameters (paired Student’s test; P=3·3 %), with length of the admission period and time at peak concentration being larger in the CIT group.
Table 4 Results of the fits of the pharmacokinetic model for parameter T A (duration of the zero-order admission kinetic, related to the duration of systemic appearance) (Estimations and coefficients of variation)
ARG, arginine; CIT, citrulline.
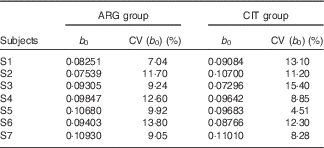
b 0 (Table 5)
At baseline (b 0), plasma levels of ARG, as expected, were not significantly different between the two groups (paired Student’s test; P=96 %).
Table 5 Results of the fits of the pharmacokinetic model for parameter b 0 (baseline parameter to account for the non-zero physiological level of arginine (ARG)) (Estimations and coefficients of variation)
CIT, citrulline.
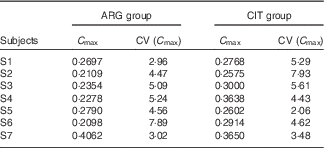
C max (Table 6)
There was no significant between-group difference in C max (paired Student’s test; P=14 %).
Table 6 Results of the fits of the pharmacokinetic model for parameter C max (peak concentration) (Estimations and coefficients of variation)
ARG, arginine; CIT, citrulline.
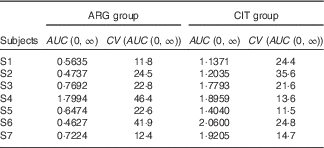
AUC (Table 7)
The AUC of plasma ARG (Table 7) was significantly larger (paired one-sided Student’s test; P=0·6 %) after CIT administration than after ARG administration.
Table 7 Results of the fits of the pharmacokinetic model for the parameter AUC (Estimations and coefficients of variation)
ARG, arginine; CIT, citrulline.
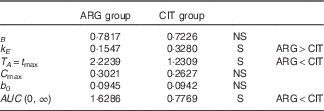
Summary of the results (Table 8)
Volume of distribution (parameter B) and baseline ARG level (parameter b 0) were not dependent on AA administered (i.e. ARG or CIT load). Conversely, the parameters related to ARG kinetics were strongly dependent on AA administered: k E was larger and T A was shorter when ARG was administered. The higher elimination (k E ; P=4·1 %) of ARG and lower admission period and time at peak concentration (T A ; P=3·3 %) combine to give markedly lower ARG bioavailability when ARG itself is administered than when CIT is administered.
Table 8 Summary of the tests of pharmacokinetic parameters
ARG, arginine; CIT, citrulline; S, significant.
Discussion
AA are very popular with many populations because of their (real or perceived) properties, and they are widely consumed as dietary supplements. ARG certainly counts among the most popular and most widely consumed, but CIT, an efficient ARG precursor, is also largely used. Several studies have already evaluated the pharmacokinetics of these two AA in healthy adults( Reference Cynober 2 – Reference Schwedhelm, Maas and Freese 4 , Reference Tangphao, Grossmann and Chalon 12 ) and demonstrated the ability of CIT to generate ARG. However, to the best of our knowledge, there has been no assessment in older populations, despite the fact that ageing is associated with decline in organ functions, particularly the kidneys and intestine, which have a pivotal role in CIT and ARG metabolism: CIT is synthesised from ARG in the small bowel and ARG from CIT in the kidneys( Reference Bahri, Zerrouk and Aussel 5 ), which means any alteration in the functionality of these organs may affect ARG and CIT metabolism and tolerance to ARG and CIT supplementation( Reference Mistry, Greenfeld and Morris 8 ). It is well known that ORN α-ketoglutarate, an ARG precursor, is well tolerated in young adults up to a 10-g load( Reference Cynober, Vaubourdolle and Dore 13 ), whereas this same dose often triggers diarrhoea in elderly subjects (S Allison, personal communication).
The results obtained here clearly indicate that CIT and ARG at this selected dosage are well tolerated in the elderly, as neither induced gastrointestinal disorders, which was not evident for ARG( Reference Grimble 14 ). With regard to the safety of CIT in the elderly, biological exploration did not show any side effect of acute administration of this AA. This result is in line with previous studies in young adults and confirms the safety of CIT( Reference Moinard, Nicolis and Neveux 3 , Reference Bahri, Zerrouk and Aussel 5 ).
The two main sites of endogenous ARG synthesis from CIT are the liver, where ARG is synthesised and then immediately hydrolysed within the urea cycle into ORN( Reference Meijer, Lamers and Chamuleau 15 ), and the renal cortex, where most of the synthesised ARG is released into the bloodstream( Reference Moinard, Nicolis and Neveux 3 ). The present work clearly indicates in the elderly that CIT is an ARG precursor at the whole-body level. Of note, the C max of ARG after CIT load appears to be the same as previously observed in young adults (i.e. approximately 280 µmol/l)( Reference Moinard, Nicolis and Neveux 3 ). Such an observation is in agreement with the experimental work performed by Mistry et al. ( Reference Mistry, Greenfeld and Morris 8 ), which clearly demonstrated that the expression levels of the genes involved in renal ARG synthesis and intestinal CIT synthesis are not affected by ageing.
In addition, the ARG generated gets very rapidly metabolised into ORN, confirming that in the elderly, as in adults, arginase activity is not a limiting step in urea synthesis, whereas experimental data using isolated perfused rat liver indicated a drop in urea production in the liver of old animals compared with young ones( Reference Jourdan, Cynober and Moinard 16 ). Note, however, that these ex vivo studies fail to integrate inter-organ regulation.
However, the data obtained raise the question of why ARG synthesised from exogenous CIT does not have the same behaviour as ARG from exogenous ARG. Our data suggest a better bioavailability of CIT, which is supported by the fact that CIT is absorbed by the intestinal brush border by a broad array of transporters including the B0,+, b0,+ and L systems( Reference Bahri, Zerrouk and Curis 17 ). However, this is not the only factor involved in ARG bioavailability after CIT load. In a recent experimental study( Reference Elwafi, Curis and Zerrouk 18 ), we observed that CIT bioavailability decreased considerably in the course of endotoxaemia, whereas ARG generation remain unmodified, confirming that CIT intestinal absorption is not the only mechanism involved. Clearly, such a result confirms our hypothesis that CIT is a better ARG precursor than ARG itself, and the pharmacokinetic study reported here in elderly subject confirms results from previous experimental data( Reference Bahri, Zerrouk and Aussel 5 ) and clinical data( Reference Moinard, Nicolis and Neveux 3 – Reference Bahri, Zerrouk and Aussel 5 , Reference Jourdan, Nair and Carter 19 ) obtained in young adults.
In an attempt to define a suitable pharmacokinetic model of plasma ARG concentrations after ARG or CIT load, we can consider that the appearance and elimination rates of AA in plasma are both controlled by cellular carriers or enzymes with a specific constant – that is intestinal transport and arginase activity in tissues other than hepatocytes where arginase activity is never limiting( Reference Jourdan, Cynober and Moinard 16 ). We ran an attempt with a double Michaelis–Menten model, but the relatively small number of observation time points did not enable satisfactory fits. We consequently worked on approximations of this model. Usually, when an enzyme is confronted with decreasing concentrations of substrate, as the concentration becomes smaller than the affinity constant Km of the enzyme, the process may be fairly described by a first-order kinetics. This kind of approximation also appears to be valid for the elimination process. Admission instead is better described by a zero-order process, which means that the substrate concentrations are higher than the Km of the enzyme (observed values are approximately 15–30 mm, whereas the Km of arginases is approximately 0·1 mm for Arginase 1 and 5 mm for Arginase 2( Reference Di Costanzo, Sabio and Mora 20 , Reference Durante, Johnson and Johnson 21 )). In usual practice, this kind of zero-order process is only transient and the mechanism evolves to a first-order kinetic when concentration decreases. The explanation could be that a bolus AA solution is at a much higher concentration than physiological levels, and one can hypothesise that the admission process takes place on a limited length of the intestinal tract that does not allow the plasma concentration to fall below the Km, with the result that admission process thus stays close to its zero-order approximation. Such a hypothesis obviously needs to be confirmed by tracer studies, allowing us to explore more precisely the ARG metabolism (and in particular metabolic flux controlled by arginases or nitric oxide synthase).
In conclusion, the present pharmacokinetic study clearly shows in the elderly that CIT is a potent ARG precursor at the whole-body level, thus confirming that ARG availability does not decline with advanced age. Moreover, for the first time, CIT and ARG pharmacokinetics are compared in the same study, and we confirm that plasma ARG behaviour differs markedly according to the molecule (CIT or ARG) administered. Furthermore, a 10-g dose of CIT is well tolerated in the elderly, and it demonstrates metabolic advantages over ARG in terms of bioavailability, suggesting that CIT supplementation is suitable in the elderly even for ARG supplementation (i.e. for CVD)( Reference Lorin, Zeller and Guilland 22 ). Of note, the therapeutic advantage remains to be determined.
Acknowledgements
This work was funded by the French Ministry of Research and Technology (EA 4466).
L. C. and C. M. designed the study, and C. M. wrote the manuscript. All the other authors contributed to the manuscript and to the discussion. S. W. and Y. B. performed the clinical study, J. M. collected the data and performed amino acid analysis and J. M. and V. L. performed statistical analysis and modelisation. All authors read and approved the final manuscript.
L. C. and C. M. are shareholders of Citrage Company.


