Introduction
Tidal interaction with floating glaciers has been studied for many years and for many reasons. Reference HoldsworthHoldsworth (1969,Reference Holdsworth1977) analyzed the stresses set up by tidal motion in the transition region where the glacier changes from grounded to floating conditions, with a view to studying under what conditions the fracture strength of glacier ice would be reached and iceberg calving occur.
The grounding zone, where the line of contact between glacier and bed moves forth and back with the tide, is believed to be of importance for the stability of the entire glacier system. In order to detect possible long-term grounding-zone migration, indicative of glacier instability, it is important to locate this zone and monitor its changing position due to tidal motion (Reference RignotRignot, 1998a,Reference Rignotb).
The synthetic aperture radar (SAR) technique for simultaneous measurement of ice-sheet surface topography and velocity is extremely sensitive to vertical displacements in the period between acquisitions of SAR images. For floating glaciers, the effect of tidal deflections must therefore be estimated and removed from the SAR interferograms before the velocity of the glacier motion can be derived (Reference RignotRignot, 1996).
Most models of tidal flexure of floating glaciers (e.g. Reference HoldsworthHoldsworth, 1969, Reference Holdsworth1977; Reference Lingle, Hughes and KollmeyerLingle and others, 1981; Reference StephensonStephenson, 1984; Reference VaughanVaughan 1994,Reference Vaughan1995) take their origin in the analysis of beams of elastic material on elastic foundations (Reference HetenyiHetenyi, 1946). Reference VaughanVaughan (1995), based on then published and unpublished tidal displacement data, concludes that the elastic-beam model with a single value of the elastic modulus E = 0.88±0.35 GPa adequately described all the data except a dataset from Jakobshavn Isbræ, Greenland, measured by Reference Lingle, Hughes and KollmeyerLingle and others (1981). The elastic model could only be fitted to the Jakobshavn data by choosing a much lower E value or by assuming that surface and basal crevassing reduced the “bending-effective” thickness from the real thickness of 750–800 m to only 150 m (Reference VaughanVaughan, 1995). On the contrary, Reference RignotRignot (1996) found E = 3 ±0.2 GPa or three times larger than the value derived by Reference VaughanVaughan (1995), by fitting the tidal flexure pattern of Petermann Gletscher, North Greenland, determined by interferometric SAR (InSAR) measurement, to the Hetenyi model.
The E values derived from fitting elastic models to observed tidal flexure patterns of glaciers are 3–10 times less than the E value derived from laboratory measurements of the velocity of sound waves in ice. For isotropic, polycrystalline ice such experiments, which measure the true elastic (Young’s) modulus not influenced by creep, give E = 9.3 GPa (Reference Petrenko and WhitworthPetrenko and Whitworth, 1999, p. 40). The need to use a smaller effective elastic modulus (Reference SinhaSinha, 1978; Reference Mellor and TrydeMellor, 1980) that indirectly accounts for the viscoelastic properties of ice shows that ice creep may have a significant influence on tidal flexure of glaciers.
Application of the elastic-beam model was challenged by Reference Reeh, Mayer, Olesen, Christensen and ThomsenReeh and others (2000), who could not fit such a model to detailed tidal-deflection and tilt measurements on Nioghalvfjerdsfjorden glacier, northeast Greenland. Reference Reeh, Mayer, Olesen, Christensen and ThomsenReeh and others (2000) tentatively suggested that viscoelastic-beam theory should be applied (Reference IversenIversen, 1972). This idea is taken up in the present paper. Moreover, we disengage ourselves from other constraints implied by the usual theory of tidal bending of glaciers. Hetényi’s standard analytical solution, for example, presupposes uniform beam (glacier) thickness and infinite length of the beam. The geometry of real glaciers often deviates substantially from these idealizations. Longitudinal thickness profiles of Petermann Gletscher (Reference RignotRignot, 1998b) and Nioghalvfjerdsfjorden glacier (Reference Mayer, Reeh, Jung-Rothenhausler, Huybrechts and OerterMayer and others, 2000) reveal, for example, a reduction in ice thickness from ∼600 m at the grounding line to ∼250 m at a distance of 20 km from the grounding line. This thickness change corresponds to a variation of the bending rigidity of the glacier by a factor of ∼14. The change in thickness along the relatively short floating sections of West Greenland-type outlet glaciers such as Jakobshavn Isbræ is less pronounced. In general, however, the ratio of horizontal extent to thickness of these glaciers is small compared to the characteristic relative decay length of the elastic flexure pattern. Thus, a free-floating stage is not achieved at the terminus as assumed by the prevalent theory.
The aim of the present paper is to develop a theory of tidal bending of glaciers by using linear viscoelastic-beam theory and to apply the theory to a re-analysis of tidal bending data from Nioghalvfjerdsfjorden glacier. Implications of a viscoelastic rather than an elastic response of glaciers to tidal forcing are discussed briefly.
Nioghalvfjerdsfjorden Glacier
An extensive floating glacier tongue fills the entire interior of Nioghalvfjerdsfjorden (Fig. 1). The length of the glacier tongue is 80km and the width is 21km halfway downstream, widening to about 30km at the main ice front. The outermost ∼60 km of the glacier is afloat, with an upstream grounding zone crossing the glacier from the western branch of the ice-dammed lake Blåsø in the north to Lambert Land in the south. Grounding zones also occur along the side margins of the glacier and at four islands or ice rises at the main front of the glacier. A field programme was carried out on the glacier in the 1996–98 summer seasons. The study comprised observations of tidal movement (Reference Reeh, Mayer, Olesen, Christensen and ThomsenReeh and others, 2000), bathy metry (Reference Mayer, Reeh, Jung-Rothenhausler, Huybrechts and OerterMayer and others, 2000), surface velocity and strain rate (Reference ThomsenThomsen and others, 1997), and detailed mapping of surface elevation and ice thickness by means of an airborne ice-radar and laser-altimeter survey (Reference Christensen, Reeh, Forsberg, Jorgensen, Skou and WoeldersChristensen and others, 2000).

Fig. 1. Map of Nioghalvfjerdsfjorden glacier. For location, see insert map in upper left corner. The location of tidal GPS measurement stations (legends starting with NF), the Base camp with the fixed GPS reference point, and the pressure-gauge observation site (“Syge Moster”) are shown. Inclinometer observations were performed at five stations between points NF9775 and NF9776. The position of the laser altimeter and ice-radar profile is shown as line marked C–C across the glacier. Approximate location of the upstream grounding zone is shown by the grey shading running south from the western branch of Blåsø to Lambert Land.
Observations of tidal motion
The tidal-movement observations of the Nioghalvfjerdsfjorden glacier tongue used in this study comprise simultaneous global positioning system (GPS) deflection measurements and tiltmeter measurements over several tidal cycles in the period 15–17 August 1997. The measurements were made in a cross-profile ∼30 km from the grounding zone. A tide gauge installed in the sea immediately in front of the glacier front at “Syge Moster” recorded the tide in the open sea. The locations of the measurement sites are shown in Figure 1. The deflection measurement involved six points in the cross-section. The observations were performed as differential GPS measurements in respect to a local reference on firm rock, using a recording interval of 30 s. The data were processed hour by hour using the ASHTECH GPPS software for static processing, providing hourly measurements of the tidal deflection.
The horizontal motion over the total recording period was also derived from the GPS measurements, resulting in the cross-sectional velocity profile shown in Figure 2.
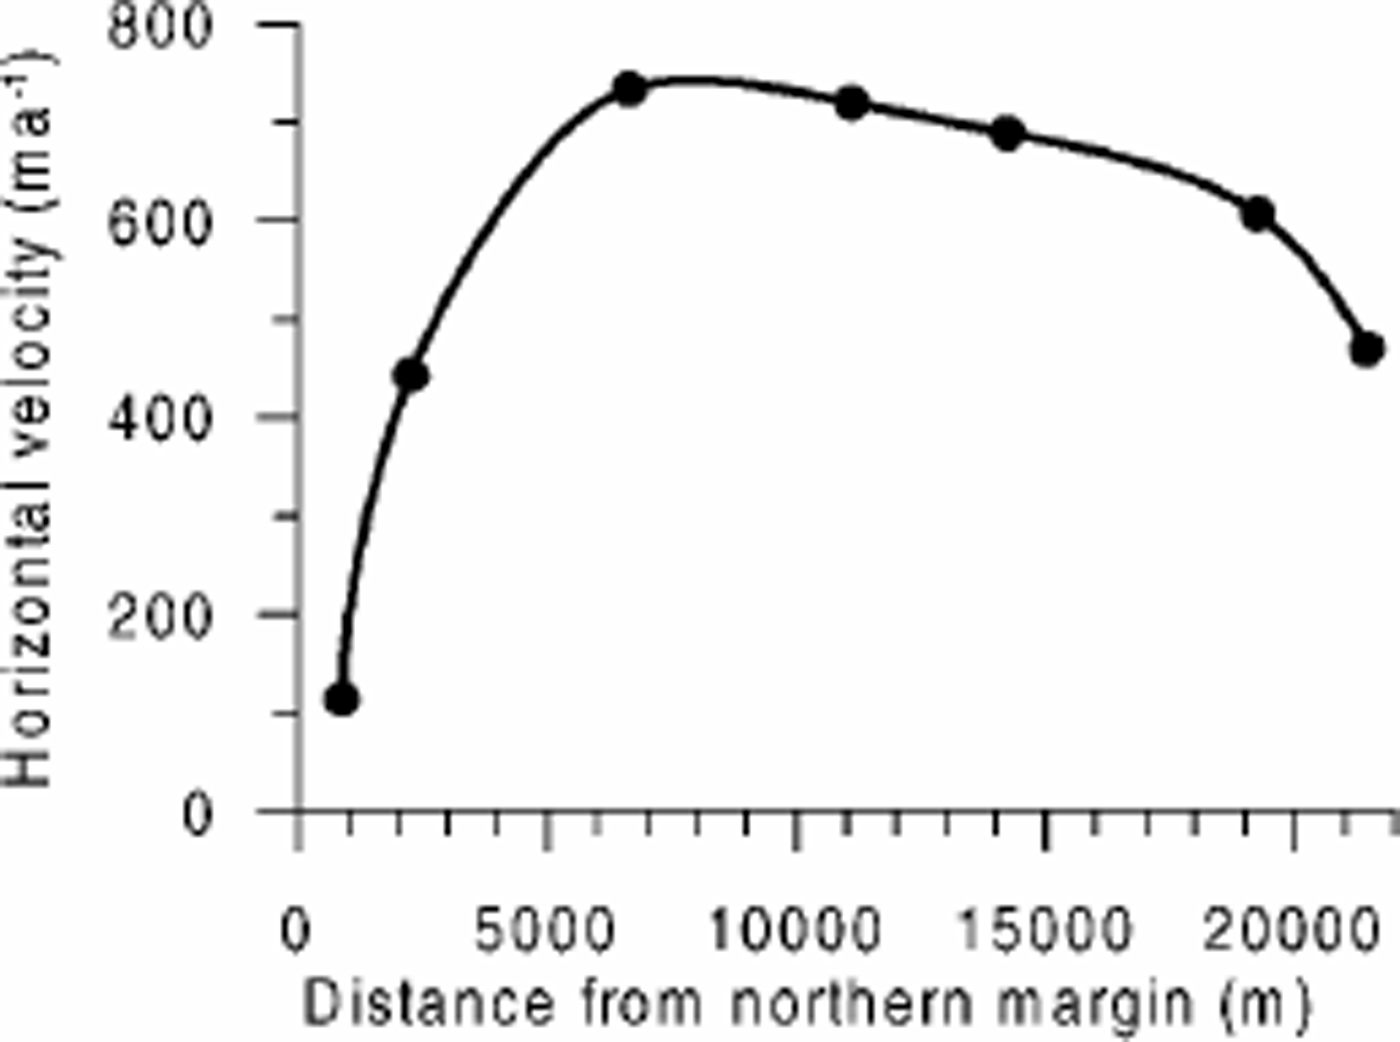
Fig. 2. Horizontal velocity profile measured along the NF profile line on Nioghalvfjerdsfjorden glacier (see Fig. 1).
Five tiltmeters were placed at the northern margin of the glacier between GPS points NF9775 and NF9776 (see Fig. 1). The instruments were distributed over a distance of 2.5 km from the glacier margin to a prominent ice ridge (Midgårdsormen) formed several kilometres upstream in a zone of intense pressure and shear. At the location of the observations, the ridge is afloat.
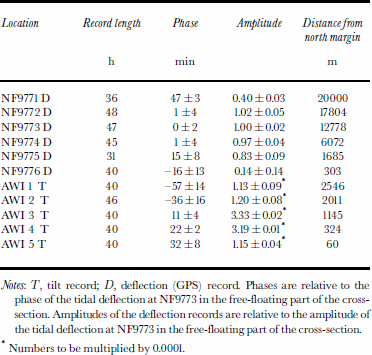
The tidal observation records have been analyzed by cross-spectral analysis (Reference Reeh, Mayer, Olesen, Christensen and ThomsenReeh and others, 2000) using the approach described by Reference Bendat and PiersolBendat and Piersol (1986, ch. 5, 6 and 9). The analysis shows that both amplitude and phase of the tidal deflection at all points, with the exception of points close to the lateral margins, are, within the uncertainty, equal to the amplitude and phase of the local tide measured in the sea at “Syge Moster”. The results of the spectral analysis of the tidal observations are displayed in Table 1. For further details of the tidal observations and the spectral analysis, see Reference Reeh, Mayer, Olesen, Christensen and ThomsenReeh and others (2000).
Table 1. Phase (positive as lag) and amplitude of tidal records measured 15–17 August 1997 in a cross-section of Nioghalvfjerdsfjorden glacier derived by cross-spectral analysis (Reference Reeh, Mayer, Olesen, Christensen and ThomsenReeh and others, 2000)
The internal temperature of the glacier was measured in a borehole located ∼20 km upstream of the cross-profile. The temperature decreased steadily from –8°C at the surface to –20°C at 375 m depth (the bottom of the borehole). The ice thickness at the drill site was ∼450 m.
Notes: T, tilt record; D, deflection (GPS) record. Phases are relative to the phase of the tidal deflection at NF9773 in the free-floating part of the cross-section. Amplitudes of the deflection records are relative to the amplitude of the tidal deflection at NF9773 in the free-floating part of the cross-section.
Rheological Model
Creep tests undertaken at stress and temperature conditions comparable to those occurring in connection with tidal bending of glaciers show that total strain ε is composed of an instantaneous elastic component, and two time-dependent components: the delayed elastic strain and the viscous strain (e.g. Reference GlenGlen, 1955). The simplest rheological model showing this behaviour is a four-element fluid (Reference FluggeFlugge, 1967, p. 22). Assuming glacier ice to be incompressible, the response of this material when subject to a constant deviatoric stress σ' = σ -I p, where σ is stress, p is the mean of the normal stresses, and I is the unit tensor, is

In Equation (1), EM is Young’s modulus, EV and μV are elastic modulus and viscosity, respectively, associated with primary (transient) creep, and μM is viscosity related to steady creep. t is time after loading with the constant stress deviator σ'.
The three contributions to the strain are all significant during the first few hours of a creep test (Reference GlenGlen, 1955; Reference Brill and CampBrill and Camp, 1961), i.e. in an interval comparable to the tidal period during which stresses and deformations in the glacier undergo significant rates of change. It is therefore reasonable to expect that primary and steady creep both influence tidal deflection of glaciers and therefore that a theory of tidal flexure must involve a constitutive equation that accounts for the inelastic components. Creep tests show that the viscosity parameters of Equation (1) are strongly dependent on stress and temperature. This is particularly well documented for the viscosity for steady creep that can be expressed as μM = 1/(2Aτen - 1), where A depends on temperature T, τe is effective shear stress and n ~ 3 (Reference PatersonPaterson, 1994, p. 97 and 259–260). In general, large temperature variations with depth occur in floating glaciers. The surface temperature may be –20°C or lower, and the bottom temperature approaches the freezing point of water. In the tidal flexure zone, the effective stress is composed of a steady contribution τe,s associated with the general glacier flow, and a time-dependent component τe,t related to tidal flexure. Particularly in shear zones along side margins of floating glaciers, τe,s may reach a value of a few hundred kPa, and consequently constitutes a significant, if not the dominant, contribution to τe. In the case of a tidal flexure zone with ice motion across the grounding line, τe,s is likely to be less dominant. Table 2 displays values of μM calculated for a range of T and τe values likely to occur in tidal flexure zones of glaciers. Obviously, such large variations of μM will influence the tidal flexure of the glaciers. A glacier beam theory accounting for stress- and temperature–depthdependent viscosity was developed by Reeh (unpublished). A more elaborate viscoelastic model that approximates various non-linear features was presented by Reference MorlandMorland (1996; see also Reference Mellor and TrydeMellor, 1980). Here, we shall adopt a simple approach, using the linear viscoelastic four-element model with constant material properties to represent the deformation of ice.
Table 2. Viscosity ![]() for steady creep of ice for various values of temperature T and effective stress τe
for steady creep of ice for various values of temperature T and effective stress τe
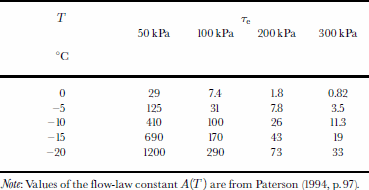
Note: Values of the flow-law constant A (T) are from Reference PatersonPaterson (1994, p. 97).
The numerical values of the material parameters in Equation (1) will be discussed in a later section.
Beam Theory
Neglecting forces of inertia (which are negligibly small for oscillations with the frequency of the tide), the balance of forces acting on a beam element provides two equations
where x is distance along the beam, Q is the transverse force in a cross-section of the beam, n is the transverse load on the beam (positive upwards), and M is the bending moment. For a floating glacier, n = ρwg(a sin ωt - u), where ρ w is density of sea water, g is acceleration due to gravity, a is tidal amplitude, ω is tidal frequency, t is time, and u is the deflection of the beam axis (positive upwards) from the free-floating state as defined by the instantaneous tide. Pressure variations due to the tide-driven flow beneath the glacier are small as compared to the buoyancy term n and are neglected.
A third equation states that the angle of rotation α of a beam element equals the first derivative of the deflection of the beam axis:
A fourth equation is established by relating the curvature of the beam axis, which for infinitesimal deflections is expressed as ∂α/∂x = ∂2u/∂x2 to the bending moment M. The form of this equation depends on the constitutive equation of the beam material. For a linear viscoelastic material, the equation becomes
where
are differential operators (Reference FluggeFlugge, 1967 p.47–48). I is the moment of inertia of the beam cross-section (see Appendix).
Equations (2–5) constitute a set of four linear differential equations for the four unknowns u, α, Q and M. In the case of a beam of an ideal elastic material, deflections, forces and stresses are, at all sections of the beam, in phase with the tidal oscillation. Hence the corresponding time-dependent cyclic components of u, α, Q and M can be eliminated, and a set of four ordinary linear differential equations for the x-dependent parts of u, α, Q and M can be obtained. In the case of a beam of a linear viscoelastic material, the phase of the oscillations of u, α, Q and M will vary along the beam. To account for this, we write

Substitution of these expressions into Equations (2–5) results in a set of eight ordinary linear differential equations for the eight unknown functions uS, uC, αS, αC, QS, QC, MS, MC (see Appendix), that can be solved with standard numerical techniques if an appropriate set of boundary conditions are specified.
The form of the differential operators O and P depends on the specific rheological model used to describe the relationship between stress and deformation of glacier ice. Moreover, the coefficients ok and pk depend on the constraints on stresses and deformations in the horizontal direction transverse to the beam axis. We shall assume plane strain, i.e. zero deformation in the transverse direction.
For the ideal elastic material we have O = 1 and P = (1–ν2)/E, where E is Young’s modulus and ν is Poisson’s ratio.
For the incompressible four-element fluid the differential operators take the form
and
Boundary conditions
For a floating glacier, the boundary conditions at the terminus and at the transition from grounded to floating conditions were discussed by Reeh (unpublished). In the case of a glacier with a vertical front cliff, the transverse force at the front QF is zero. The bending moment of the normal stress deviations from hydrostatic stress is, to first order in the deflection uF, equal to
(Reference ReehReeh unpublished, p. 29), where hF is glacier thickness, di = ρ/ρw and eF is the relative distance from the surface to the beam axis (see Appendix). In the case of uniform depth distributions of the material properties, eF =0.5.
The bending analysis in the transition zone from grounded to floating conditions is complicated by the fact that it involves bending from two different mechanisms (Reference ReehReeh, unpublished, p. 157–159; Reference HoldsworthHoldsworth, 1977): ice motion across the grounding line may give rise to a static “standing” waveform depending on bedrock geometry, which, however, is modified by a dynamic waveform changing with the tide. In the flexure zone along a side margin (i.e. the case of the tidal movement study of Nioghalvfjerdsfjorden glacier), there is no ice motion across the grounding line. In this case, we can neglect the complications and assume the glacier to be fixed at the grounding line (zero deflection and tilt).
Numerical Solution
Instead of the standard analytical approach presented by Hetényi (1946) presupposing uniform ice thickness, a numerical integration procedure is used, which allows account to be taken of non-uniform ice-thickness variations and the finite width of the glacier. The ice-thickness variation is approximated by cubic splines fitted to the thickness profile by a least-squares proceedure.
Theintegrationof the set ofeight lineardifferential equations given in the Appendix is based on the standard Runge– Kutta integration method (Reference Press, Flannery, Teukolsky and VetterlingPress and others, 1989, p. 447). The “shooting method” (Reference Press, Flannery, Teukolsky and VetterlingPress and others, 1989, p.582) is used to solve the two-point boundary-value problem arising from considering the finite width of the glacier. The procedure was checked against the analytical solution for the case of an elastic beam of uniform thickness and infinite length. Deviations between the numerical and analytical solutions were insignificant.
Model Results and Comparison with Observations
It appears from Table 2 that μM depends strongly on temperature T and effective stress τe. A representative value of μM in the northern tidal deflection zone of profile C–C (see Fig. 1) is derived as follows. From Figure 2, the shear strain rate near the northern margin of the profile is found to be -0.15 a–1. Assuming this to be the dominant strain-rate component and using an A value from Reference PatersonPaterson (1994, p. 97) corresponding to –15°C (the average internal ice temperature measured in a borehole 20 km upstream of profile C–C), the marginal shear stress is calculated as τxy ≈ 250 kPa. This shear stress is large as compared to the stress deviators associated with tidal flexure, hence justifying putting τe = τx y = 250 kPa. Table 2 then shows that μM ≈ 20 000–30 000 GPas.
The other material parameters are fixed as follows: EM = 9.3 GPa (Reference Petrenko and WhitworthPetrenko and Whitworth, 1999, p. 40). In creep tests with T = –15°C and effective stresses between 80 and 160 kPa, Reference Brill and CampBrill and Camp (1961) found the material parameters for transient creep to be EV ∼10GPa and μV ∼600 GPa s.
Using these values, the deflection and tilt amplitudes predicted by the four-element viscoelastic tidal flexure model are shown by thick lines in Figure 3a and b, respectively. The deflection amplitudes are standardized to a value 1inthe midpoint of the cross-profile. Thethin lines shown in Figure 3a and b represent results of calculations with a purely elastic model with Young’s modulus = 9.3 GPa. Both sets of model results show a general agreement with the observations (points shown by crosses), although the viscoelastic model gives a slightly better fit to the observed amplitudes. Neither of the modelled deflection curves can, however, reproduce the relatively large amplitude of the observed deflection record at the point located a few hundred metres from the southern ice margin (the righthand side of the figure). Apparently, the no-slip condition used asboundary condition does not apply at this glacier margin, where the contact between glacier and land is an extremely steep rock slope. Some vertical sliding seems to occur either at the rock face itself or in a tidal crack near the rock wall.
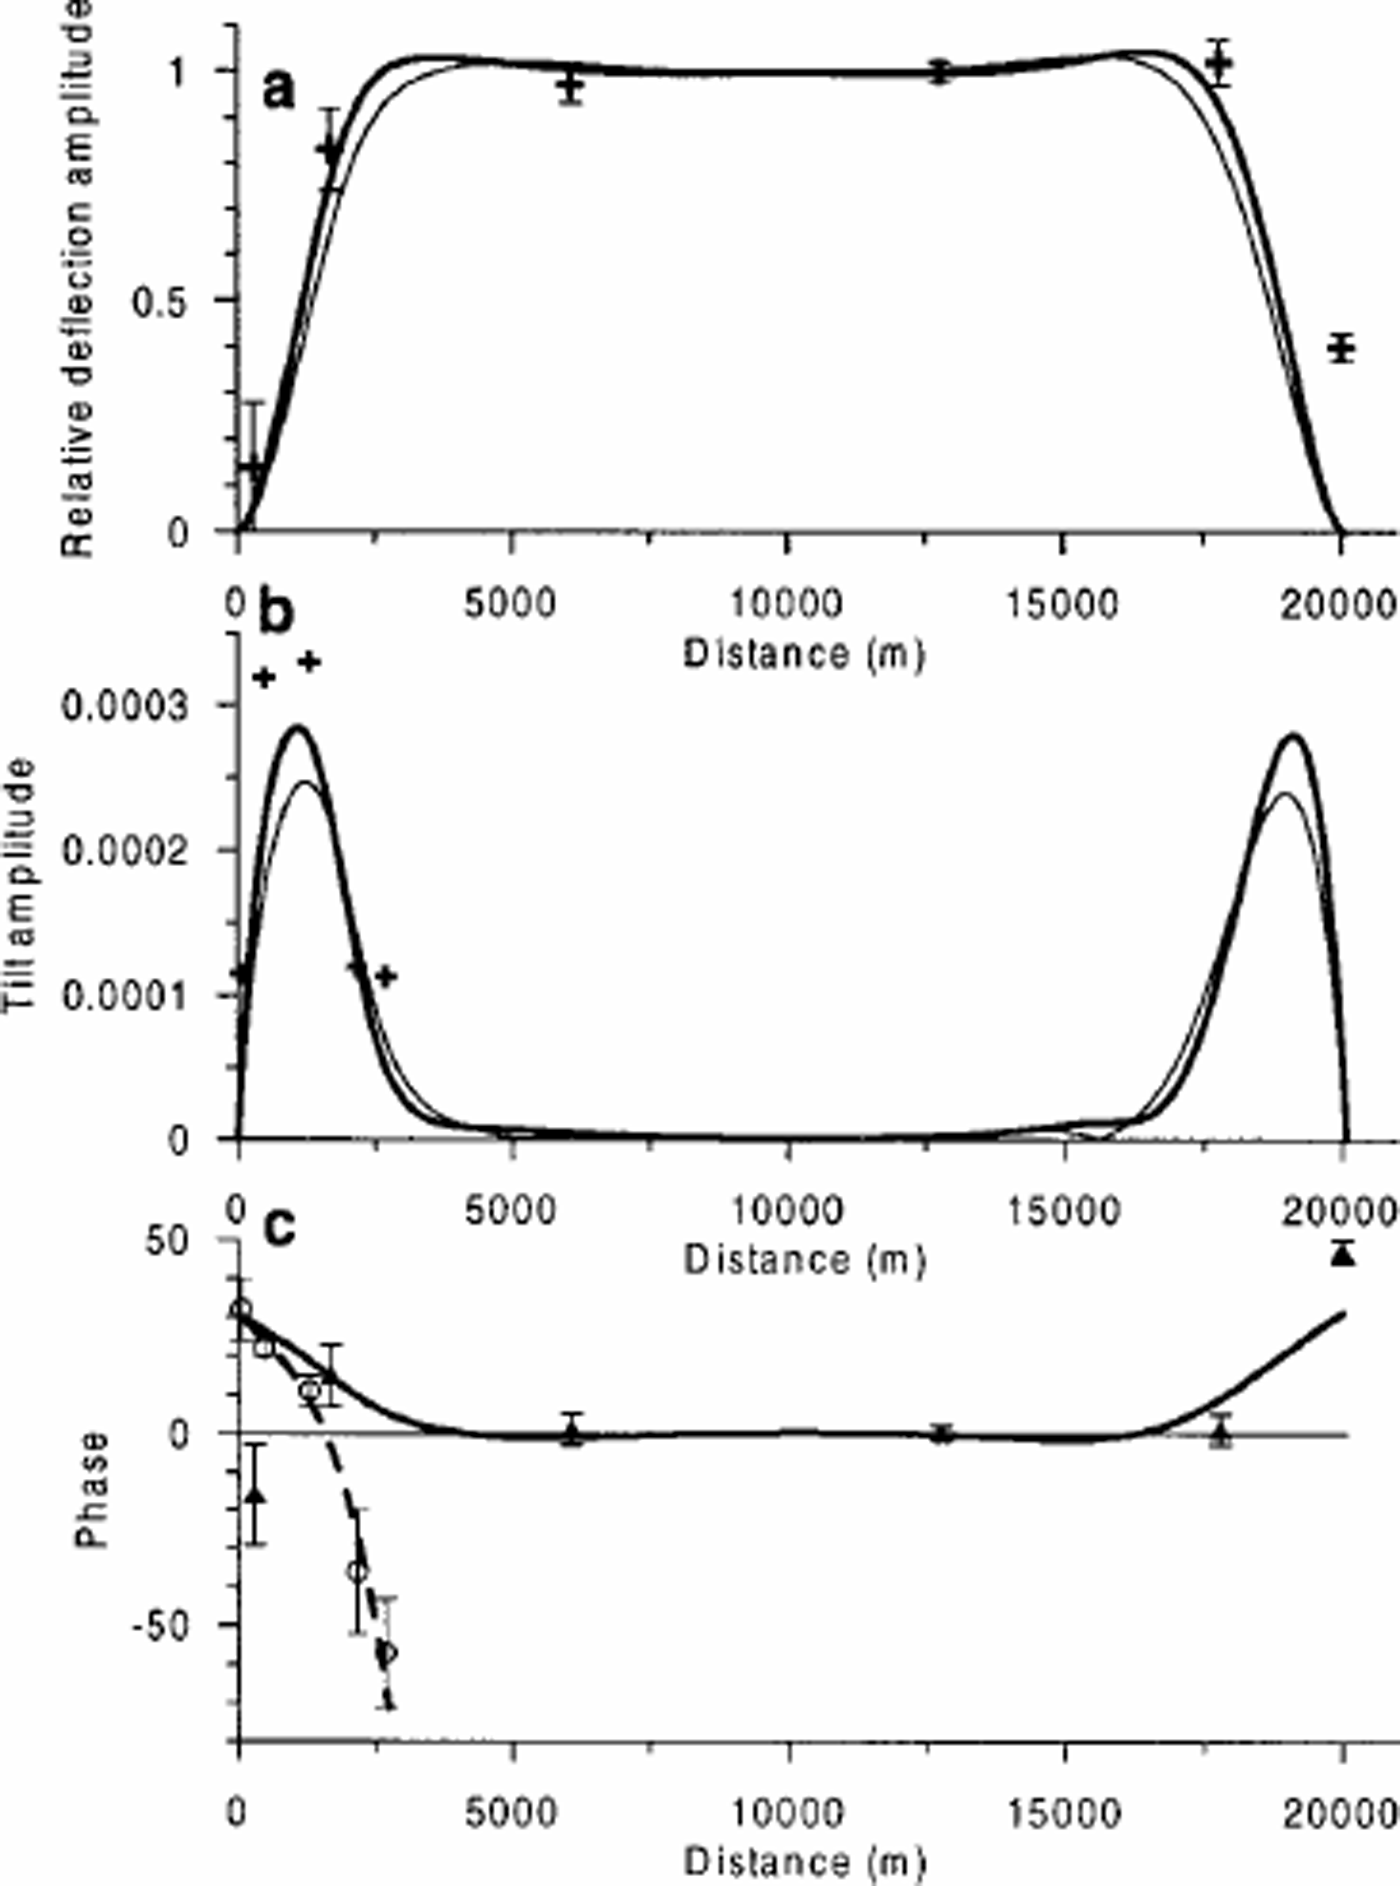
Fig. 3. (a, b) Heavy lines are amplitudes of relative tidal deflection and absolute tilt in a cross-section of Nioghalvfjerdsfjorden glacieras determined by a four-element linear viscoelastic-beam model with material properties as described in the text. The thin lines represent the result of a calculation with an elastic-beam model. Measured values are marked with crosses. Standard errors of the measured deflection amplitudes are also shown. The standard errors of the measured tilt amplitudes are too small to be shown. (c) Phase of the deflection (solid line) and tilt (dashed line) of the tidal motion in a cross-section of Nioghalvfjerdsfjorden glacier as determined by a four-element linear viscoelastic-beam model. The phases obtained with the elastic model are all zero. Phases of observed deflection and tilt records are marked as triangles and open circles, respectively. The phases are adjusted so that the phase of the deflection of point NF9773 is zero.
Turning to the phases of the deflection and tilt records shown in Figure 3c, the superiority of the viscoelastic model becomes evident. The elastic model predicts the deflection and tilt of all points to be in phase with the forcing, i.e. with the tide in the sea, or equivalently, in phase with the deflection in the central part of the glacier. Obviously this is not the case for our observations, which show systematic (and quite different) variations of the phases of the deflection and tilt records that are reasonably well reproduced by the viscoelastic model.
Figure 4 illustrates the tidal deflection curves corresponding to different instants during a half tidal cycle. The deflection curves for the other half of the cycle are mirror images of those shown in Figure 4. It appears that the shape of the deflection curve changes during the tidal cycle. During falling tide with a water level above the mean, and during rising tide with water level below the mean, the curvature of the deflection curve is larger than during the remaining periods of the tidal cycle. Preliminary model results from other tidal flexure zones with different glacier thickness and different temperature and stress conditions implying a different value of μM show that the change in shape of the deflection profile during the tidal cycle can be much larger than shown in Figure 4.
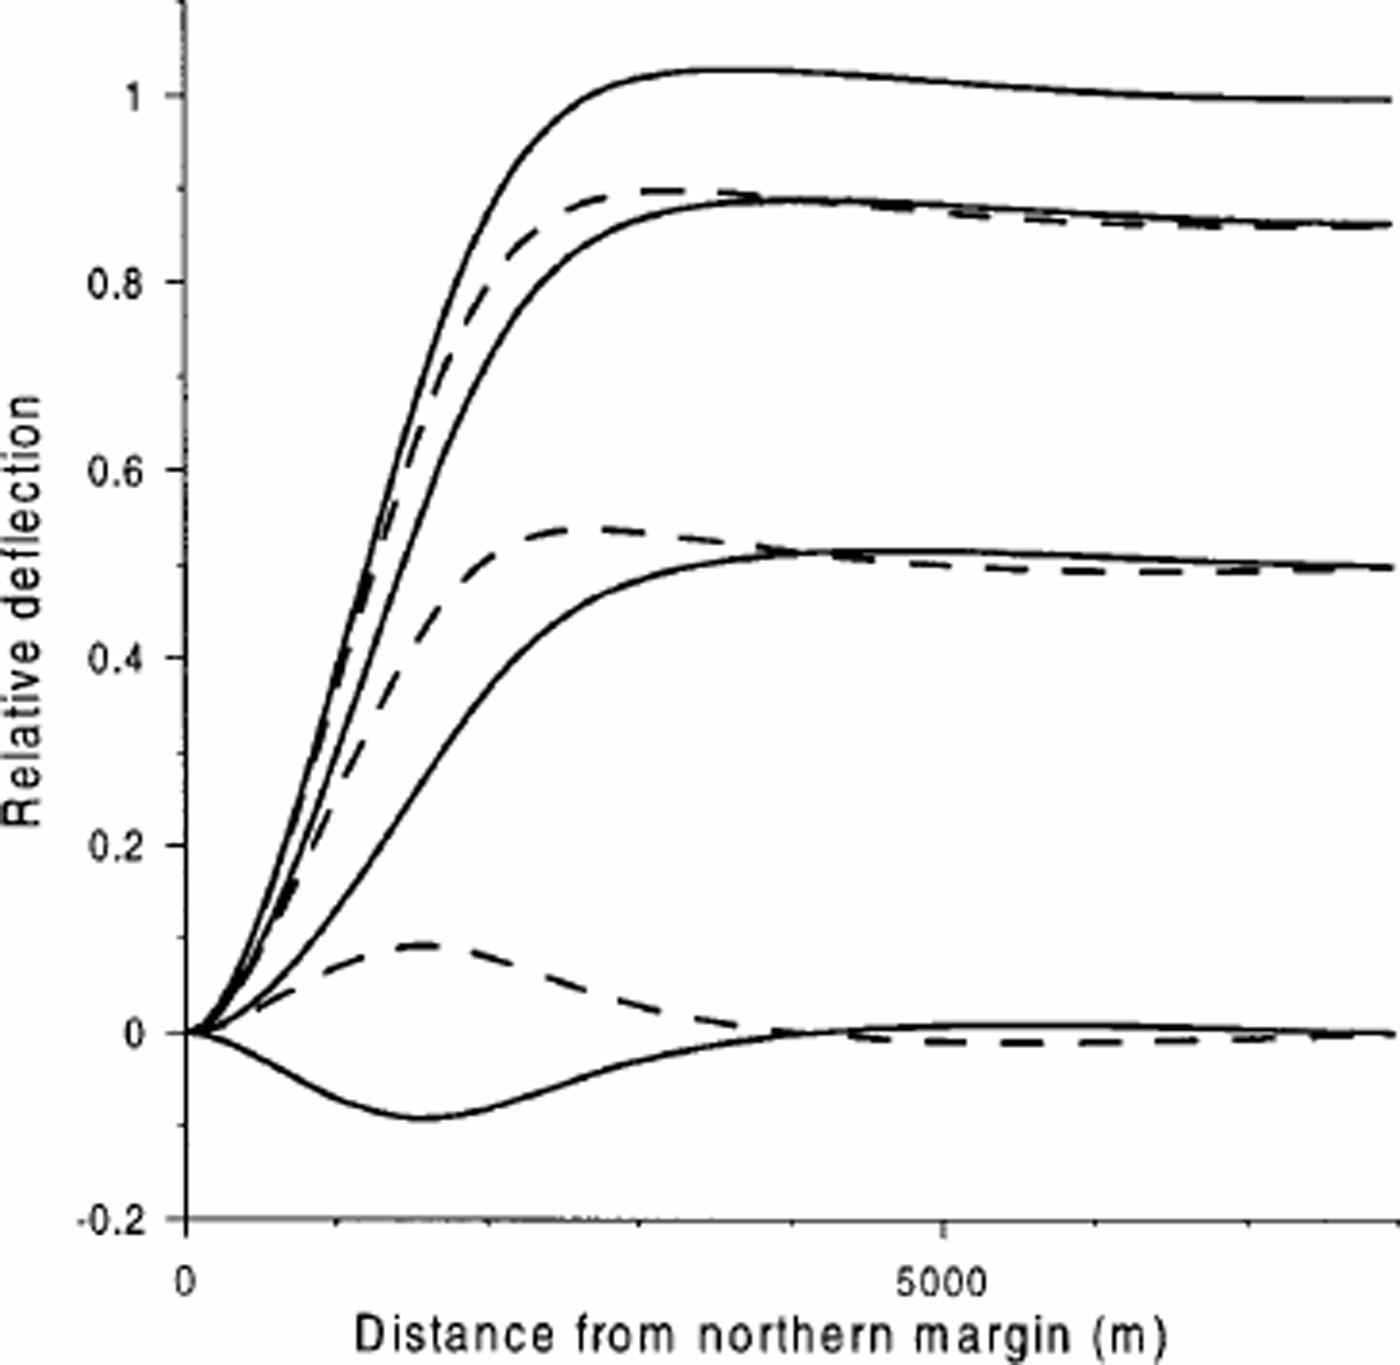
Fig. 4. Tidal deflection curves of the northernmost 8000 m of cross-section C–C of Nioghalvfjerdsfjorden glacier at different instants during a half tidal cycle. The deflection curves are calculated with the viscoelastic four-element model with material parameters as described in the text. The deflection curves for the other half of the cycle are mirror images of those shown in the figure. Solid lines are deflection curves corresponding to rising tide. Dashed lines correspond to falling tide.
Discussion and Conclusion
In contrast to conclusions of earlier studies of tidal flexure of floating glaciers, deflection and tilt data observed simultaneously in a profile across the tidal flexure zone of Nioghalvfjerdsfjorden glacier cannot be adequately described by elastic-beam theory. The inconsistency with elastic theory is most clearly demonstrated by the observation that the phase of the observed deflection and tilt records changes with distance from the grounding line. This was previously pointed out by Reference Reeh, Mayer, Olesen, Christensen and ThomsenReeh and others (2000), who tentatively suggested that the tidal flexure data from Nioghalvfjerdsfjorden glacier might be better described by a viscoelastic-beam model. The present study confirms that a linear viscoelastic-beam model with a reasonable choice of material parameters can explain the observed tidal flexure records. A good fit is achieved by using a four-element rheological model for glacier ice displaying instantaneous elastic response, delayed elastic response, and viscous response. A two-element model which only accounts for the instantaneous elastic and viscous responses also gives a satisfactory fit, although not quite as good a fit as the four-element model. The value of Young’s modulus used in the viscoelastic models is in agreement with the value derived from laboratory measurements of the sound-wave velocity in polycrystalline ice. This is a more satisfactory choice than the 3–10 times lower value of Young’s modulus derived in earlier studies by fitting elastic models to observed tidal deflection patterns of glaciers.
In the present study, no attempt has been made to optimize the fitting of the material properties (e.g. by minimizing the sum of squares of the deviations of model-calculated deflections and tilt from the corresponding observed values). The use of a linear viscoelastic model with constant viscosity to represent the non-linear temperature-and stress-dependent viscosity of ice would make the value of such an optimization questionable. The limited number of phase observations further questions the usefulness of using least-squares optimization of the material properties.
The changing shape of the deflection curve of the glacier with the tide, illustrated in Figure 4, has important implications. Elastic models have in earlier studies been fitted to observed tidal deflection curves of glaciers with the purpose of deriving a value of the elastic damping factor β = 3ρwg (1– ν 2)/(Eh3)1/4 (e.g. Reference VaughanVaughan, 1995). Except for tides close to mean sea level, the tidal deflection curves shown in Figure 4 can, in fact, all be fitted accurately by an elastic model. However, the β value derived from such a fit will depend on the phase of the tide at the time of observation of the deflection curve. This probably explains part of the scatter of the E values calculated in earlier studies from β values derived by fitting observed tidal deflection curves by elastic flexure models.
The changing shape of the deflection curve may also have implications for the procedure used to separate the interferometric phase due to the tidal signal from the interferometric phase due to the long-term steady glacier motion by differencing SAR interferograms (Reference RignotRignot, 1996, Reference Rignot1998b). The procedure presupposes identical shapes of the tidal flexure patterns at the times of acquisition of the different radar images used to form the interferograms. The present study shows that, in general, this is not the case in the tidal flexure zone. A detailed analysis of the problem is in progress and will be published elsewhere.
Acknowledgements
This work was supported by the Commission of the European Communities under contracts EV5V-CT91-0051 and ENV4-CT95-0124. The fieldwork benefited greatly from use of the logistics platform and base camp “Midgårdsormen” run by the Danish Polar Centre near the margin of Nioghalvfjerdsfjorden glacier. Comments by L.W. Morland andananonymous reviewer resulted in significant improvements to the paper.
Appendix
We introduce the abbreviations

The material parameters are explained in connection with Equation (1) of the main paper. I is the moment of inertia of the beam cross-section in respect to the beam axis. If the material parameters are constant, the beam axis is located at a relative depth e = 1/2 below the surface, and I = 1/12 h3. If the material properties vary with depth, a transformation of the cross-section must be performed when calculating e and I (Reference ReehReeh, unpublished, p. 83). This complication is neglected in the present study.
Looking for a harmonic solution to the coupled differential equations (2–5), we write:

Substituting these expression into Equations (2–5), and equating to zero, in each of the equations, the coefficients to respectively sin ωt and cos ωt, we obtain the following set of eight coupled differential equations:


