


1. Introduction
Film flows are found in a wide range of industrial, commercial, residential and natural settings. Industrial applications take advantage of the relatively large heat and mass transfer coefficients associated with film flows, such as their effective use in heat pipes (Kwon, Kwon & Jung Reference Kwon, Kwon and Jung2023) or over structured packings (Trifonov Reference Trifonov2019; Iyer et al. Reference Iyer, Casalinho, Seiwert, Wattiau and Duval2021). Film flows are often employed in commercial and residential situations, for example, when cleaning and disinfecting (Landel & Wilson Reference Landel and Wilson2021) or cooking (Boujo & Sellier Reference Boujo and Sellier2019). The natural environment includes numerous occurrences of film flows, whether in geological formation (Ledda et al. Reference Ledda, Balestra, Lerisson, Scheid, Wyart and Gallaire2021) or avalanche development (Li et al. Reference Li, Sovilla, Gray and Guame2024), and biological systems rely upon their behaviour, for instance, prey fluid flowing along the deutosternal grooves on mites (Wernz & Krantz Reference Wernz and Krantz1976; Flechtmann, Evans & McMurtry Reference Flechtmann, Evans and McMurtry1994; Bowman Reference Bowman2023), oxygen absorption within lung passageways (Si & Xi Reference Si and Xi2022), tear development atop the eye surface (Mehdaoui et al. Reference Mehdaoui, Abderrahmane, Bouda, Koulali and Hamani2021), or liquid transport across leaves (Glass et al. Reference Glass, Walters, Gaskell, Lee, Thompson, Emerson and Gu2010). In many of these cases, the film flow is impacted by its interaction with the topography of the underlying substrate. This topography can incorporate isolated, non-uniform, or periodic structure that is either purposefully implemented or indirectly existent, and the effects on the film flow must often be addressed. Film flow over planar substrates, both with and without topography, has attracted significant attention in an attempt to understand both the steady and unsteady film flow behaviour (Craster & Matar Reference Craster and Matar2009; Kalliadasis et al. Reference Kalliadasis, Ruyer-Quil, Scheid and Velarde2012; Aksel & Schörner Reference Aksel and Schörner2018). Despite the substantial amount of findings, investigations continue to expand the understanding of planar film flow, in particular its interaction with isolated disturbances (Singh & Tiwari Reference Singh and Tiwari2024; D’Alessio Reference D’Alessio2024) and periodic topography (Al-Shamaa, Kahraman & Wierschem Reference Al-Shamaa, Kahraman and Wierschem2023).
In comparison, film flow in circular pipe geometries has received less attention, even though a notable number of applications exist in pipeline transport or similarly curved geometry. Investigations of film flow along circular geometry without topography have been conducted, such as the flow along the interior or exterior of a vertical circular pipe (Roy, Roberts & Simpson Reference Roy, Roberts and Simpson2002; Lister et al. Reference Lister, Rallison, King, Cummings and Jensen2006; King et al. Reference King, Cummings, Naire and Jensen2007; Camassa & Ogrosky Reference Camassa and Ogrosky2015; Ma et al. Reference Ma, Hu, Dong and Li2020; Camassa et al. Reference Camassa, Marzuola, Ogrosky and Swygert2021, Reference Camassa, Marzuola, Ogrosky and Vaughn2016), along a wire (Kalliadasis & Chang Reference Kalliadasis and Chang1994; Kliakhandler, Davis & Bankoff Reference Kliakhandler, Davis and Bankoff2001; Gabbard & Bostwick Reference Gabbard and Bostwick2021), within a funnel (Lin, Dijksman & Kondic Reference Lin, Dijksman and Kondic2021; Xue & Stone Reference Xue and Stone2021), or between vertical pipes (Wang et al. Reference Wang, Chen, Lin, Zhang and Chen2020). These investigations reveal that film flow behaviour within circular geometries differs in some ways from that found over planar substrates, such as the formation of collars and lobes along the film (Lister et al. Reference Lister, Rallison, King, Cummings and Jensen2006). The importance of topography along circular substrates is highlighted by its existence in applications such as bearing chambers (Eastwick, Bertin & Johnson Reference Eastwick, Bertin and Johnson2006, Reference Eastwick, Huebner, Azzopardi, Simmons, Young and Morrison2005; Kneer et al. Reference Kneer, Eastwick, Müller, Johnson, Robinson and Bauer2008; Li, Li & Wang Reference Li, Li and Wang2022) or falling film evaporators (Åkesjö et al. Reference Åkesjö, Gourdon, Jongsma and Sasic2023). Recently, gravity-driven film flow inside corrugated circular pipes was investigated to document and examine the characteristics of travelling waves specific to curved topographies (Kuehner, Mitchell & Lee Reference Kuehner, Mitchell and Lee2019; Kuehner et al. Reference Kuehner, Lee, Dodson, Schirmer, Vela de la Garza Evia and Kutelak2021; Kuehner Reference Kuehner2022). Beyond these corrugated circular pipe studies, the only other known film flow study over circular pipe substrates incorporating topography is for the exterior flow along a cylinder with a discontinuity in pipe radius (Khayat, Kim & Delosquer Reference Khayat, Kim and Delosquer2004). Additional work in circular geometries with topography will broaden the limited scope of available findings, further delineate the aspects of film flow in circular geometries that are not observed in planar cases, and potentially determine the phenomena that lead to these distinctions.
Film flow over planar substrates with isolated topography received early attention due to the importance of substrate defects on spin coating processes (Stillwagon & Larson Reference Stillwagon and Larson1990). Subsequent investigation of film flow over two-dimensional (2-D) planar step down topography indicated that the film develops a capillary ridge just prior to the step down for conditions in which surface tension is relevant and forms a depression in the free surface upstream of the capillary ridge as the angle of inclination of the substrate increases (Aksel Reference Aksel2000). The capillary ridge is of primary importance in studying film flow response to isolated topography as it often represents the most prominent departure from upstream film thickness. The capillary ridge develops a favourable pressure gradient that drives the film around the corner of the step down topography (Mazouchi & Homsy Reference Mazouchi and Homsy2001) and is associated with the formation of a separation eddy on the downstream face of the step (Gaskell et al. Reference Gaskell, Jimack, Sellier, Thompson and Wilson2004b ; Bontozoglou & Serifi Reference Bontozoglou and Serifi2008) or eddies within a rectangular trough (Scholle, Gaskell & Marner Reference Scholle, Gaskell and Marner2019). The elevation of the capillary ridge depends on the step height (Scholle et al. Reference Scholle, Gaskell and Marner2019; Kalliadasis, Bielarz & Homsy Reference Kalliadasis, Bielarz and Homsy2000; Mazouchi & Homsy Reference Mazouchi and Homsy2001), angle of inclination (Pal, Sanyasiraju & Usha Reference Pal, Sanyasiraju and Usha2021) and surface tension (Mazouchi & Homsy Reference Mazouchi and Homsy2001; Ovcharova Reference Ovcharova2006). For some flow conditions, a series of capillary waves can develop upstream of the capillary ridge as the film approaches a step down (Kalliadasis et al. Reference Kalliadasis, Bielarz and Homsy2000) or a rectangular trough (Pal et al. Reference Pal, Sanyasiraju and Usha2021). These capillary features, as well as similar depressions in film thickness and capillary waves downstream of a step down, have been observed in other numerical (Kalliadasis et al. Reference Kalliadasis, Bielarz and Homsy2000; Mazouchi & Homsy Reference Mazouchi and Homsy2001; Bielarz & Kalliadasis Reference Bielarz and Kalliadasis2003; Decré & Baret Reference Decré and Baret2003; Gaskell et al. Reference Gaskell, Jimack, Sellier, Thompson and Wilson2004b ; Davis & Troian Reference Davis and Troian2005; Bontozoglou & Serifi Reference Bontozoglou and Serifi2008; Veremieiev et al. Reference Veremieiev, Thompson, Lee and Gaskell2010; Scholle et al. Reference Scholle, Gaskell and Marner2019; Pal et al. Reference Pal, Sanyasiraju and Usha2021, Reference Pal, Sanyasiraju and Usha2022) and experimental (Baret & Decré Reference Baret and Decré2000; Decré & Baret Reference Decré and Baret2003) investigations of 2-D planar step down or rectangular trough topographies, as well as over planar rectangular slits (Pettas et al. Reference Pettas, Karapetsas, Dimakopoulos and Tsamopoulos2017). The downstream location of the capillary ridge varies with surface tension, inclination angle and flow rate (Aksel Reference Aksel2000; Bontozoglou & Serifi Reference Bontozoglou and Serifi2008), and the streamwise length of the capillary ridge scales with the capillary number (Mazouchi & Homsy Reference Mazouchi and Homsy2001; Bontozoglou & Serifi Reference Bontozoglou and Serifi2008). Once formed, these free surface features are stable to disturbance (Kalliadasis & Homsy Reference Kalliadasis and Homsy2001; Bielarz & Kalliadasis Reference Bielarz and Kalliadasis2003; Davis & Troian Reference Davis and Troian2005); hence the steady-state free surface elevation profile retains importance even for unsteady flow conditions as the steady features remain after transient disturbances pass.
For film flow over a 2-D planar step up, the film develops a capillary ridge that precedes a decrease in film thickness before the film rises over the step (Fernandez Parent, Lammers & Decré Reference Fernandez Parent, Lammers and Decré1998; Decré et al. Reference Decré, Fernandez-Parent, Lammers, Durst and Raszillier1999; Lucéa et al. Reference Lucéa, Decré and Lammers1999; Baret & Decré Reference Baret and Decré2000; Mazouchi & Homsy Reference Mazouchi and Homsy2001; Decré & Baret Reference Decré and Baret2003; Gaskell et al. Reference Gaskell, Jimack, Sellier, Thompson and Wilson2004b ; Bontozoglou & Serifi Reference Bontozoglou and Serifi2008; Scholle et al. Reference Scholle, Gaskell and Marner2019; Pal et al. Reference Pal, Sanyasiraju and Usha2021, Reference Pal, Sanyasiraju and Usha2022), and these free surface features have similar dependencies on flow geometry and fluid properties as found for film flow over a step down. The curvature of the free surface develops to overcome the adverse pressure gradient that develops as the film is forced up over the step, and is again related to the existence of separation eddies near the corners of the topography (Bontozoglou & Serifi Reference Bontozoglou and Serifi2008). For film flow over a 2-D obstacle, the film thickness tends to decrease before forming a capillary ridge just prior to the obstacle (Bonart & Repke Reference Bonart and Repke2018; Kalliadasis et al. Reference Kalliadasis, Bielarz and Homsy2000; Pal et al. Reference Pal, Sanyasiraju and Usha2022), in contrast to the flow over a step up. However, similar to the step up, flow over an obstacle is also affected by the formation of eddies upstream and downstream of the obstacle (Higdon Reference Higdon1985; Hansen Reference Hansen1991). As found for the step down and rectangular trough topographies, the importance of surface tension is again noted for film flow over obstacles. While surface tension must exist to form the capillary features along the free surface, as surface tension continues to increase, it acts to eventually flatten and smooth the free surface over the obstacle (Hansen Reference Hansen, Tanaka and Brebbia1986, Reference Hansen1991; Kalliadasis et al. Reference Kalliadasis, Bielarz and Homsy2000).
For film flows in many natural settings, such as for shallow rivers or for glacial movement, it is uncommon to know the substrate topography a priori; hence it is advantageous to be able to deduce the topography along a river bed or atop the bedrock supporting a glacier from the flow response to the topography. Analytical and numerical approaches have been applied to determine the substrate topography from the free surface shape (Sellier Reference Sellier2008; Sellier & Panda Reference Sellier and Panda2010) or from the free surface flow velocity (Heining, Pollak & Sellier Reference Heining, Pollak and Sellier2013; Heining & Sellier Reference Heining and Sellier2017), both of which are more readily measured in the field. These analytical and numerical methods can then be employed by those designing substrates for industrial applications to produce a desired coating response (Sellier Reference Sellier2008; Sellier & Panda Reference Sellier and Panda2010). In addition, as substrate topography can modify the manner in which instabilities form, such as rivulets (Slade et al. Reference Slade, Veremieiev, Lee and Gaskell2013), these inverse methods afford the designer another means of enhancing heat or mass transfer by purposely inducing instabilities. The development of inverse methods is informed and validated by investigations into film flow behaviour over known topography, highlighting the importance of continued investigation of film flows in circular pipe geometries for which inverse methods have yet to be developed.
The response of film flow to isolated substrate topography was expanded to include three-dimensional (3-D) geometry such as trenches and obstacles that have a finite width. For numerical simulations of film flow over 3-D obstacles, the film develops a capillary ridge over the obstacle, with a depression just prior to the obstacle (Hayes, O’Brien & Lammers Reference Hayes, O’Brien and Lammers2000; Bielarz & Kalliadasis Reference Bielarz and Kalliadasis2003; Gaskell et al. Reference Gaskell, Jimack, Sellier, Thompson and Wilson2004b ; Blyth & Pozrikidis Reference Blyth and Pozrikidis2006; Baxter et al. Reference Baxter, Power, Cliffe and Hibberd2009; Veremieiev et al. Reference Veremieiev, Thompson, Lee and Gaskell2011, Reference Veremieiev, Thompson and Gaskell2015) similar to film flow response to 2-D obstacles. The capillary ridge extends around the sides of the 3-D obstacle, forming a horseshoe shape, and the results afford a perspective of the horseshoe wake that forms around a depression in film thickness axially downstream of the obstacle (Blyth & Pozrikidis Reference Blyth and Pozrikidis2006; Baxter et al. Reference Baxter, Power, Cliffe and Hibberd2009; Gaskell et al. Reference Gaskell, Jimack, Sellier, Thompson and Wilson2004b , Reference Gaskell, Thompson, Veremieiev, Eberhardsteiner, Böhm and Rammerstorfer2012). The existence of these features depends upon the thickness of the film in comparison to the height of the obstacle and whether inertia is considered in the analysis (Pozrikidis & Thoroddsen Reference Pozrikidis and Thoroddsen1991; Peurrung & Graves Reference Peurrung and Graves1993). Additionally, the features are modified if the film is volatile and dries while forming (Peurrung & Graves Reference Peurrung and Graves1991). Similar to the film response to 2-D planar topography, as surface tension increases, the elevation of the capillary ridge upstream of the 3-D obstacle decreases (Pozrikidis & Thoroddsen Reference Pozrikidis and Thoroddsen1991; Blyth & Pozrikidis Reference Blyth and Pozrikidis2006), and the balance between angle of inclination and the magnitude of surface tension determines whether the capillary ridge forms at all (Gaskell et al. Reference Gaskell, Jimack, Sellier, Thompson and Wilson2004b ; Scholle et al. Reference Scholle, Gaskell and Marner2019).
Film flow over a 3-D rectangular trough produces a free surface with a capillary ridge just prior to the trough that wraps around the side of the trough in a horseshoe shape referred to as a bow wave (Lucéa et al. Reference Lucéa, Decré and Lammers1999; Decré & Baret Reference Decré and Baret2003; Bielarz & Kalliadasis Reference Bielarz and Kalliadasis2003; Gaskell et al. Reference Gaskell, Jimack, Sellier, Thompson and Wilson2004b , Reference Gaskell, Thompson, Veremieiev, Eberhardsteiner, Böhm and Rammerstorfer2012; Lee, Thompson & Gaskell Reference Lee, Thompson and Gaskell2007; Veremieiev et al. Reference Veremieiev, Thompson, Lee and Gaskell2010; Cowling et al. Reference Cowling, Gaskell, Lee and Thompson2011; Veremieiev, Thompson & Gaskell Reference Veremieiev, Thompson and Gaskell2015; Pal et al. Reference Pal, Sanyasiraju and Usha2021, Reference Pal, Sanyasiraju and Usha2022; D’Alessio Reference D’Alessio2024). The film rises into a second ridge at the outlet of the trough because fluid enters the trough over the upstream and side edges, while only exiting the trough along the downstream edge (Gaskell et al. Reference Gaskell, Jimack, Sellier, Thompson and Wilson2004b ). The difference between inlet and outlet flow areas can lead to the outlet ridge being as or more prominent than the capillary ridge that precedes the topography (Decré & Baret Reference Decré and Baret2003; Gaskell et al. Reference Gaskell, Jimack, Sellier, Thompson and Wilson2004b ; Lee et al. Reference Lee, Thompson and Gaskell2007; Cowling et al. Reference Cowling, Gaskell, Lee and Thompson2011; Pal et al. Reference Pal, Sanyasiraju and Usha2021, Reference Pal, Sanyasiraju and Usha2022). If the rectangular trough is wide enough in the spanwise direction, the outlet ridge can split into two separate ridges (Gaskell et al. Reference Gaskell, Jimack, Sellier, Thompson and Wilson2004b ; Veremieiev et al. Reference Veremieiev, Thompson, Lee and Gaskell2010; Pal et al. Reference Pal, Sanyasiraju and Usha2021, Reference Pal, Sanyasiraju and Usha2022), further indicating the relevance of inlet to outlet area for flow through the trough. Film flows over troughs with different 3-D cross-sectional shapes, such as circular or diamond troughs, produce film flow responses similar to those of the rectangular trough (Lucéa et al. Reference Lucéa, Decré and Lammers1999; Lee et al. Reference Lee, Thompson and Gaskell2007). In agreement with the findings for 2-D planar cases, the free surface features caused by isolated 3-D troughs are stable to inlet disturbances (Lee et al. Reference Lee, Thompson and Gaskell2007) and are dependent upon the vortex structure that forms in the trough (Gaskell et al. Reference Gaskell, Thompson, Veremieiev, Eberhardsteiner, Böhm and Rammerstorfer2012; Veremieiev, Thompson & Gaskell Reference Veremieiev, Thompson and Gaskell2012). Owing to the horseshoe capillary ridge and wake structure, the film flow over isolated 3-D troughs produces capillary effects that are sustained further downstream than is found for the corresponding 2-D planar geometries (Decré & Baret Reference Decré and Baret2003; Gaskell et al. Reference Gaskell, Jimack, Sellier, Thompson and Wilson2004b ).
Beyond film flow over topography, planar film flow around occlusions has also been examined. As occlusions can be used to divert natural film flows, such as for lava or avalanches, understanding the response of a film flow to occlusions can reveal important design considerations (Hinton, Hogg & Huppert Reference Hinton, Hogg and Huppert2019). Investigations of films interacting with 3-D occlusions have included isolated circular, elliptical or square cylinders as well as collections of cylinders (Kneer et al. Reference Kneer, Eastwick, Müller, Johnson, Robinson and Bauer2008; Lee, Thompson & Gaskell Reference Lee, Thompson and Gaskell2008; Gaskell, Lee & Thompson Reference Gaskell, Lee and Thompson2010; Veremieiev et al. Reference Veremieiev, Thompson, Lee and Gaskell2011; Hinton et al. Reference Hinton, Hogg and Huppert2020b ). Film flow around corners is also examined in the same manner (Hinton et al. Reference Hinton, Hogg and Huppert2020a ; Jensen, Chini & King Reference Jensen, Chini and King2004). The isolated topography applied within the circular pipe geometry of the current work presents a substrate that incorporates both 2-D and 3-D planar film flow considerations, as the film along the pipe centreline must navigate over the centreline crests in the topography, and the film along the circumferential edge of the film must flow around the radial edge of each crest. Hence the observations for film flow over 2-D and 3-D planar obstacles and troughs are as relevant to the current findings as investigations of planar film flow around 3-D occlusions.
Another relevant class of film flows is that of a film spreading over a substrate with or without topography. These types of spreading films are typically examined in the context of coating technologies, such as spin coating; however, the unsteady behaviour of a moving contact line remains indirectly related to the transient response of film flows in circular pipes with isolated topography. In particular, if the circumferential extent of the free surface varies in time, then the edges of the film continually progress and recede along the substrate topography, approximating an oscillating contact line. Unsteady, periodic movement of the film flow in corrugated circular pipes has been documented (Kuehner et al. Reference Kuehner, Mitchell and Lee2019, 2021; Kuehner Reference Kuehner2022); hence similar spreading motions might exist in the present film flow. Transient spreading of films or droplets is a typical contact line problem that is examined with (Glass et al. Reference Glass, Walters, Gaskell, Lee, Thompson, Emerson and Gu2010) or without (Bertozzi & Brenner Reference Bertozzi and Brenner1997; Gramlich, Mazouchi & Homsy Reference Gramlich, Mazouchi and Homsy2004; Gaskell et al. Reference Gaskell, Jimack, Sellier and Thompson2004a ; Mazouchi, Gramlich & Homsy Reference Mazouchi, Gramlich and Homsy2004; Lee, Thompson & Gaskell Reference Lee, Thompson and Gaskell2011; Mazloomi & Moosavi Reference Mazloomi and Moosavi2012, Reference Mazloomi and Moosavi2013; Lampropoulos, Dimakopoulos & Tsamopoulos Reference Lampropoulos, Dimakopoulos and Tsamopoulos2016; Karapetsas et al. Reference Karapetsas, Lampropoulos, Dimakopoulos and Tsamopoulos2017; Singh & Tiwari Reference Singh and Tiwari2024) the effects of evaporation. Of relevance to the current work is the capillary ridge that forms at the leading edge of these spreading films, and its interaction with topography (Gramlich et al. Reference Gramlich, Mazouchi and Homsy2004; Mazouchi et al. Reference Mazouchi, Gramlich and Homsy2004; Mazloomi & Moosavi Reference Mazloomi and Moosavi2012, Reference Mazloomi and Moosavi2013; Lampropoulos et al. Reference Lampropoulos, Dimakopoulos and Tsamopoulos2016; Karapetsas et al. Reference Karapetsas, Lampropoulos, Dimakopoulos and Tsamopoulos2017).
One of the key findings in gravity-driven film flow in corrugated circular pipes was the formation of periodic travelling waves that arise from ambient sources (Kuehner et al. Reference Kuehner, Mitchell and Lee2019, 2021; Kuehner Reference Kuehner2022). In comparison to that found for film flow over 2-D planar corrugations (Vlachogiannis & Bontozoglou Reference Vlachogiannis and Bontozoglou2002; Argyriadi, Vlachogiannis & Bontozoglou Reference Argyriadi, Vlachogiannis and Bontozoglou2006; Plumerault, Astruc & Thual Reference Plumerault, Astruc and Thual2010; Cao, Vlachogiannis & Bontozoglou Reference Cao, Vlachogiannis and Bontozoglou2013), an increased robustness of the process that generates travelling waves from ambient sources was demonstrated through a lack of frequency dependence on flow rate or inclination angle (Kuehner et al. Reference Kuehner, Mitchell and Lee2019). The corrugated circular pipe findings provide a motivating factor for pursuing the current work, namely to understand whether there are flow features that develop from isolated topography in circular pipes that could be involved in the resonance that leads to periodic travelling waves when the isolated topography is periodically repeated as corrugations. Previous planar investigations have highlighted how planar film flow responds to a patterned surface, such as a circuit structure, for which the free surface develops as a combination of flow features identified for the film encountering isolated circuit elements (Lee et al. Reference Lee, Thompson and Gaskell2008). Similarly, the manner in which a film proceeds over two obstacles on a planar substrate incorporates the features of the film response to isolated obstacles while including capillary features that do not exist for the isolated obstacles (Pritchard, Scott & Tavener Reference Pritchard, Scott and Tavener1992). Film flow response to groupings of 3-D troughs further demonstrates how the surface features generated by isolated topography can be incorporated into the film response to patterned topography, yet features not seen in the isolated cases also appear (Lee et al. Reference Lee, Thompson and Gaskell2007). Hence results for planar topography further motivate the current work and indicate that the findings for isolated topography in circular pipes might expand on the understanding of the film flow response to corrugated circular pipes.
Therefore, we aim to examine whether step down and single trough substrate geometries in circular pipes generate a film flow response that is unique in comparison to the planar cases, and to investigate whether the film response to isolated topography could potentially contribute to the distinctive periodic behaviour seen in corrugated circular pipes. In the present paper, we describe the geometry and fabrication of the circular pipes with isolated topography, as well as the fluorescence imaging and analysis methods in § 2. The results of the film flow measurements, including the time-averaged and transient features of the free surface, are analysed and discussed in comparison to film flow over planar substrates and corrugated circular pipes in § 3, and the conclusions from the findings are summarized in § 4.
2. Experimental facilities and methods
A schematic representation of the experimental set-up is presented in figure 1 for the case of the film flow in a circular pipe encountering a rectangular step down, which occurs as a discontinuity in pipe radius. The water delivery system is similar to that used in our previous work (Kuehner et al. Reference Kuehner, Mitchell and Lee2019, 2021; Kuehner Reference Kuehner2022) in which water is pumped from a large lower reservoir (not shown in figure 1) into an overflow reservoir. As the water exits the overflow reservoir, it is guided into the circular pipe by a short, curved plastic sheet. The volume flow rate
 $Q$
, ranging between
$Q$
, ranging between
 $0.116$
lpm and
$0.116$
lpm and
 $0.210$
lpm, is measured just prior to the overflow reservoir using a variable-area flow meter with uncertainty
$0.210$
lpm, is measured just prior to the overflow reservoir using a variable-area flow meter with uncertainty
 $0.01$
lpm. We utilize a selection of volume flow rates similar to those in our previous work to better permit comparison to those results. Due to the curvature of the pipe, the thin film of water flows axially downwards along a narrow central portion of the pipe before reaching the isolated topography. Hence the incoming spanwise width of the free surface, approximately
$0.01$
lpm. We utilize a selection of volume flow rates similar to those in our previous work to better permit comparison to those results. Due to the curvature of the pipe, the thin film of water flows axially downwards along a narrow central portion of the pipe before reaching the isolated topography. Hence the incoming spanwise width of the free surface, approximately
 $13$
–
$13$
–
 $16$
mm, is far less than typically studied in 2-D or 3-D planar cases (Leontidis et al. Reference Leontidis, Vatteville, Vlachogiannis, Andritsos and Bontozoglou2010). The schematic includes a representation of the film surface rising through a capillary ridge near the topography. For the cases of the step down topographies, the water spreads in the circumferential direction at the bottom of the topography before again forming a narrow film that flows axially towards the exit of the pipe. For the trough topographies, the water fills the trough, widening the film surface in the spanwise direction beyond the circumferential spreading for the step down topographies, before again forming a narrow stream. The water that leaves the pipe is guided into the lower reservoir using flexible sheeting (not shown in figure 1) to reduce the effects of the impact on the free surface of the lower reservoir. The water in the closed-loop system is permitted to reach thermal equilibrium with the lab environment for at least
$16$
mm, is far less than typically studied in 2-D or 3-D planar cases (Leontidis et al. Reference Leontidis, Vatteville, Vlachogiannis, Andritsos and Bontozoglou2010). The schematic includes a representation of the film surface rising through a capillary ridge near the topography. For the cases of the step down topographies, the water spreads in the circumferential direction at the bottom of the topography before again forming a narrow film that flows axially towards the exit of the pipe. For the trough topographies, the water fills the trough, widening the film surface in the spanwise direction beyond the circumferential spreading for the step down topographies, before again forming a narrow stream. The water that leaves the pipe is guided into the lower reservoir using flexible sheeting (not shown in figure 1) to reduce the effects of the impact on the free surface of the lower reservoir. The water in the closed-loop system is permitted to reach thermal equilibrium with the lab environment for at least
 $24$
hours prior to data collection, and the flow system is operated for at least
$24$
hours prior to data collection, and the flow system is operated for at least
 $20$
minutes prior to data collection to ensure that the supply system has reached steady-state conditions. Similar to our prior experiment (Kuehner Reference Kuehner2022), we focus on two angles of inclination for the circular pipe,
$20$
minutes prior to data collection to ensure that the supply system has reached steady-state conditions. Similar to our prior experiment (Kuehner Reference Kuehner2022), we focus on two angles of inclination for the circular pipe,
 $\alpha =15.3^{\circ }$
and
$\alpha =15.3^{\circ }$
and
 $20.3^{\circ }$
measured with a digital level with uncertainty
$20.3^{\circ }$
measured with a digital level with uncertainty
 $0.2^{\circ }$
.
$0.2^{\circ }$
.

Figure 1. Schematic of the experimental flow apparatus with an approximation of water location within the circular pipe for a rectangular step down topography. Laser and laser sheet edges are indicated, and the portion of the laser sheet that is captured by the field of view of the camera is shown. The camera is mounted above the pipe and inclined downwards towards the field of view at an angle that is accounted for in calibration.
2.1. Pipe geometry and fabrication
Circular pipes with four different isolated topography shapes were utilized as the substrates for the current study. The axial geometry of each substrate is shown in figure 2 and will be referenced with the following abbreviations: rectangular step down (RSD), triangular step down (TSD), rectangular trough (RTR), and triangular trough (TTR). As the original experiments focused on periodic corrugations, the isolated topography examined in this study was developed using the shape and terminology of the periodic corrugations utilized previously (Kuehner Reference Kuehner2022). The quantities for the dimensions shown in figure 2 are
 $a=1.9$
mm and
$a=1.9$
mm and
 $L=7.6$
mm, which are the same as those employed in the corrugation shape and tip width investigation (Kuehner Reference Kuehner2022). The depth of each substrate topography is equivalent to
$L=7.6$
mm, which are the same as those employed in the corrugation shape and tip width investigation (Kuehner Reference Kuehner2022). The depth of each substrate topography is equivalent to
 $2a$
. The length of the rectangular trough is
$2a$
. The length of the rectangular trough is
 ${3}L/{4}$
and of the triangular trough is
${3}L/{4}$
and of the triangular trough is
 $L$
, in accordance with the definition of a substrate wavelength in previous work (Kuehner Reference Kuehner2022). Each pipe has average diameter
$L$
, in accordance with the definition of a substrate wavelength in previous work (Kuehner Reference Kuehner2022). Each pipe has average diameter
 $D=50.8$
mm, and the water travels approximately
$D=50.8$
mm, and the water travels approximately
 $90$
mm before reaching the isolated topography, followed by approximately
$90$
mm before reaching the isolated topography, followed by approximately
 $40$
mm before the end of the pipe. Based on preliminary findings and the results presented below, these distances ensure that the film interaction with the entrance or exit of the pipe does not interfere with the film response to the isolated topography.
$40$
mm before the end of the pipe. Based on preliminary findings and the results presented below, these distances ensure that the film interaction with the entrance or exit of the pipe does not interfere with the film response to the isolated topography.

Figure 2. Axial variations of topography shape for (a) rectangular step down (RSD), (b) triangular step down (TSD), (c) rectangular trough (RTR), and (d) triangular trough (TTR) topographies. Substrate amplitude
 $a$
and axial length
$a$
and axial length
 $L$
are shown. Average pipe diameter
$L$
are shown. Average pipe diameter
 $D$
and the pipe centreline are included only in the top row of substrates, and are similarly defined for all substrates.
$D$
and the pipe centreline are included only in the top row of substrates, and are similarly defined for all substrates.
To permit comparison with previous work and to develop a uniform method for categorizing the results between topographies, a length scale is needed to define the Reynolds number. In planar experiments, the Reynolds number is typically defined by utilizing the flow rate per width of the planar channel. For circular pipes with topography, the flow develops a variable width as it progresses through geometries of differing radial extent. In previous work in corrugated circular pipes, we defined a reference span
 $b$
as the width of the water that fills a trough up to the crest without a consideration for the formation of a meniscus (Kuehner et al. Reference Kuehner, Mitchell and Lee2019). Figure 3 displays the relevant pipe geometry for defining this reference span similar to that presented in previous work (Kuehner et al. Reference Kuehner, Mitchell and Lee2019). The right triangle defined in figure 3(b) provides the dimensions that inform the relation for the reference span, resulting in
$b$
as the width of the water that fills a trough up to the crest without a consideration for the formation of a meniscus (Kuehner et al. Reference Kuehner, Mitchell and Lee2019). Figure 3 displays the relevant pipe geometry for defining this reference span similar to that presented in previous work (Kuehner et al. Reference Kuehner, Mitchell and Lee2019). The right triangle defined in figure 3(b) provides the dimensions that inform the relation for the reference span, resulting in
 $b=\sqrt {8Da}$
. Hence
$b=\sqrt {8Da}$
. Hence
 $b=27.8$
mm for the given pipe dimensions. This reference span is directly applicable to the RTR and TTR topographies; however, while the water spreads in the circumferential direction at the bottom of the RSD and TSD topographies, it does not develop a width similar to the reference span. Motivated to ensure uniformity of the upstream conditions for the step down and trough topographies, and to align with the definitions utilized in our previous reports, we use the definition for the reference span for all topographies even though this span is not directly applicable to the step down topographies. Therefore, the Reynolds number will be defined as
$b=27.8$
mm for the given pipe dimensions. This reference span is directly applicable to the RTR and TTR topographies; however, while the water spreads in the circumferential direction at the bottom of the RSD and TSD topographies, it does not develop a width similar to the reference span. Motivated to ensure uniformity of the upstream conditions for the step down and trough topographies, and to align with the definitions utilized in our previous reports, we use the definition for the reference span for all topographies even though this span is not directly applicable to the step down topographies. Therefore, the Reynolds number will be defined as
 $Re=q/\nu =Q/b\nu$
, with relevant fluid properties provided in table 1. Uncertainty in Reynolds number is propagated from the uncertainty in flow rate provided above, and that for the pipe geometry as defined in the next subsection.
$Re=q/\nu =Q/b\nu$
, with relevant fluid properties provided in table 1. Uncertainty in Reynolds number is propagated from the uncertainty in flow rate provided above, and that for the pipe geometry as defined in the next subsection.
Table 1. Characteristic properties and non-dimensional parameters.


Figure 3. Schematic displaying (a) an upstream facing view of the yellow circular segment that identifies the reference span
 $b$
, (b) the pipe geometry used to define the reference span as the chord associated with the yellow circular segment, and (c) an isometric view of the yellow circular segment within the topography.
$b$
, (b) the pipe geometry used to define the reference span as the chord associated with the yellow circular segment, and (c) an isometric view of the yellow circular segment within the topography.
The circular pipes are developed by revolving the axial substrate profiles shown in figure 2 around the central axis, then 3-D-printing the shape with the upper portion of the pipe removed for imaging purposes, as presented in figure 1. The pipes are printed from opaque dark grey ASA (acrylonitrile styrene acrylate) using the same 3-D printer settings utilized in all previous experimental work (Kuehner et al. Reference Kuehner, Mitchell and Lee2019, 2021; Kuehner Reference Kuehner2022) to ensure that substrate surface material and texture remain similar. The 3-D printer has spatial accuracy
 $0.2$
mm, and slice height
$0.2$
mm, and slice height
 $0.127$
mm was employed for each pipe, resulting in a maximum uncertainty in substrate dimensions of
$0.127$
mm was employed for each pipe, resulting in a maximum uncertainty in substrate dimensions of
 $0.2$
mm.
$0.2$
mm.
2.2. Free surface and film thickness fluorescence imaging
The free surface of the film flow and the location of the substrate are identified using fluorescence imaging. Similar to previous experiments (Kuehner et al. Reference Kuehner, Mitchell and Lee2019, 2021; Kuehner Reference Kuehner2022), Rhodamine 640 perchlorate dye is mixed with the water, and fluorescence from the dye is excited using a continuous-wave laser (Coherent Genesis) with power levels ranging between
 $600$
and
$600$
and
 $700$
mW. The output of the laser is formed into a thin sheet by a combination of spherical and cylindrical lenses, and aligned with the axial centreline of the circular pipe, as displayed in figure 1. Images of the fluorescence were captured using a high-speed camera, also shown in figure 1, and calibrated with an alignment target to correct for the off-axis image plane. The spatial resolution of the fluorescence images is estimated from the calibration as
$700$
mW. The output of the laser is formed into a thin sheet by a combination of spherical and cylindrical lenses, and aligned with the axial centreline of the circular pipe, as displayed in figure 1. Images of the fluorescence were captured using a high-speed camera, also shown in figure 1, and calibrated with an alignment target to correct for the off-axis image plane. The spatial resolution of the fluorescence images is estimated from the calibration as
 $0.031$
mm per pixel. Time sequences of 23 808 images are acquired at
$0.031$
mm per pixel. Time sequences of 23 808 images are acquired at
 $50$
frames per second, representing almost
$50$
frames per second, representing almost
 $8$
min of film flow behaviour. A red filter is applied to the camera lens to reduce the
$8$
min of film flow behaviour. A red filter is applied to the camera lens to reduce the
 $488$
nm laser excitation wavelength within the images.
$488$
nm laser excitation wavelength within the images.

Figure 4. Comparison of the edge-detection results using the Canny method (cyan line) and the results using the c.d.f. method (yellow line) for an instantaneous image just upstream of the RSD topography for
 $Re=69$
and
$Re=69$
and
 $\alpha =15.3^{\circ }$
.
$\alpha =15.3^{\circ }$
.
The observed free surface of the film flow included undulations of a shorter wavelength as compared to previous work, in particular for the RSD topography. Even after adjusting the angle between the radial direction and the approach of the laser sheet to minimize the formation of low-intensity regions within the fluorescence images, the curvature of the free surface caused notable fluctuations in intensity. The intensity variations prompted adjustments to the free surface detection algorithms utilized previously, which were based on the Canny method (Kuehner et al. Reference Kuehner, Mitchell and Lee2019, 2021; Kuehner Reference Kuehner2022). While the Canny method is generally reliable even where large intensity gradients exist, it produced film surfaces that included defects which were difficult to distinguish from true surface undulations as could be accomplished previously. An example of a defect is presented in figure 4 for a film flow just upstream of the RSD topography. The Canny-based method, shown in cyan in figure 4, incorrectly identifies the free surface in the middle of the image that could not be corrected with our prior approach. Hence a new edge detection method was developed, shown by the yellow line in figure 4, that relies upon the cumulative distribution function (c.d.f.) of the image intensity within a column of pixels in the radial direction. A spatial derivative was applied to the c.d.f. in the radial direction to locate the region where the c.d.f. first plateaus. Additionally, the results of the spatial derivative of the c.d.f. were useful in identifying and discarding errant free surface results in regions of low intensity. If the spatial derivative of the c.d.f. for a particular column did not indicate a clear plateau in the c.d.f., then the edge-detection results for that column were discarded, and the edge-detection results in the near vicinity were utilized to approximate the free surface in the discarded region. We found this method to be more sensitive and reliable for most of the images obtained in the current work; however, we note that the method is sensitive to edges only in the radial direction. While limited in scope, the ability to detect and correct surface defects outweighed the lack of sensitivity to free surface edges in the axial direction, given the nature of most of the images acquired in the current work. Three data sets included images for which this new c.d.f.-based method had to be further modified, as discussed further in § 3. The results of the new c.d.f.-based method shown in figure 4 demonstrate the ability to avoid the surface defect as well as to better capture the free surface at the left-hand edge of the image. Comparing the results of the two methods across a range of flow conditions reveals that for instantaneous images, the c.d.f.-based method differs from the Canny-based method by approximately
 $4$
pixels in regions of the free surface including substantial curvature, and typically by
$4$
pixels in regions of the free surface including substantial curvature, and typically by
 $1$
pixel when the free surface curvature is similar to that seen in our previous work.
$1$
pixel when the free surface curvature is similar to that seen in our previous work.
Once image acquisition was completed for a particular flow rate, angle of inclination, and topography shape, the pump was turned off and the remaining water within the pipe was allowed to drain until the film thickness on the pipe surface had reached a steady minimum within the limits of surface tension. Employing a method developed in our previous work (Kuehner Reference Kuehner2022), we acquired fluorescence images of the remaining water in the pipe, and used these images to approximate the location of the first crest of the topography. By incorporating the known geometry of the 3-D-printed circular pipes, an approximation for film thickness can then be acquired. The axial origin for the coordinate system employed in the figures presented in § 3 is located at the start of the topography, as shown in figure 5. The elevation coordinate origin is at the average radius of the pipe, allowing the film thickness to be calculated as
 $h-h^{ }_{o}$
. Based on the spatial resolution of the calibrated fluorescence images, we estimate the uncertainty for a length determined from an image to be
$h-h^{ }_{o}$
. Based on the spatial resolution of the calibrated fluorescence images, we estimate the uncertainty for a length determined from an image to be
 $0.04$
mm, and owing to the approximate nature of identifying the substrate, the uncertainty in film thickness is estimated to be
$0.04$
mm, and owing to the approximate nature of identifying the substrate, the uncertainty in film thickness is estimated to be
 $0.15$
mm.
$0.15$
mm.

Figure 5. Instantaneous fluorescence image of film flow over TTR topography. The red line indicates the approximated location of the substrate. The coordinate system employed for axial distance
 $x$
, absolute free surface elevation
$x$
, absolute free surface elevation
 $h$
, and substrate elevation
$h$
, and substrate elevation
 $h^{ }_{o}$
is shown. The fluorescence within the volume of the film is viewed through the non-uniform free surface, causing a distortion that makes the bottom of the water appear detached from the substrate.
$h^{ }_{o}$
is shown. The fluorescence within the volume of the film is viewed through the non-uniform free surface, causing a distortion that makes the bottom of the water appear detached from the substrate.
2.3. Measurement uncertainty
The measurement uncertainties presented in this subsection, along with those propagated for quantities discussed in this subsection and in § 3, are presented in table 2. Propagation methods for each uncertainty calculation are described where relevant.
Table 2. Summary of measurement uncertainty.

3. Results and discussion
The free surface response of gravity-driven film flow through circular pipes with isolated topography was investigated for three volume flow rates, two inclination angles, and four variations in substrate topography. For consistency, the colours and markers utilized in the figures below are the same as those used in our previous report on corrugation shape and tip width (Kuehner Reference Kuehner2022). As discussed in § 1, investigations into planar film flow over isolated topography have indicated that the film flows are stable (Kalliadasis & Homsy Reference Kalliadasis and Homsy2001; Bielarz & Kalliadasis Reference Bielarz and Kalliadasis2003; Davis & Troian Reference Davis and Troian2005), so the steady-state free surface profile will be regained after a disturbance passes. Hence we begin by presenting the steady-state response of the film flow to the topography before exploring the characteristics of the transient response that might relate to the periodic flow observed in corrugated circular pipes.
3.1. Time-averaged free surface response
To develop a measure of the steady-state free surface response to the substrate topography, time-averaged absolute free surface elevations are calculated and presented in figure 6 for the full axial length under consideration. In the region upstream and downstream of the topography, the elevation and shape of the free surface are similar between flow rates and angles of inclination for a given topography, and display only minor variations between topographies, indicating that the response to the topography is primarily localized to the axial region surrounding the topography itself. For the RSD, TSD and TTR topographies, the film rises through a crest between
 $x/L=3.0$
and
$x/L=3.0$
and
 $x/L=4.5$
before travelling towards the exit of the pipe. This downstream crest is not observed in 2-D planar flows with similar topography, yet it is reminiscent of the ridge that forms at the outlet of a 3-D planar trough although of reduced magnitude (Gaskell et al. Reference Gaskell, Jimack, Sellier, Thompson and Wilson2004b
). The similarity to the 3-D case indicates that this downstream rise possibly results from the water leaving the step or trough region and having to decrease in spanwise extent to reach a narrow spanwise width similar to that upstream of the topography. This confluence of the downstream flow entering the topography with the spanwise flow from the regions where the water has spread circumferentially would compare to the effect observed for 3-D planar rectangular troughs, for which the flow enters over three sides of the rectangular trough but exits over one side (Gaskell et al. Reference Gaskell, Jimack, Sellier, Thompson and Wilson2004b
). The lack of this downstream rise for the RTR topography indicates that the flow in the spanwise direction might differ from that associated with the other topographies.
$x/L=4.5$
before travelling towards the exit of the pipe. This downstream crest is not observed in 2-D planar flows with similar topography, yet it is reminiscent of the ridge that forms at the outlet of a 3-D planar trough although of reduced magnitude (Gaskell et al. Reference Gaskell, Jimack, Sellier, Thompson and Wilson2004b
). The similarity to the 3-D case indicates that this downstream rise possibly results from the water leaving the step or trough region and having to decrease in spanwise extent to reach a narrow spanwise width similar to that upstream of the topography. This confluence of the downstream flow entering the topography with the spanwise flow from the regions where the water has spread circumferentially would compare to the effect observed for 3-D planar rectangular troughs, for which the flow enters over three sides of the rectangular trough but exits over one side (Gaskell et al. Reference Gaskell, Jimack, Sellier, Thompson and Wilson2004b
). The lack of this downstream rise for the RTR topography indicates that the flow in the spanwise direction might differ from that associated with the other topographies.

Figure 6. Time-averaged absolute free surface elevation normalized by substrate amplitude for (a) RSD, (b) TSD, (c) RTR and (d) TTR topographies. Data are replicated in figure 7 with increased magnification for clarity. Substrate topography is shown as a grey line. Uncertainty in substrate location is approximately
 $0.08a$
, and in absolute free surface elevation is approximately
$0.08a$
, and in absolute free surface elevation is approximately
 $0.02a$
.
$0.02a$
.
In the vicinity of the topography, the axial region identified by
 $x/L=-0.5$
to
$x/L=-0.5$
to
 $x/L=1.5$
, the free surface of the film varies notably with flow rate, angle of inclination and topography shape. These same variations in flow conditions also influenced the time-averaged free surface response for film flow within corrugated circular pipes (Kuehner Reference Kuehner2022), indicating potentially similar effects in the underlying film flow. To better examine the time-averaged free surface response to the topography, figure 7 displays the time-averaged absolute free surface elevation profiles within this region. There is significant variation in free surface shape between flow conditions for the RSD topography (figure 7
a). For the lowest and highest flow rates, and larger inclination angle, the free surface develops a series of capillary waves before rising into the capillary ridge over the RSD topography. The curvature of the capillary ridge develops a region of high free surface pressure that turns the flow around the steep RSD topography (Mazouchi & Homsy Reference Mazouchi and Homsy2001). The circular pipe findings compare with results for film flow over 2-D planar step down topography (Bontozoglou & Serifi Reference Bontozoglou and Serifi2008) in revealing the importance of flow rate in determining whether a capillary ridge or a series of capillary waves forms, as this is indicative of the balance between inertia and surface tension effects. The capillary ridge is often the most prominent feature of film flow response over isolated 2-D planar topography (Fernandez Parent et al. Reference Fernandez Parent, Lammers and Decré1998; Aksel Reference Aksel2000; Kalliadasis et al. Reference Kalliadasis, Bielarz and Homsy2000; Mazouchi & Homsy Reference Mazouchi and Homsy2001; Decré & Baret Reference Decré and Baret2003; Gaskell et al. Reference Gaskell, Jimack, Sellier, Thompson and Wilson2004b
; Davis & Troian Reference Davis and Troian2005; Bontozoglou & Serifi Reference Bontozoglou and Serifi2008; Pal et al. Reference Pal, Sanyasiraju and Usha2022), whereas for the current results, the capillary ridge has a reduced relative prominence. The reduced prominence is likely due to the circumferential extent of the water either at the bottom of a step or within a trough, resulting in the water travelling through regions of considerably different spanwise extent in circular pipes, as opposed to planar cases that have a consistent width.
$x/L=1.5$
, the free surface of the film varies notably with flow rate, angle of inclination and topography shape. These same variations in flow conditions also influenced the time-averaged free surface response for film flow within corrugated circular pipes (Kuehner Reference Kuehner2022), indicating potentially similar effects in the underlying film flow. To better examine the time-averaged free surface response to the topography, figure 7 displays the time-averaged absolute free surface elevation profiles within this region. There is significant variation in free surface shape between flow conditions for the RSD topography (figure 7
a). For the lowest and highest flow rates, and larger inclination angle, the free surface develops a series of capillary waves before rising into the capillary ridge over the RSD topography. The curvature of the capillary ridge develops a region of high free surface pressure that turns the flow around the steep RSD topography (Mazouchi & Homsy Reference Mazouchi and Homsy2001). The circular pipe findings compare with results for film flow over 2-D planar step down topography (Bontozoglou & Serifi Reference Bontozoglou and Serifi2008) in revealing the importance of flow rate in determining whether a capillary ridge or a series of capillary waves forms, as this is indicative of the balance between inertia and surface tension effects. The capillary ridge is often the most prominent feature of film flow response over isolated 2-D planar topography (Fernandez Parent et al. Reference Fernandez Parent, Lammers and Decré1998; Aksel Reference Aksel2000; Kalliadasis et al. Reference Kalliadasis, Bielarz and Homsy2000; Mazouchi & Homsy Reference Mazouchi and Homsy2001; Decré & Baret Reference Decré and Baret2003; Gaskell et al. Reference Gaskell, Jimack, Sellier, Thompson and Wilson2004b
; Davis & Troian Reference Davis and Troian2005; Bontozoglou & Serifi Reference Bontozoglou and Serifi2008; Pal et al. Reference Pal, Sanyasiraju and Usha2022), whereas for the current results, the capillary ridge has a reduced relative prominence. The reduced prominence is likely due to the circumferential extent of the water either at the bottom of a step or within a trough, resulting in the water travelling through regions of considerably different spanwise extent in circular pipes, as opposed to planar cases that have a consistent width.
The series of capillary waves preceding the capillary ridge has been observed in steady-state film flows over planar step down topography (Mazouchi & Homsy Reference Mazouchi and Homsy2001; Bontozoglou & Serifi Reference Bontozoglou and Serifi2008) or planar troughs (Pal et al. Reference Pal, Sanyasiraju and Usha2021). For the circular pipe RSD cases in figure 7(a) of
 $Re=125$
and
$Re=125$
and
 $\alpha =15.3^{\circ }$
and
$\alpha =15.3^{\circ }$
and
 $Re=97$
and
$Re=97$
and
 $\alpha =20.3^{\circ }$
, the capillary waves do not descend significantly in the radial direction before rising towards the next capillary crest, in contrast to the case for
$\alpha =20.3^{\circ }$
, the capillary waves do not descend significantly in the radial direction before rising towards the next capillary crest, in contrast to the case for
 $Re=69$
and
$Re=69$
and
 $\alpha =15.3^{\circ }$
, which produces more well-defined capillary waves that better compare to planar cases. For the intermediate flow rate
$\alpha =15.3^{\circ }$
, which produces more well-defined capillary waves that better compare to planar cases. For the intermediate flow rate
 $Re=97$
and
$Re=97$
and
 $\alpha =15.3^{\circ }$
, the flow rises monotonically to a maximum elevation before descending after the step; hence the angle of inclination influences the development of a capillary ridge similar to the film flow response to 2-D planar step down topography (Aksel Reference Aksel2000). For the highest two flow rates, the film descends approximately monotonically; however, for the lowest flow rate, the free surface forms a capillary wave that transitions into a sustained overhang over the film that forms the outlet to the topography. This steady overhang is distinct from any free surface observed for film flow over 2-D step down or 3-D rectangular trough planar topography (Aksel Reference Aksel2000; Kalliadasis et al. Reference Kalliadasis, Bielarz and Homsy2000; Mazouchi & Homsy Reference Mazouchi and Homsy2001; Bielarz & Kalliadasis Reference Bielarz and Kalliadasis2003; Decré & Baret Reference Decré and Baret2003; Davis & Troian Reference Davis and Troian2005; Bontozoglou & Serifi Reference Bontozoglou and Serifi2008; Veremieiev et al. Reference Veremieiev, Thompson, Lee and Gaskell2010; Scholle et al. Reference Scholle, Gaskell and Marner2019; Pal et al. Reference Pal, Sanyasiraju and Usha2022). As noted in § 2.2, the c.d.f.-based edge-detection method applied to the instantaneous images was sensitive only to radial variations in intensity, so for the flow condition that generated an overhang, the portion of the image that included axial variations in intensity was separated so the c.d.f.-based method could be applied in the axial direction.
$\alpha =15.3^{\circ }$
, the flow rises monotonically to a maximum elevation before descending after the step; hence the angle of inclination influences the development of a capillary ridge similar to the film flow response to 2-D planar step down topography (Aksel Reference Aksel2000). For the highest two flow rates, the film descends approximately monotonically; however, for the lowest flow rate, the free surface forms a capillary wave that transitions into a sustained overhang over the film that forms the outlet to the topography. This steady overhang is distinct from any free surface observed for film flow over 2-D step down or 3-D rectangular trough planar topography (Aksel Reference Aksel2000; Kalliadasis et al. Reference Kalliadasis, Bielarz and Homsy2000; Mazouchi & Homsy Reference Mazouchi and Homsy2001; Bielarz & Kalliadasis Reference Bielarz and Kalliadasis2003; Decré & Baret Reference Decré and Baret2003; Davis & Troian Reference Davis and Troian2005; Bontozoglou & Serifi Reference Bontozoglou and Serifi2008; Veremieiev et al. Reference Veremieiev, Thompson, Lee and Gaskell2010; Scholle et al. Reference Scholle, Gaskell and Marner2019; Pal et al. Reference Pal, Sanyasiraju and Usha2022). As noted in § 2.2, the c.d.f.-based edge-detection method applied to the instantaneous images was sensitive only to radial variations in intensity, so for the flow condition that generated an overhang, the portion of the image that included axial variations in intensity was separated so the c.d.f.-based method could be applied in the axial direction.
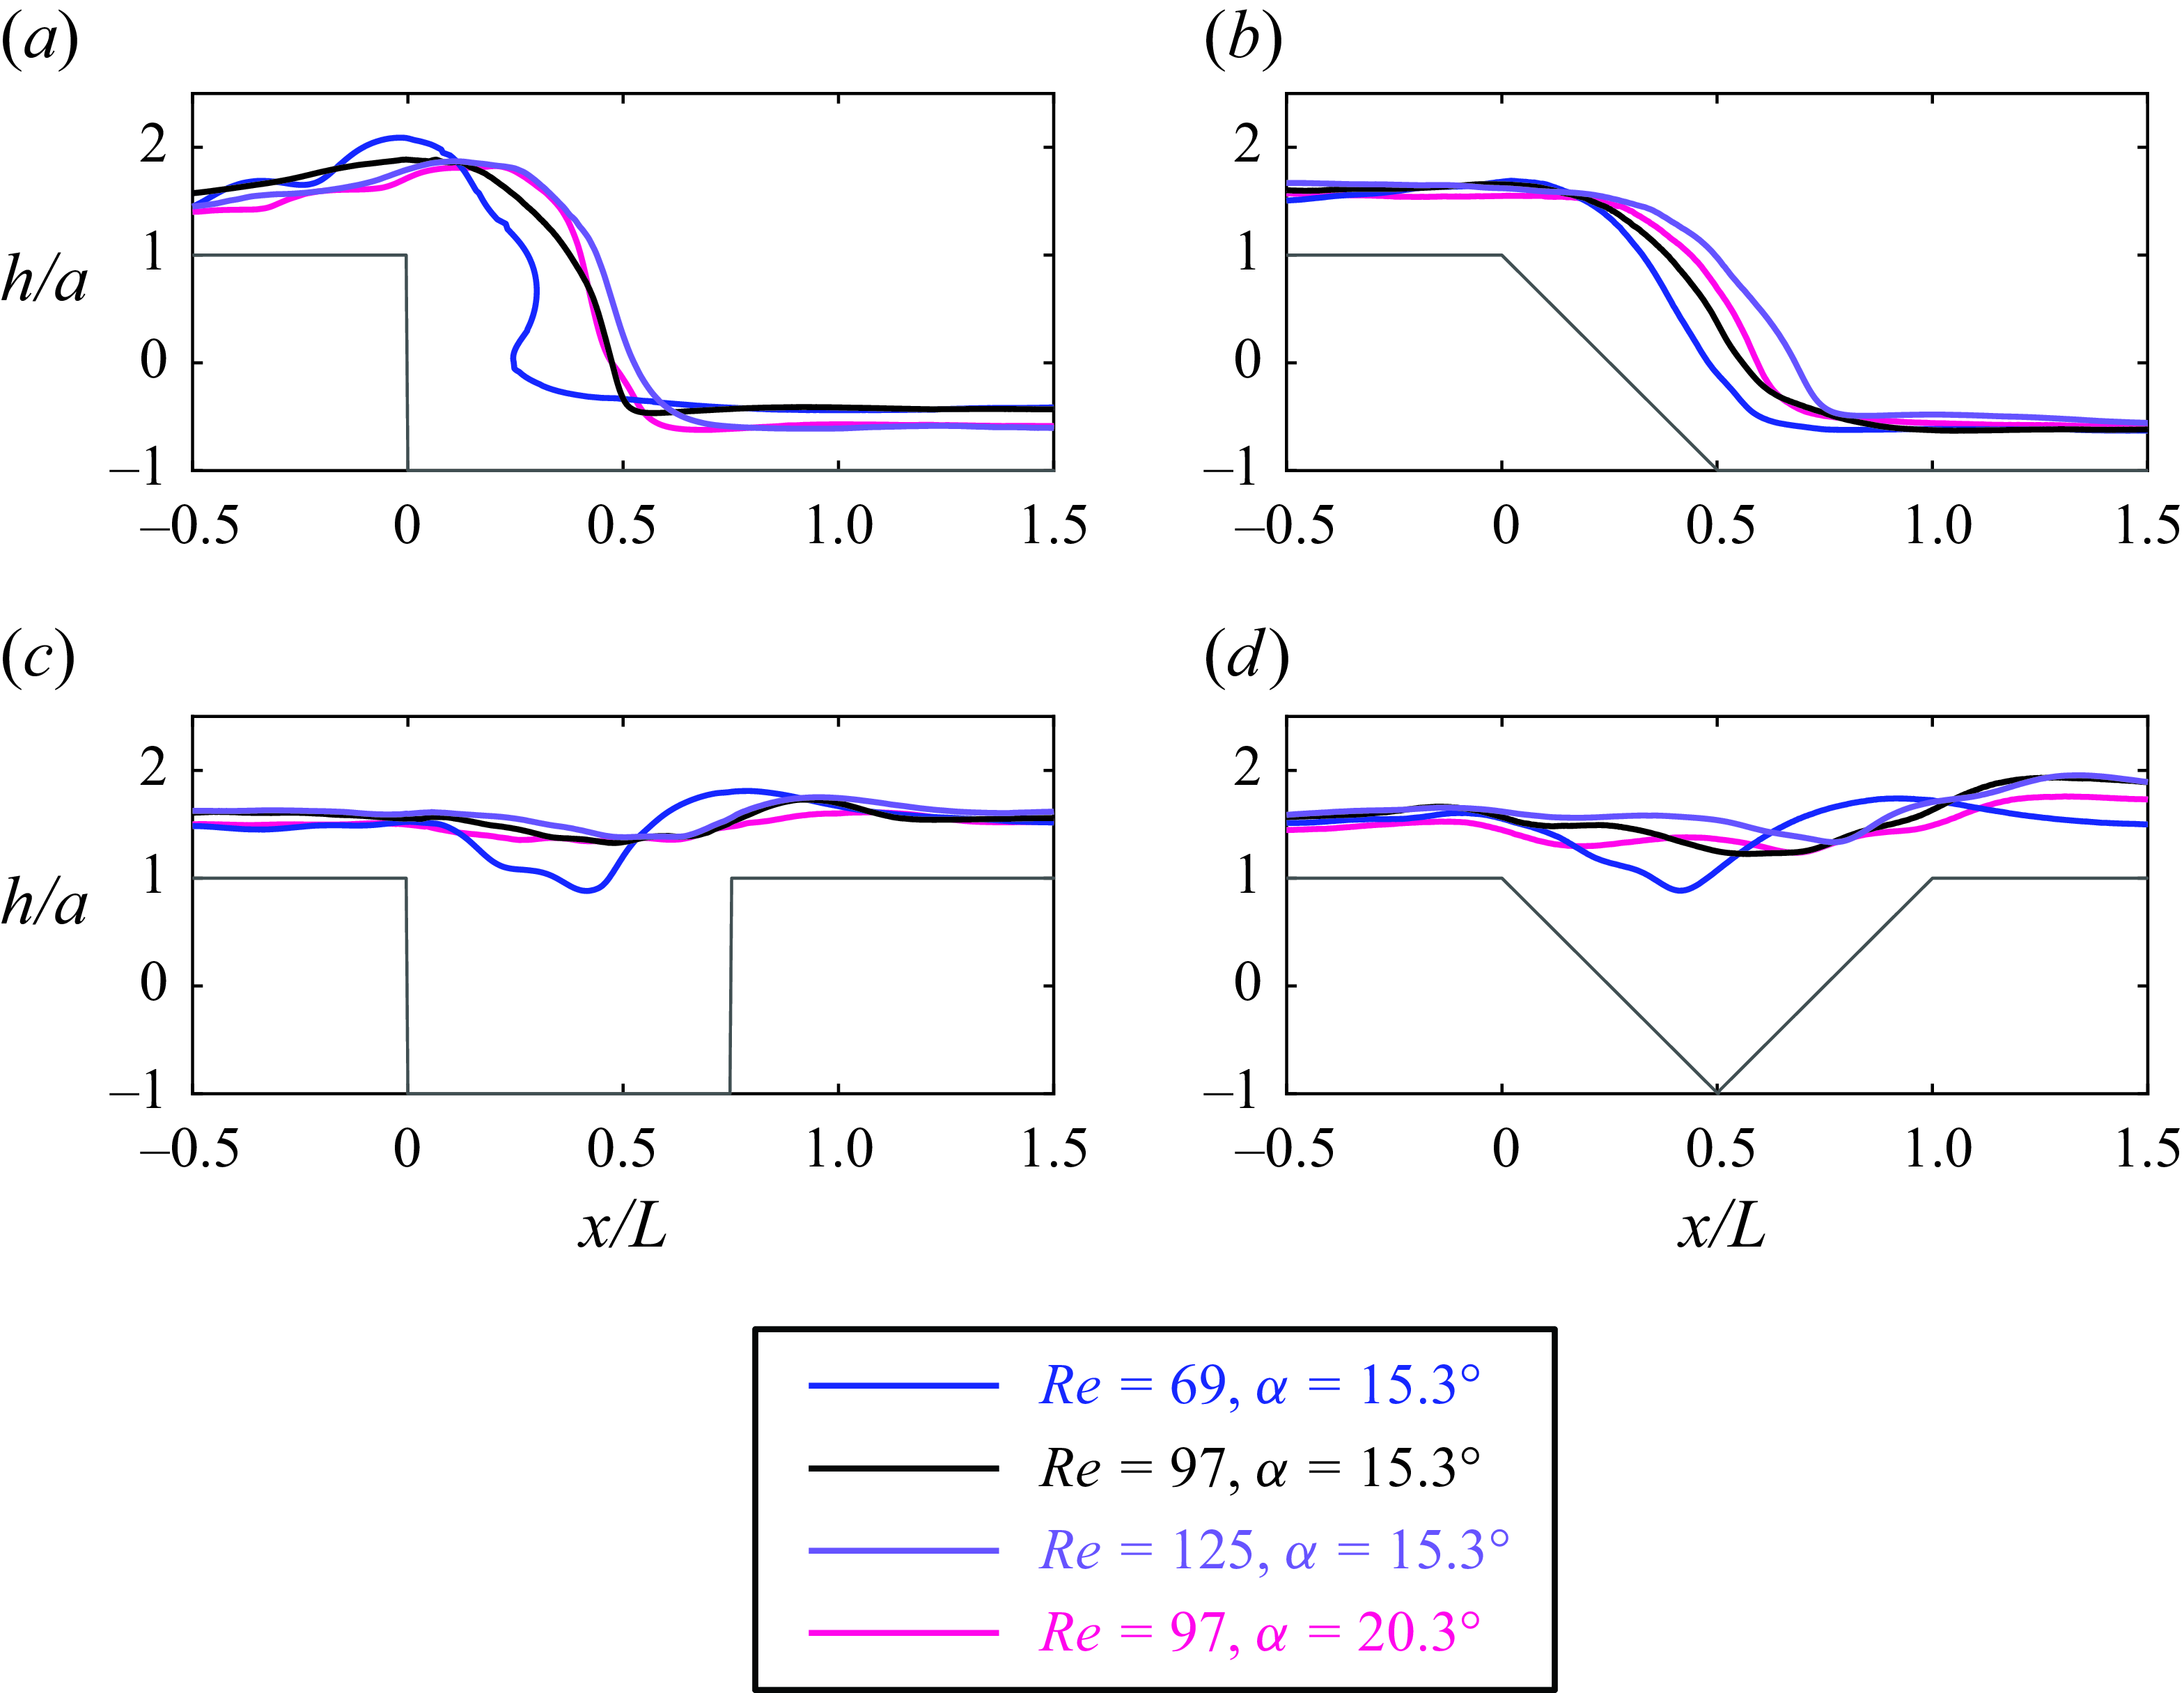
Figure 7. Time-averaged absolute free surface elevation normalized by substrate amplitude for (a) RSD, (b) TSD, (c) RTR and (d) TTR topographies. Data are identical to those shown in figure 6, with increased magnification to improve clarity. Substrate topography is shown as a grey line. Uncertainty in substrate location is approximately
 $0.08a$
, and in absolute free surface elevation is approximately
$0.08a$
, and in absolute free surface elevation is approximately
 $0.02a$
.
$0.02a$
.
The only phenomenon similar to the steady overhang produced by the RSD topography, as seen in figures 6(a) and 7(a) at the lowest flow rate, is that found within the examination of moving contact lines over topography. As the contact line spreads, a capillary ridge forms at the leading edge for some flow conditions. As the leading edge encounters 2-D planar topography, a subsequent bulge of fluid forms on the downstream face of the topography, and builds in volume before it either reaches the next face of the substrate or detaches and drips (Gramlich et al. Reference Gramlich, Mazouchi and Homsy2004; Mazloomi & Moosavi Reference Mazloomi and Moosavi2012, Reference Mazloomi and Moosavi2013; Lampropoulos et al. Reference Lampropoulos, Dimakopoulos and Tsamopoulos2016; Karapetsas et al. Reference Karapetsas, Lampropoulos, Dimakopoulos and Tsamopoulos2017; Singh & Tiwari Reference Singh and Tiwari2024). For some conditions, this bulge of fluid develops a pressure gradient large enough to drive the film towards the bottom corner of the step (Gramlich et al. Reference Gramlich, Mazouchi and Homsy2004; Lampropoulos et al. Reference Lampropoulos, Dimakopoulos and Tsamopoulos2016). While the free surface shape of the film in figures 6(a) and 7(a) for
 $Re=69$
is similar to the developing bulge in some moving contact line observations, a moving contact line encounters a clean surface, whereas the film flow in the current study proceeds over a previously wet surface. Therefore, this indirect comparison is made with caution, as the adhesion that is partly responsible for the bulge formation within a moving contact line over topography is not likely to be an effect present in the steady overhang detected in the current film flow results. The curvature of the steady overhang in figure 7(a) would produce a pressure difference between the largest axial extent of the overhang near
$Re=69$
is similar to the developing bulge in some moving contact line observations, a moving contact line encounters a clean surface, whereas the film flow in the current study proceeds over a previously wet surface. Therefore, this indirect comparison is made with caution, as the adhesion that is partly responsible for the bulge formation within a moving contact line over topography is not likely to be an effect present in the steady overhang detected in the current film flow results. The curvature of the steady overhang in figure 7(a) would produce a pressure difference between the largest axial extent of the overhang near
 $h/a=0.8$
and the subsequent minimum axial extent near
$h/a=0.8$
and the subsequent minimum axial extent near
 $h/a=0$
. Therefore, the steady overhang could form in response to the preceding capillary ridge existing over the edge of the step rather than further upstream as observed for planar cases, indicating that inertia caused the surface tension effects to develop further downstream as the Reynolds number increases from
$h/a=0$
. Therefore, the steady overhang could form in response to the preceding capillary ridge existing over the edge of the step rather than further upstream as observed for planar cases, indicating that inertia caused the surface tension effects to develop further downstream as the Reynolds number increases from
 $69$
to
$69$
to
 $97$
, and again to
$97$
, and again to
 $125$
. The curvature of the steady overhang and the resulting surface pressure gradient forces the water closer to the step face, similar to the bulge in spreading contact lines such that the axial distance between the free surface and the step face is reduced. For higher flow rates, the inertia becomes dominant and forces capillary effects to be imposed entirely on top of the volume of water at the base of the step, and no bulge forms to bring the free surface closer to the step face.
$125$
. The curvature of the steady overhang and the resulting surface pressure gradient forces the water closer to the step face, similar to the bulge in spreading contact lines such that the axial distance between the free surface and the step face is reduced. For higher flow rates, the inertia becomes dominant and forces capillary effects to be imposed entirely on top of the volume of water at the base of the step, and no bulge forms to bring the free surface closer to the step face.
For the TSD, RTR and TTR topographies, shown in figures 7(b), 7(c), and 7(d), capillary wave patterns are less well developed upstream of the topography. The TSD topography (figure 7
b) produces a time-averaged response that primarily aligns with the topography shape, with only minor evidence of capillary waves at the lowest flow rate. A comparison of film response between TSD (figure 7
b) and RSD (figure 7
a) topographies demonstrates that a capillary ridge is needed to turn the flow
 $90^{\circ }$
over the RSD topography (Mazouchi & Homsy Reference Mazouchi and Homsy2001), but not for the
$90^{\circ }$
over the RSD topography (Mazouchi & Homsy Reference Mazouchi and Homsy2001), but not for the
 $45^{\circ }$
turn over the TSD topography. The fact that the triangular topographies produce a reduced steady-state effect compared to their rectangular counterparts is in contrast to the results for corrugated circular pipes, for which the triangular topography generated some of the most distinct patterns in the time-averaged free surface (Kuehner Reference Kuehner2022), highlighting that similarities and differences exist between the responses to isolated topography and corrugations.
$45^{\circ }$
turn over the TSD topography. The fact that the triangular topographies produce a reduced steady-state effect compared to their rectangular counterparts is in contrast to the results for corrugated circular pipes, for which the triangular topography generated some of the most distinct patterns in the time-averaged free surface (Kuehner Reference Kuehner2022), highlighting that similarities and differences exist between the responses to isolated topography and corrugations.
For both single-trough topographies (figures 7
c,d), the film descends further within the trough and closer to the upstream wall of the topography for the lowest flow rate, the only flow condition for which the film height falls below
 $h/a=1$
. Similar to the lowest flow rate for the RSD topography that developed the steady overhang, the lowest flow rate over the trough topographies allows surface tension effects to take hold ahead of the topography, and causes the capillary ridge at the leading edge of the trough to have a longer axial extent. This capillary ridge at low flow rate can force the film further into the trough and closer to the upstream trough face, similar to the observations over RSD topography. At higher flow rates, inertia dominates and surface tension effects are unable to draw the free surface into the trough or as close to the upstream topography face as occurred for the lowest flow rate case. There are similarities in the shape of the free surface between these two different trough topographies when comparing individual cases of flow rate and angle of inclination in figures 7(c) and 7(d), indicating that the flow rate and angle of inclination have a stronger effect than the shape of the topography for these cases. The similar magnitude of free surface response compares well with the results found for corrugated circular pipes, for which rectangular corrugations with this trough length produced a statically deformed free surface amplitude similar to that for triangular corrugations (Kuehner Reference Kuehner2022).
$h/a=1$
. Similar to the lowest flow rate for the RSD topography that developed the steady overhang, the lowest flow rate over the trough topographies allows surface tension effects to take hold ahead of the topography, and causes the capillary ridge at the leading edge of the trough to have a longer axial extent. This capillary ridge at low flow rate can force the film further into the trough and closer to the upstream trough face, similar to the observations over RSD topography. At higher flow rates, inertia dominates and surface tension effects are unable to draw the free surface into the trough or as close to the upstream topography face as occurred for the lowest flow rate case. There are similarities in the shape of the free surface between these two different trough topographies when comparing individual cases of flow rate and angle of inclination in figures 7(c) and 7(d), indicating that the flow rate and angle of inclination have a stronger effect than the shape of the topography for these cases. The similar magnitude of free surface response compares well with the results found for corrugated circular pipes, for which rectangular corrugations with this trough length produced a statically deformed free surface amplitude similar to that for triangular corrugations (Kuehner Reference Kuehner2022).
For all flow conditions in trough substrates, the free surface responds to the trough by decreasing elevation over the trough before rising through a capillary ridge that forms at the outlet of the trough. The capillary ridge at the trough outlet is also found in film flow over 2-D planar step up topography (Bontozoglou & Serifi Reference Bontozoglou and Serifi2008), but not in film flow over a 2-D planar rectangular trough (Kalliadasis et al. Reference Kalliadasis, Bielarz and Homsy2000; Mazouchi & Homsy Reference Mazouchi and Homsy2001; Decré & Baret Reference Decré and Baret2003; Gaskell et al. Reference Gaskell, Jimack, Sellier, Thompson and Wilson2004b ; Pal et al. Reference Pal, Sanyasiraju and Usha2021, Reference Pal, Sanyasiraju and Usha2022). A similar capillary ridge forms at the outlet of 3-D rectangular troughs (Decré & Baret Reference Decré and Baret2003; Gaskell et al. Reference Gaskell, Jimack, Sellier, Thompson and Wilson2004b ; Pal et al. Reference Pal, Sanyasiraju and Usha2021); hence the 3-D planar rectangular trough cases are closer comparisons to the circular pipe cases, further indicating the importance of the variable spanwise width of the film in circular pipes with topography as discussed above.

Figure 8. Time-averaged film thickness normalized by substrate amplitude at
 $x/L=-1.5$
, spatially averaged over
$x/L=-1.5$
, spatially averaged over
 $x/L=-0.5$
to
$x/L=-0.5$
to
 $x/L=1.5$
, and at
$x/L=1.5$
, and at
 $x/L=3.0$
for (a) RSD, (b) TSD, (c) RTR and (d) TTR topographies.
$x/L=3.0$
for (a) RSD, (b) TSD, (c) RTR and (d) TTR topographies.
To further investigate the time-averaged free surface dependence on flow rate, inclination angle and topography shape, figure 8 displays the time-averaged film thickness
 $h-h^{ }_{o}$
normalized by the amplitude of the topography within three axial ranges. The first axial location is upstream of the topography at
$h-h^{ }_{o}$
normalized by the amplitude of the topography within three axial ranges. The first axial location is upstream of the topography at
 $x/L=-1.5$
, the next represents a spatial average over the axial region in the vicinity of the isolated topography defined by
$x/L=-1.5$
, the next represents a spatial average over the axial region in the vicinity of the isolated topography defined by
 $x/L=-0.5$
to
$x/L=-0.5$
to
 $x/L=1.5$
, and the final axial location is downstream of the topography at
$x/L=1.5$
, and the final axial location is downstream of the topography at
 $x/L=3.0$
. In general, the time-averaged film thickness increases with flow rate and decreases with angle of inclination, most notably for the TSD topography in figure 8(b). The increase in film thickness with flow rate aligns with the findings in corrugated circular pipes (Kuehner Reference Kuehner2022), and the trends compare well with the expectations that a higher flow rate should increase the volume of water and average thickness in the pipe, and a larger angle of inclination should increase average film velocity, leading to a reduction in film thickness to maintain volume flow rate. Comparing variations between topography shapes, the TSD topography provides a substantially different film response than the other three shapes, as it produces a film thickness that is larger upstream and downstream of the trough, while a reduced film thickness during the interaction with the trough is reflective of the reduced turning associated with the TSD topography, which diminishes the surface tension effects in the vicinity of the topography. For all topographies, however, the film thickness is always larger in the vicinity of the topography than before or after, due to the capillary effects that lead to increased curvature at the free surface, such as through a capillary ridge or series of capillary waves. Although there are notable variations in free surface curvature with changes in flow rate or inclination angle in the vicinity of the topography, as highlighted in figure 7, the average film thickness in this axial region is relatively similar across flow conditions within a particular topography, further indicating the effect of the circumferential extent of the water near the bottom corner of the step or within the trough, which affords consistency to the volume of water near the topography between the flow conditions examined. The effect of the final downstream rise discussed above is also evident in figure 8 as a difference in film thickness from upstream at
$x/L=3.0$
. In general, the time-averaged film thickness increases with flow rate and decreases with angle of inclination, most notably for the TSD topography in figure 8(b). The increase in film thickness with flow rate aligns with the findings in corrugated circular pipes (Kuehner Reference Kuehner2022), and the trends compare well with the expectations that a higher flow rate should increase the volume of water and average thickness in the pipe, and a larger angle of inclination should increase average film velocity, leading to a reduction in film thickness to maintain volume flow rate. Comparing variations between topography shapes, the TSD topography provides a substantially different film response than the other three shapes, as it produces a film thickness that is larger upstream and downstream of the trough, while a reduced film thickness during the interaction with the trough is reflective of the reduced turning associated with the TSD topography, which diminishes the surface tension effects in the vicinity of the topography. For all topographies, however, the film thickness is always larger in the vicinity of the topography than before or after, due to the capillary effects that lead to increased curvature at the free surface, such as through a capillary ridge or series of capillary waves. Although there are notable variations in free surface curvature with changes in flow rate or inclination angle in the vicinity of the topography, as highlighted in figure 7, the average film thickness in this axial region is relatively similar across flow conditions within a particular topography, further indicating the effect of the circumferential extent of the water near the bottom corner of the step or within the trough, which affords consistency to the volume of water near the topography between the flow conditions examined. The effect of the final downstream rise discussed above is also evident in figure 8 as a difference in film thickness from upstream at
 $x/L=-1.5$
to downstream at
$x/L=-1.5$
to downstream at
 $x/L=3$
. While this downstream rise makes it appear that the topography would have a permanent effect on the downstream thickness, and therefore width, of the film flow in the circular pipe, for the cases in which the end of the downstream rise can be observed, such as for
$x/L=3$
. While this downstream rise makes it appear that the topography would have a permanent effect on the downstream thickness, and therefore width, of the film flow in the circular pipe, for the cases in which the end of the downstream rise can be observed, such as for
 $Re=69$
for the RSD topography in figure 6(a), the film thickness returns to approximately the same as that upstream of topography. In addition, small variations in film thickness from upstream to downstream of the step topographies can be attributed to the difference in pipe diameter from
$Re=69$
for the RSD topography in figure 6(a), the film thickness returns to approximately the same as that upstream of topography. In addition, small variations in film thickness from upstream to downstream of the step topographies can be attributed to the difference in pipe diameter from
 $47$
mm upstream to
$47$
mm upstream to
 $54.6$
mm downstream of the step, which will produce different surface tension effects in the spanwise direction.
$54.6$
mm downstream of the step, which will produce different surface tension effects in the spanwise direction.
As mentioned above, the capillary ridge that forms near the beginning of the topography compares to that observed for film flow over similar 2-D and 3-D planar topography; however, for some flow conditions, the location of the capillary ridge in the circular pipe is further downstream than that found over planar substrates. The location of all identifiable capillary ridges in the time-averaged free surface are presented in figure 9. For many cases, the capillary ridge exists just prior to or beyond the topography onset, in direct contrast to film flow over 2-D and 3-D planar topography, which always produces a capillary ridge upstream of the start of the substrate topography (Kalliadasis et al. Reference Kalliadasis, Bielarz and Homsy2000; Gaskell et al. Reference Gaskell, Jimack, Sellier, Thompson and Wilson2004b ; Bontozoglou & Serifi Reference Bontozoglou and Serifi2008). The only exception is for the TTR topography, for which the capillary ridge is always upstream of the onset of topography. The TTR topography imposes less turning than the RTR topography, allowing the film behaviour to be more similar to that of the planar case. For the RSD, RTR and TTR topographies, the interaction between the surface tension, the axial inertia and the circumferential spreading of the film results in capillary ridge placement in contrast to that observed in planar cases. While absolute location of the capillary ridge is in disagreement with planar findings, the variation in relative location of the capillary ridge for the RSD topography is in better agreement with planar film flows for which the capillary ridge moves downstream with increasing Reynolds number (Bontozoglou & Serifi Reference Bontozoglou and Serifi2008) and increasing inclination angle (Aksel Reference Aksel2000). The RTR and TTR topographies develop contrasting trends to the RSD topography, further demonstrating the influence of the trough shape.

Figure 9. The dependence of the axial location of the capillary ridge normalized by
 $L$
on topography shape. Uncertainty is approximately
$L$
on topography shape. Uncertainty is approximately
 $0.005L$
, which is smaller than the resolution of the figure so uncertainty bars are omitted for clarity.
$0.005L$
, which is smaller than the resolution of the figure so uncertainty bars are omitted for clarity.
To highlight the variation in capillary features presented in figures 6 and 7, the characteristics of the capillary features are investigated further. Figure 10 displays the elevation of the capillary ridge, which is strongly influenced by topography shape and inclination angle, although to a lesser degree by flow rate. As expected, the sharp corner of the RSD topography produces the tallest capillary ridge to provide the favourable pressure gradient needed to flow around the
 $90^{\circ }$
corner, whereas the smallest capillary ridge forms for the RTR topography. While the average film thickness is larger for the RTR topography in comparison to the TTR topography, as seen in figure 8, it is only slightly different, and the capillary ridge elevation in figure 10 is only slightly different for trough topographies. These findings imply the formation of eddies in the RTR trough that would reduce the effect of the sharp turns and result in similar behaviour of the film over the RTR and TTR topographies (Scholle et al. Reference Scholle, Gaskell and Marner2019). However, as the two troughs have different lengths, there are several reasons to consider for the similarities and differences between the responses to RTR and TTR topographies, and conclusions cannot be made without additional data obtained within the film flow. To examine whether the prominence of the capillary ridge might be influenced by the upstream film thickness, figure 11 presents the dependence of the capillary ridge elevation on the film thickness as measured at
$90^{\circ }$
corner, whereas the smallest capillary ridge forms for the RTR topography. While the average film thickness is larger for the RTR topography in comparison to the TTR topography, as seen in figure 8, it is only slightly different, and the capillary ridge elevation in figure 10 is only slightly different for trough topographies. These findings imply the formation of eddies in the RTR trough that would reduce the effect of the sharp turns and result in similar behaviour of the film over the RTR and TTR topographies (Scholle et al. Reference Scholle, Gaskell and Marner2019). However, as the two troughs have different lengths, there are several reasons to consider for the similarities and differences between the responses to RTR and TTR topographies, and conclusions cannot be made without additional data obtained within the film flow. To examine whether the prominence of the capillary ridge might be influenced by the upstream film thickness, figure 11 presents the dependence of the capillary ridge elevation on the film thickness as measured at
 $x/L=-1.5$
. While there are positive trends between capillary ridge elevation and the upstream film thickness for the RTR and TTR topographies, overall the dependence on topography shape seems to be a stronger factor in determining capillary ridge elevation.
$x/L=-1.5$
. While there are positive trends between capillary ridge elevation and the upstream film thickness for the RTR and TTR topographies, overall the dependence on topography shape seems to be a stronger factor in determining capillary ridge elevation.

Figure 10. The dependence of the absolute free surface elevation of the capillary ridge normalized by substrate amplitude on topography shape.

Figure 11. The dependence of the absolute capillary ridge elevation normalized by substrate amplitude on upstream film thickness measured at
 $x/L=-1.5$
. Substrate topography is indicated by line type: RSD (solid), TSD (dashed), RTR (dotted) and TTR (dash-dotted).
$x/L=-1.5$
. Substrate topography is indicated by line type: RSD (solid), TSD (dashed), RTR (dotted) and TTR (dash-dotted).
For the flow conditions that produced a series of capillary waves prior to the topography, the axial spacing between successive capillary waves up to and including the capillary ridge is presented in figure 12, with each spacing plotted at the axial midpoint between the two wave crests. The TSD topography did not produce a series of capillary waves regardless of flow condition, so data are not included for that shape. The trough topographies also produced capillary waves downstream of the capillary ridge, and those will be analysed and discussed below when examining the transient response of the free surface. For a majority of the waves that exist prior to the onset of topography, the axial spacing between crests is in the range
 $x/L=0.3$
to
$x/L=0.3$
to
 $x/L=0.35$
, which is approximately half of the axial capillary length presented in table 1. Figure 12 reveals that the lowest flow rate for each topography produces a free surface with the longest series of capillary waves, again pointing to the balance between inertial and surface tension effects for the lowest flow rate. In a previous study of film flow over 2-D planar topography, the axial length of the capillary ridge was estimated in the range
$x/L=0.35$
, which is approximately half of the axial capillary length presented in table 1. Figure 12 reveals that the lowest flow rate for each topography produces a free surface with the longest series of capillary waves, again pointing to the balance between inertial and surface tension effects for the lowest flow rate. In a previous study of film flow over 2-D planar topography, the axial length of the capillary ridge was estimated in the range
 $5$
–
$5$
–
 $10$
times the Nusselt thickness (Bontozoglou & Serifi Reference Bontozoglou and Serifi2008), which compares well with the axial length of the capillary waves evident in figure 7 and analysed in figure 12 when considering the Nusselt thickness presented in table 1.
$10$
times the Nusselt thickness (Bontozoglou & Serifi Reference Bontozoglou and Serifi2008), which compares well with the axial length of the capillary waves evident in figure 7 and analysed in figure 12 when considering the Nusselt thickness presented in table 1.

Figure 12. Axial spacing normalized by
 $L$
between successive capillary crests up to and including the capillary ridge. Substrate topography is indicated by the letter next to each marker: a – RSD, c – RTR and d – TTR. Uncertainty is approximately
$L$
between successive capillary crests up to and including the capillary ridge. Substrate topography is indicated by the letter next to each marker: a – RSD, c – RTR and d – TTR. Uncertainty is approximately
 $0.005L$
, which is smaller than the resolution of the figure so uncertainty bars are omitted for clarity.
$0.005L$
, which is smaller than the resolution of the figure so uncertainty bars are omitted for clarity.
A characteristic length scale was investigated for the axial spacing presented in figure 12 based upon that proposed for planar film flow over step down topography (Kalliadasis et al. Reference Kalliadasis, Bielarz and Homsy2000; Mazouchi & Homsy Reference Mazouchi and Homsy2001; Bontozoglou & Serifi Reference Bontozoglou and Serifi2008). When inertia is negligible, the capillary wavelength was found to be
 $h_N/Ca^{1/3}$
, where
$h_N/Ca^{1/3}$
, where
 $Ca$
is the capillary number defined as
$Ca$
is the capillary number defined as
 $Ca=\rho g h^{2}_{N}/\sigma$
for gravity-driven film flow (Kalliadasis et al. Reference Kalliadasis, Bielarz and Homsy2000; Mazouchi & Homsy Reference Mazouchi and Homsy2001). As the Reynolds number increases and the effects of inertia become stronger, the capillary wavelength is predicted to change to either
$Ca=\rho g h^{2}_{N}/\sigma$
for gravity-driven film flow (Kalliadasis et al. Reference Kalliadasis, Bielarz and Homsy2000; Mazouchi & Homsy Reference Mazouchi and Homsy2001). As the Reynolds number increases and the effects of inertia become stronger, the capillary wavelength is predicted to change to either
 $h_N/(Re\,Ca)^{1/2}$
or
$h_N/(Re\,Ca)^{1/2}$
or
 $h_N/Ca^{1/2}$
(Bontozoglou & Serifi Reference Bontozoglou and Serifi2008). Previous work in film flow over planar corrugated plates (Trifonov Reference Trifonov2007; Nguyen & Bontozoglou Reference Nguyen and Bontozoglou2011) and within corrugated pipes (Kuehner et al. Reference Kuehner, Mitchell and Lee2019, 2021; Kuehner Reference Kuehner2022) has utilized the capillary wavelength of
$h_N/Ca^{1/2}$
(Bontozoglou & Serifi Reference Bontozoglou and Serifi2008). Previous work in film flow over planar corrugated plates (Trifonov Reference Trifonov2007; Nguyen & Bontozoglou Reference Nguyen and Bontozoglou2011) and within corrugated pipes (Kuehner et al. Reference Kuehner, Mitchell and Lee2019, 2021; Kuehner Reference Kuehner2022) has utilized the capillary wavelength of
 $h_N/Ca^{1/2}$
when effects of inertia are significant, which results in the capillary length scale relations presented in table 1. All three scaling arguments were applied to the data in figure 12 using the predicted Nusselt thickness for film flow over an inclined plate, as well as using the actual film thickness measured upstream of the topography at
$h_N/Ca^{1/2}$
when effects of inertia are significant, which results in the capillary length scale relations presented in table 1. All three scaling arguments were applied to the data in figure 12 using the predicted Nusselt thickness for film flow over an inclined plate, as well as using the actual film thickness measured upstream of the topography at
 $x/L=-1.5$
; however, none of the length scales collapsed the findings, in particular for the capillary waves that exist near or downstream of the onset of the topography for which there is greater dispersion in the data. The incompatibility of the planar scaling for the axial spacing of capillary waves in circular pipes can be attributed to the additional factors that are not present in the planar cases. In particular, the surface tension effects and non-uniform depth of the film in the lateral direction significantly impact the development of the film flow upstream of, within, and downstream of the topography. While attempts at scaling are limited without data in the lateral plane, the findings in figure 12 reveal that there might be three different capillary wave modes: a short wave mode for the axial spacing grouped within
$x/L=-1.5$
; however, none of the length scales collapsed the findings, in particular for the capillary waves that exist near or downstream of the onset of the topography for which there is greater dispersion in the data. The incompatibility of the planar scaling for the axial spacing of capillary waves in circular pipes can be attributed to the additional factors that are not present in the planar cases. In particular, the surface tension effects and non-uniform depth of the film in the lateral direction significantly impact the development of the film flow upstream of, within, and downstream of the topography. While attempts at scaling are limited without data in the lateral plane, the findings in figure 12 reveal that there might be three different capillary wave modes: a short wave mode for the axial spacing grouped within
 $x/L\approx 0.15$
and
$x/L\approx 0.15$
and
 $x/L\approx 0.25$
, a second short wave mode for the axial spacing grouped within
$x/L\approx 0.25$
, a second short wave mode for the axial spacing grouped within
 $x/L\approx 0.3$
and
$x/L\approx 0.3$
and
 $x/L\approx 0.4$
, and a longer wave mode for the axial spacing exceeding
$x/L\approx 0.4$
, and a longer wave mode for the axial spacing exceeding
 $x/L=0.5$
. Previous studies of film flow over planar corrugated plates have revealed the existence of short and long wave modes (Plumerault et al. Reference Plumerault, Astruc and Thual2010; Cao et al. Reference Cao, Vlachogiannis and Bontozoglou2013). Before characteristic length scales can be determined, further observations of the film flow behaviour in the spanwise direction is needed to understand the ways in which the spanwise extent of the film impacts the axial spacing of capillary waves, and whether these different modes exist.
$x/L=0.5$
. Previous studies of film flow over planar corrugated plates have revealed the existence of short and long wave modes (Plumerault et al. Reference Plumerault, Astruc and Thual2010; Cao et al. Reference Cao, Vlachogiannis and Bontozoglou2013). Before characteristic length scales can be determined, further observations of the film flow behaviour in the spanwise direction is needed to understand the ways in which the spanwise extent of the film impacts the axial spacing of capillary waves, and whether these different modes exist.
3.2. Transient free surface response
As one motivation for the current work was to investigate whether there are elements of the film flow over isolated topography that might lead to or contribute to the periodic flow in corrugated circular pipes, we examine the transient free surface response to isolated topography. There are no similar reports on transient response in film flow over 2-D or 3-D planar isolated topography, so comparisons will be limited to previous film flow studies in corrugated circular pipes. To estimate the transient free surface response, the root mean square amplitude of the time series of free surface elevation in the radial direction is calculated at each point along the free surface to provide a measure of the peak amplitude
 $A^{ }_{t}$
of the transient free surface fluctuations, similar to the methods applied previously (Kuehner et al. Reference Kuehner, Lee, Dodson, Schirmer, Vela de la Garza Evia and Kutelak2021; Kuehner Reference Kuehner2022). The axial distribution of the peak amplitude normalized by the amplitude of the substrate is presented in figure 13 over the axial region in the vicinity of the isolated topography. The measurement uncertainty for peak amplitude is estimated as the uncertainty of a length taken from an image, or
$A^{ }_{t}$
of the transient free surface fluctuations, similar to the methods applied previously (Kuehner et al. Reference Kuehner, Lee, Dodson, Schirmer, Vela de la Garza Evia and Kutelak2021; Kuehner Reference Kuehner2022). The axial distribution of the peak amplitude normalized by the amplitude of the substrate is presented in figure 13 over the axial region in the vicinity of the isolated topography. The measurement uncertainty for peak amplitude is estimated as the uncertainty of a length taken from an image, or
 $0.02a$
. As the peak amplitude in advance of and downstream of the topography outside of the axial limits of figure 13 is at or below the uncertainty, the transient fluctuations are considered negligible in those regions. The gap in the profile for the lowest flow rate
$0.02a$
. As the peak amplitude in advance of and downstream of the topography outside of the axial limits of figure 13 is at or below the uncertainty, the transient fluctuations are considered negligible in those regions. The gap in the profile for the lowest flow rate
 $Re=69$
in figure 13(a) will be discussed further below in relation to the steady overhang. For the step down topographies in figures 13(a) and 13(b), the peak amplitude rises to a maximum in the region near
$Re=69$
in figure 13(a) will be discussed further below in relation to the steady overhang. For the step down topographies in figures 13(a) and 13(b), the peak amplitude rises to a maximum in the region near
 $x/L=0.5$
where the time-averaged free surface slows its descent and turns back towards the axial centreline to flow along the outer radius of the pipe, which aligns with an inflection point of the descending time-averaged free surface. This inflection point in the free surface would impose an adverse pressure gradient from low surface pressure to high surface pressure that could destabilize the flow and produce the resulting free surface fluctuations.
$x/L=0.5$
where the time-averaged free surface slows its descent and turns back towards the axial centreline to flow along the outer radius of the pipe, which aligns with an inflection point of the descending time-averaged free surface. This inflection point in the free surface would impose an adverse pressure gradient from low surface pressure to high surface pressure that could destabilize the flow and produce the resulting free surface fluctuations.

Figure 13. Amplitude of transient free surface fluctuations normalized by substrate amplitude for (a) RSD, (b) TSD, (c) RTR and (d) TTR topographies. Substrate topography is plotted over a radial scale different from
 $A^{ }_{t}/a$
. Uncertainty in amplitude of transient free surface fluctuations is approximately
$A^{ }_{t}/a$
. Uncertainty in amplitude of transient free surface fluctuations is approximately
 $0.02a$
.
$0.02a$
.
For the trough topographies in figures 13(c) and 13(d), the peak amplitude reaches a maximum near the middle of the trough for the lowest flow rate, and just after the trough ends for the higher flow rates. Comparing with the time-averaged free surface profiles in figures 7(c) and 7(d), the maxima in figures 13(c) and 13(d) are seen to be just upstream of the location of the capillary ridge that forms as the film rises over the outlet of the trough, again near an inflection point in the time-averaged free surface. The capillary ridge at the exit of the trough imposes an adverse pressure gradient from the low free surface pressure at the lowest upstream elevation to the high free surface pressure at the top of this capillary ridge. For the trough topographies, except for the largest inclination angle for the RTR topography, the axial profile of peak amplitude displays additional local maxima at approximately half the spacing of the capillary waves observable over the entire trough region in figures 7(c) or 7(d). This spacing is approximately half of that documented in figure 12 for many of the capillary waves upstream of the capillary ridge. In comparing the axial location of the local maxima in figures 13(c) and 13(d) to the free surface elevations in figures 7(c) and 7(d), most clearly delineated by the lowest flow rate, the local maxima in peak amplitude of transient free surface fluctuations align with inflection points of the time-averaged free surface elevation at the rise and fall of the series of capillary waves downstream of the entrance to the topography. Similar to the inflection point in the free surface discussed above for the RSD and TSD topographies, and the inflection point prior to the capillary ridge at the exit of the trough, the inflection points in the free surface associated with the crests of capillary waves over the troughs are related to the development of adverse pressure gradients along the free surface. Hence these adverse pressure gradients might lead to the destabilization of the flow at these locations and free surface fluctuations. These axial locations of peak transient amplitude for isolated topography are in contrast to the axial locations of maxima found for the film flow over corrugated circular pipes, which occurred at the location of minimum elevation of the time-averaged free surface rather than at inflection points (Kuehner et al. Reference Kuehner, Mitchell and Lee2019, 2021; Kuehner Reference Kuehner2022). At the highest flow rate and largest inclination angle for the RSD topography, seen in figure 13(a), there is a rise in the amplitude of transient free surface fluctuations at approximately
 $x/L=0.25$
. This increase in transient behaviour does not correspond to an inflection point in the time-averaged free surface as found for all other local maxima, and is indicative of a different unsteady free surface behaviour discussed further below.
$x/L=0.25$
. This increase in transient behaviour does not correspond to an inflection point in the time-averaged free surface as found for all other local maxima, and is indicative of a different unsteady free surface behaviour discussed further below.
A review of the time series of instantaneous images reveals that the unsteady behaviour evident in figure 13 is often detectable as a transient axial shift in the location of depressions prior to capillary waves combined with a transient variation in amplitude of the depressions. An example of these trends is provided in figure 14 for the film flow over RTR topography for
 $Re=69$
and
$Re=69$
and
 $\alpha =15.3^{\circ }$
. There is minimal variation in free surface elevation upstream or downstream of the topography over the time interval presented. As indicated by the amplitude of transient free surface fluctuations, also included in figure 14, the free surface curvature varies in time most notably over the trough. The depression in the free surface near
$\alpha =15.3^{\circ }$
. There is minimal variation in free surface elevation upstream or downstream of the topography over the time interval presented. As indicated by the amplitude of transient free surface fluctuations, also included in figure 14, the free surface curvature varies in time most notably over the trough. The depression in the free surface near
 $x/L=0.5$
ahead of the capillary ridge at the exit of the topography moves downstream over
$x/L=0.5$
ahead of the capillary ridge at the exit of the topography moves downstream over
 $0.04$
s, then moves further downstream and decreases in elevation over the next
$0.04$
s, then moves further downstream and decreases in elevation over the next
 $0.04$
s. The two peaks in the amplitude of transient free surface fluctuations associated with the movement of this depression align with the furthest upstream and downstream locations of this particular depression over the course of the data set. The peak in transient free surface fluctuations near
$0.04$
s. The two peaks in the amplitude of transient free surface fluctuations associated with the movement of this depression align with the furthest upstream and downstream locations of this particular depression over the course of the data set. The peak in transient free surface fluctuations near
 $x/L=0.5$
has a larger magnitude than that near
$x/L=0.5$
has a larger magnitude than that near
 $x/L=0.35$
because the elevation of the depression varies more significantly near
$x/L=0.35$
because the elevation of the depression varies more significantly near
 $x/L=0.5$
, whereas the depression primarily moves axially at the farthest upstream location near
$x/L=0.5$
, whereas the depression primarily moves axially at the farthest upstream location near
 $x/L=0.35$
. Depressions in the free surface such as these are associated with locally low pressure at the free surface due to surface tension effects, and these lower-pressure regions move axially and vary in elevation to a larger extent when compared to the high pressure region just downstream at the top of the next capillary wave. Hence the relatively high pressure at the peaks of capillary waves provides more stable flow features, in both magnitude and location, compared to the low-pressure regions in the depressions. Further upstream in the trough near
$x/L=0.35$
. Depressions in the free surface such as these are associated with locally low pressure at the free surface due to surface tension effects, and these lower-pressure regions move axially and vary in elevation to a larger extent when compared to the high pressure region just downstream at the top of the next capillary wave. Hence the relatively high pressure at the peaks of capillary waves provides more stable flow features, in both magnitude and location, compared to the low-pressure regions in the depressions. Further upstream in the trough near
 $x/L=0.15$
and
$x/L=0.15$
and
 $x/L=0.25$
, the peaks in the amplitude of transient free surface fluctuations correspond to the axial motion of the depression between the capillary ridge at the entrance to the topography and the smaller capillary peak that resides near the middle of the trough; however, for the instantaneous sequence presented in figure 14, this depression does not move as significantly as the depression near
$x/L=0.25$
, the peaks in the amplitude of transient free surface fluctuations correspond to the axial motion of the depression between the capillary ridge at the entrance to the topography and the smaller capillary peak that resides near the middle of the trough; however, for the instantaneous sequence presented in figure 14, this depression does not move as significantly as the depression near
 $x/L=0.35$
to
$x/L=0.35$
to
 $x/L=0.5$
.
$x/L=0.5$
.

Figure 14. Instantaneous absolute free surface elevation normalized by substrate amplitude for RTR topography,
 $Re=69$
and
$Re=69$
and
 $\alpha =15.3^{\circ }$
at
$\alpha =15.3^{\circ }$
at
 $t^{ }_{o}$
(solid line),
$t^{ }_{o}$
(solid line),
 $t^{ }_{o}+0.04\,\text{s}$
(dashed line) and
$t^{ }_{o}+0.04\,\text{s}$
(dashed line) and
 $t^{ }_{o}+0.08\,\text{s}$
(dash-dotted line). A three-point moving average is applied to absolute free surface elevation data to improve clarity. The amplitude of transient free surface fluctuations normalized by substrate amplitude from figure 13(a) is plotted on a different radial scale for comparison (dotted line). Substrate topography is shown as a grey line. Uncertainty in substrate location is approximately
$t^{ }_{o}+0.08\,\text{s}$
(dash-dotted line). A three-point moving average is applied to absolute free surface elevation data to improve clarity. The amplitude of transient free surface fluctuations normalized by substrate amplitude from figure 13(a) is plotted on a different radial scale for comparison (dotted line). Substrate topography is shown as a grey line. Uncertainty in substrate location is approximately
 $0.08a$
, and in absolute free surface elevation is approximately
$0.08a$
, and in absolute free surface elevation is approximately
 $0.02a$
.
$0.02a$
.
The gap in the amplitude of transient free surface fluctuations within the axial range
 $x/L=0.15$
to
$x/L=0.15$
to
 $x/L=0.55$
for
$x/L=0.55$
for
 $Re=69$
for the RSD topography in figure 13(a) relates to the overhang in the time-averaged free surface profile. To account for the overhang, the method of determining the transient amplitude in this region had to be modified. In the region near the overhang, the transient free surface is captured as a fluctuation in the axial direction instead of the radial direction that is used at all other locations. Figure 15 presents the radial variation in the amplitude of transient free surface fluctuations for the region of the time-averaged free surface associated with the overhang. The magnitude of the transient free surface fluctuations in this region is similar to that produced elsewhere at these flow conditions, as presented in figure 13(a), and rises to a maximum near the sharp curvature in the time-averaged free surface profile in a manner similar to the correspondence between local maxima and inflection points elsewhere in the free surface. If the steady overhang is considered to form in response to the film flow extending further past the step face than it would in a planar flow, then the high pressure that would exist at the axial peak of the steady overhang near
$Re=69$
for the RSD topography in figure 13(a) relates to the overhang in the time-averaged free surface profile. To account for the overhang, the method of determining the transient amplitude in this region had to be modified. In the region near the overhang, the transient free surface is captured as a fluctuation in the axial direction instead of the radial direction that is used at all other locations. Figure 15 presents the radial variation in the amplitude of transient free surface fluctuations for the region of the time-averaged free surface associated with the overhang. The magnitude of the transient free surface fluctuations in this region is similar to that produced elsewhere at these flow conditions, as presented in figure 13(a), and rises to a maximum near the sharp curvature in the time-averaged free surface profile in a manner similar to the correspondence between local maxima and inflection points elsewhere in the free surface. If the steady overhang is considered to form in response to the film flow extending further past the step face than it would in a planar flow, then the high pressure that would exist at the axial peak of the steady overhang near
 $h/a=0.8$
would be followed by a lower surface pressure in the sharp curvature of the portion of the film that recedes axially towards the step face near
$h/a=0.8$
would be followed by a lower surface pressure in the sharp curvature of the portion of the film that recedes axially towards the step face near
 $h/a=0$
. This low-pressure region is susceptible to disturbance, leading to the increase in transient free surface fluctuations in this region.
$h/a=0$
. This low-pressure region is susceptible to disturbance, leading to the increase in transient free surface fluctuations in this region.

Figure 15. Amplitude of transient free surface fluctuations normalized by substrate amplitude for the radial portion of the time-averaged absolute free surface elevation for the RSD topography,
 $Re=69$
and
$Re=69$
and
 $\alpha =15.3^{\circ }$
. Time-averaged absolute free surface elevation and substrate topography, shown as a grey line, are plotted over an axial scale different from
$\alpha =15.3^{\circ }$
. Time-averaged absolute free surface elevation and substrate topography, shown as a grey line, are plotted over an axial scale different from
 $A^{ }_{t}/a$
. Uncertainty in amplitude of transient free surface fluctuations is approximately
$A^{ }_{t}/a$
. Uncertainty in amplitude of transient free surface fluctuations is approximately
 $0.02a$
.
$0.02a$
.
To determine the effect of flow condition and topography on the peak amplitude of the transient free surface fluctuations, the maximum amplitude
 $A^{ }_{t,max}$
for each flow condition and topography is presented in figure 16. The maximum amplitude produced in circular pipes with isolated topography is approximately half of the maximum observed in corrugated circular pipes (Kuehner Reference Kuehner2022). This comparison aligns with the expectations that the periodic travelling waves in film flows over corrugations arise due to a resonance (Plumerault et al. Reference Plumerault, Astruc and Thual2010); hence the film response to corrugations would be expected to be of larger magnitude than that for isolated topography. Overall, the RSD topography produces the largest transient free surface fluctuations, and for the step down topographies, the magnitude generally increases with flow rate and inclination angle, which corresponds with increased kinetic energy entering the topography and leading to larger free surface fluctuations. In previous work, triangular corrugations generated larger peak amplitudes than rectangular corrugations (Kuehner Reference Kuehner2022); however, the enhanced importance of capillary features caused by the isolated turns in the current substrates compared to the corrugated circular pipes leads to the isolated RSD topography producing larger features with larger transient fluctuations than the isolated TSD topography.
$A^{ }_{t,max}$
for each flow condition and topography is presented in figure 16. The maximum amplitude produced in circular pipes with isolated topography is approximately half of the maximum observed in corrugated circular pipes (Kuehner Reference Kuehner2022). This comparison aligns with the expectations that the periodic travelling waves in film flows over corrugations arise due to a resonance (Plumerault et al. Reference Plumerault, Astruc and Thual2010); hence the film response to corrugations would be expected to be of larger magnitude than that for isolated topography. Overall, the RSD topography produces the largest transient free surface fluctuations, and for the step down topographies, the magnitude generally increases with flow rate and inclination angle, which corresponds with increased kinetic energy entering the topography and leading to larger free surface fluctuations. In previous work, triangular corrugations generated larger peak amplitudes than rectangular corrugations (Kuehner Reference Kuehner2022); however, the enhanced importance of capillary features caused by the isolated turns in the current substrates compared to the corrugated circular pipes leads to the isolated RSD topography producing larger features with larger transient fluctuations than the isolated TSD topography.

Figure 16. The dependence of maximum amplitude of transient free surface fluctuations normalized by substrate amplitude on topography shape.
As noted above in reference to figure 13(a) for the cases
 $Re=125$
,
$Re=125$
,
 $\alpha =15.3^{\circ }$
and
$\alpha =15.3^{\circ }$
and
 $Re=97$
,
$Re=97$
,
 $\alpha =20.3^{\circ }$
, there is a rise in the amplitude of transient free surface fluctuations near
$\alpha =20.3^{\circ }$
, there is a rise in the amplitude of transient free surface fluctuations near
 $x/L=0.25$
. During the data collection process, it was noted that for brief moments in time, an extra ridge of fluid would develop on top of the capillary ridge. The extra ridge was a small feature but observable by eye. Figure 17 displays example fluorescence images for the highest flow rate case presented on a logarithmic scale for fluorescence intensity to add clarity. The images include the location of the substrate topography (red line) and the time-averaged free surface profile (purple line) from figure 6(a) for reference. The extra ridge is observed at
$x/L=0.25$
. During the data collection process, it was noted that for brief moments in time, an extra ridge of fluid would develop on top of the capillary ridge. The extra ridge was a small feature but observable by eye. Figure 17 displays example fluorescence images for the highest flow rate case presented on a logarithmic scale for fluorescence intensity to add clarity. The images include the location of the substrate topography (red line) and the time-averaged free surface profile (purple line) from figure 6(a) for reference. The extra ridge is observed at
 $x/L=0.25$
as an elevation above the time-averaged free surface profile. As displayed in figure 17(a), due to the small radius of curvature for this extra ridge, the shape of the fluorescence captured within the extra ridge is highly distorted even though visual observations of the phenomenon indicated that the extra ridge has curvature similar to the capillary ridge with a shorter axial extent. As noted in § 2.2, the appearance of the extra ridge required a modification to the c.d.f.-based method of edge detection to include a hybrid Canny approach for these two data sets. To our knowledge, there is no comparable phenomenon to this extra ridge observed in film flow over 2-D or 3-D planar topography. The limited temporal scale of these occurrences is highlighted by the time difference between the images in figures 17(a) and 17(b), when the extra ridge has disappeared. These are sequential images from the same time series, hence the time separation is
$x/L=0.25$
as an elevation above the time-averaged free surface profile. As displayed in figure 17(a), due to the small radius of curvature for this extra ridge, the shape of the fluorescence captured within the extra ridge is highly distorted even though visual observations of the phenomenon indicated that the extra ridge has curvature similar to the capillary ridge with a shorter axial extent. As noted in § 2.2, the appearance of the extra ridge required a modification to the c.d.f.-based method of edge detection to include a hybrid Canny approach for these two data sets. To our knowledge, there is no comparable phenomenon to this extra ridge observed in film flow over 2-D or 3-D planar topography. The limited temporal scale of these occurrences is highlighted by the time difference between the images in figures 17(a) and 17(b), when the extra ridge has disappeared. These are sequential images from the same time series, hence the time separation is
 $0.02$
seconds. As further evidence that this extra ridge is an infrequent occurrence, the time-averaged free surface response is primarily unaffected by the occasional addition of the extra ridge elevation.
$0.02$
seconds. As further evidence that this extra ridge is an infrequent occurrence, the time-averaged free surface response is primarily unaffected by the occasional addition of the extra ridge elevation.
As capillary waves, and in particular, the capillary ridge at the entrance to the topography, form to develop a pressure gradient to turn the flow and maintain contact with the downstream face of the step, this extra ridge atop the capillary ridge likely forms for similar reason. Considering that the extra ridge forms only for flow conditions that produce a capillary ridge beyond the onset of topography, the capillary ridge exists atop a volume of fluid that would not be present in a similar planar case. The extra ridge would develop an increased free surface pressure at its peak above that which would occur at the top of the capillary ridge alone, forcing the flow to turn downwards further upstream than it otherwise would. Evidence of this effect is displayed in figure 17(a), as the film just downstream of the extra ridge is turned downwards ahead of the time-averaged free surface location; whereas in figure 17(b), the free surface extends beyond the time-averaged free surface location both near the end of the capillary ridge near
 $h/a=1.5$
and as the free surface turns away from the topography near
$h/a=1.5$
and as the free surface turns away from the topography near
 $h/a=-0.5$
.
$h/a=-0.5$
.

Figure 17. Instantaneous fluorescence images of film flow over RSD topography for
 $Re=125$
,
$Re=125$
,
 $\alpha =15.3^{\circ }$
, with (a) extra ridge evident and (b) extra ridge not evident. Image intensity is plotted on a logarithmic scale for clarity. The red line indicates the approximated location of the substrate, and the purple line represents the time-averaged free surface profile presented in figures 6 and 7. The fluorescence within the volume of the film is viewed through the non-uniform free surface, causing a distortion that makes the bottom of the water appear detached from the substrate.
$\alpha =15.3^{\circ }$
, with (a) extra ridge evident and (b) extra ridge not evident. Image intensity is plotted on a logarithmic scale for clarity. The red line indicates the approximated location of the substrate, and the purple line represents the time-averaged free surface profile presented in figures 6 and 7. The fluorescence within the volume of the film is viewed through the non-uniform free surface, causing a distortion that makes the bottom of the water appear detached from the substrate.
The extra ridge for the case
 $Re=125$
and
$Re=125$
and
 $\alpha =15.3^{\circ }$
presented in figure 17 tended to have large relative elevation. For example, the extra ridge in figure 17(a) has an elevation above the capillary ridge that is approximately equivalent to the elevation of the capillary ridge above the upstream incoming film thickness. A wider range of behaviour was observed for the case
$\alpha =15.3^{\circ }$
presented in figure 17 tended to have large relative elevation. For example, the extra ridge in figure 17(a) has an elevation above the capillary ridge that is approximately equivalent to the elevation of the capillary ridge above the upstream incoming film thickness. A wider range of behaviour was observed for the case
 $Re=97$
and
$Re=97$
and
 $\alpha =20.3^{\circ }$
displayed in figure 18, where the intensity is again presented on a logarithmic scale, and the time-averaged free surface profile from figure 6(a) is shown in pink. Similar to the previous case, the flow conditions in figure 18 produce a capillary ridge that is downstream of the onset of topography. For the largest inclination angle, the elevation of the extra ridge was less often pronounced and instead expanded over a longer axial range than for
$\alpha =20.3^{\circ }$
displayed in figure 18, where the intensity is again presented on a logarithmic scale, and the time-averaged free surface profile from figure 6(a) is shown in pink. Similar to the previous case, the flow conditions in figure 18 produce a capillary ridge that is downstream of the onset of topography. For the largest inclination angle, the elevation of the extra ridge was less often pronounced and instead expanded over a longer axial range than for
 $Re=125$
and
$Re=125$
and
 $\alpha =15.3^{\circ }$
. As seen in figure 18(a), the broad extra ridge reduced to a smaller extra ridge in figure 18(b) within
$\alpha =15.3^{\circ }$
. As seen in figure 18(a), the broad extra ridge reduced to a smaller extra ridge in figure 18(b) within
 $0.08$
s, before disappearing
$0.08$
s, before disappearing
 $0.08$
s later in figure 18(c), only to reappear wider and further upstream
$0.08$
s later in figure 18(c), only to reappear wider and further upstream
 $0.04$
s later in figure 18(d). Careful examination of the free surface of the downward slope following the capillary ridge reveals that the appearance of the extra ridge might coincide with variations in the number of capillary undulations along the free surface downstream of the capillary ridge. For example, in figure 18(a), the free surface includes more undulations on the downward slope when the extra ridge is present, in comparison to figure 18(c) when the extra ridge is absent. Similar but to a lesser degree than the previous case in figure 17, the falling edge of the capillary ridge is upstream of the time-averaged free surface when the extra ridge is present, as seen in figures 18(a) and 18(d), as compared to figure 18(c) when the extra ridge is missing. As there is a considerable range of spatial behaviour within a short time scale, and as there is no known comparison to this phenomenon in film flow over similar planar topography, the behaviour of this extra ridge merits additional attention to further characterize the conditions for which it occurs, to examine the transient behaviour, and to possibly identify the impetus for its formation.
$0.04$
s later in figure 18(d). Careful examination of the free surface of the downward slope following the capillary ridge reveals that the appearance of the extra ridge might coincide with variations in the number of capillary undulations along the free surface downstream of the capillary ridge. For example, in figure 18(a), the free surface includes more undulations on the downward slope when the extra ridge is present, in comparison to figure 18(c) when the extra ridge is absent. Similar but to a lesser degree than the previous case in figure 17, the falling edge of the capillary ridge is upstream of the time-averaged free surface when the extra ridge is present, as seen in figures 18(a) and 18(d), as compared to figure 18(c) when the extra ridge is missing. As there is a considerable range of spatial behaviour within a short time scale, and as there is no known comparison to this phenomenon in film flow over similar planar topography, the behaviour of this extra ridge merits additional attention to further characterize the conditions for which it occurs, to examine the transient behaviour, and to possibly identify the impetus for its formation.

Figure 18. Instantaneous fluorescence images of film flow over RSD topography for
 $Re=97$
,
$Re=97$
,
 $\alpha =20.3^{\circ }$
, with (a,b,d) extra ridge evident, and (c) extra ridge not evident. Image intensity is plotted on a logarithmic scale for clarity. The red line indicates the approximated location of the substrate, and the pink line represents the time-averaged free surface profile presented in figures 6 and 7. The fluorescence within the volume of the film is viewed through the non-uniform free surface, causing a distortion that makes the bottom of the water appear detached from the substrate.
$\alpha =20.3^{\circ }$
, with (a,b,d) extra ridge evident, and (c) extra ridge not evident. Image intensity is plotted on a logarithmic scale for clarity. The red line indicates the approximated location of the substrate, and the pink line represents the time-averaged free surface profile presented in figures 6 and 7. The fluorescence within the volume of the film is viewed through the non-uniform free surface, causing a distortion that makes the bottom of the water appear detached from the substrate.
As performed for previous film flows in corrugated circular pipes (Kuehner et al. Reference Kuehner, Mitchell and Lee2019, 2021; Kuehner Reference Kuehner2022), a frequency analysis was applied to the transient free surface behaviour. However, in contrast to the periodicity that was evident in the film flow in corrugated circular pipes for all flow conditions and topographies, there were no cases of isolated topography that produced an indication of periodic behaviour in the range of frequencies examined, up to
 $25$
Hz, even for those flow conditions that produced the extra ridge of fluid. Hence the variations in the capillary waves discussed in reference to figure 13 and observed in figure 14, and the extra ridge that generated transient free surface fluctuations shown in figures 17 and 18, were not associated with periodic behaviour. With the aim of potentially identifying substrate geometries for which periodic behaviour emerges, we look towards a study of topographies that incorporate an intermediate geometric pattern, such as those including 2–10 troughs, to bridge the gap between these isolated topographies and the corrugated circular pipes studied previously. In addition, we plan to construct circular pipes out of optically pure materials to permit imaging of the film behaviour beneath the free surface, similar to that achieved in planar flows, which would afford a better understanding of the flow phenomena affecting the free surface behaviour.
$25$
Hz, even for those flow conditions that produced the extra ridge of fluid. Hence the variations in the capillary waves discussed in reference to figure 13 and observed in figure 14, and the extra ridge that generated transient free surface fluctuations shown in figures 17 and 18, were not associated with periodic behaviour. With the aim of potentially identifying substrate geometries for which periodic behaviour emerges, we look towards a study of topographies that incorporate an intermediate geometric pattern, such as those including 2–10 troughs, to bridge the gap between these isolated topographies and the corrugated circular pipes studied previously. In addition, we plan to construct circular pipes out of optically pure materials to permit imaging of the film behaviour beneath the free surface, similar to that achieved in planar flows, which would afford a better understanding of the flow phenomena affecting the free surface behaviour.
4. Conclusions
Gravity-driven film flow over isolated topography in circular pipes was investigated for a range of flow rates, inclination angles and topography shapes. The topography shapes were selected so that potential connections with the film flow response to periodic corrugations studied previously could be investigated. The time-averaged free surface of the thin film is affected by flow rate, inclination angle and topography shape, which aligns with similar effects found in film flow over corrugated circular pipes. For some flow conditions, a capillary ridge develops near the start of the topography, with a series of upstream capillary waves observed for a subset of those conditions. The capillary ridge has similar dependencies on flow rate and inclination angle as seen for film flows over 2-D and 3-D planar topography; however, the capillary ridge often forms downstream of the onset of topography in circular pipes, in contrast to the 2-D and 3-D planar cases for which the capillary ridge always precedes the topography. For the RSD topography at the lowest flow rate, a steady overhang develops along the downstream face of the topography that has no comparison in film flow over similar 2-D or 3-D planar topography. The variance between the film flow over circular pipes and that over planar cases could be linked to the circumferential spreading of water at the bottom of the step topographies or the filling of the trough topographies, which produces a substantially wider film immediately downstream of the topography compared to that upstream of the topography.
The spatially averaged, time-averaged film thickness in the vicinity of the topography is similar between cases of flow rate and angles of inclination even though the overall curvature of the time-averaged free surface profiles differs considerably. The time-averaged free surface response to the RTR topography is similar in shape and magnitude to the TTR topography, which aligns with the similarity in response to the rectangular and triangular corrugations studied previously (Kuehner Reference Kuehner2022). The elevation of the capillary ridge depends more strongly on topography shape than flow rate or inclination angle, and for the conditions that generate a series of capillary waves upstream of the capillary ridge, the spacing of the waves is comparable to half of the capillary length in a majority of cases. The longest series of capillary waves occurs for the lowest flow rate, indicating the balance between inertial and surface tension effects. In contrast to film flow over 2-D or 3-D planar topography, the capillary waves typically do not descend in elevation before the next capillary wave forms. The axial spacing and length of the capillary waves find good comparison with previous 2-D planar film flow results (Bontozoglou & Serifi Reference Bontozoglou and Serifi2008).
The transient free surface response to isolated topography is negligible upstream or downstream of the isolated topography, varies with flow rate and inclination angle, and has approximately half of the magnitude found for film flow over corrugations in a circular pipe (Kuehner Reference Kuehner2022). The axial profiles of the amplitude of transient free surface fluctuations include local maxima that occur near the inflection points found in the time-averaged free surface, which differs from that seen in film flow over corrugated circular pipes (Kuehner et al. Reference Kuehner, Mitchell and Lee2019, 2021; Kuehner Reference Kuehner2022). The correspondence with inflection points in the time-averaged free surface profile produces local maxima of transient free surface fluctuations that are spaced at half the wavelength of the capillary waves or approximately half the capillary length. Examining sequential instantaneous free surface elevations near the topography reveals that the amplitude of transient free surface fluctuations is related to depressions within the instantaneous free surface moving in the axial direction and varying in elevation.
The axial profiles of the magnitude of transient free surface fluctuations for the RSD topography at the highest flow rate and largest inclination angle include a local maximum that does not correspond to an inflection point in the time-averaged free surface and instead indicates a phenomenon unique to the RSD topography. This phenomenon was discovered to be the result of an extra ridge of fluid infrequently forming on top of the capillary ridge. The extra ridge has a variable axial length and a curvature that is narrower than that observed for any other capillary feature. The extra ridge forms only for flow conditions that produce a capillary ridge that is downstream of the onset of topography. Hence the extra ridge might form to drive the film closer to the downstream face of the topography. This extra ridge finds no comparison in film flow over 2-D or 3-D topography, and merits further examination.
A frequency analysis of the transient film flow behaviour indicates a lack of periodicity anywhere within the film flow, even for the flow conditions that develop large peak magnitudes of transient free surface fluctuations or that generate the extra ridge. This lack of periodicity is expected, as the periodic travelling waves that form over corrugated circular pipes are presumed to develop from a form of resonance that is based on the corrugation spacing, a geometric repetition that does not occur for the isolated topographies studied herein. While there is no clear indication of film flow response to isolated topography that leads to the resonance over corrugations, the current results provide findings that can be studied further for a possible link to the proposed resonance. If the travelling waves in film flow over corrugated circular pipes form from a triple resonance, as posited for the travelling waves in 2-D planar film flow (Plumerault et al. Reference Plumerault, Astruc and Thual2010), then the spacing of capillary waves in the time-averaged free surface and the spacing of the local maxima in the axial profile of peak magnitude of transient free surface fluctuations provide two lengths that might feed into the triple resonance. Regardless of whether these distances are relevant to the resonance, the transient free surface fluctuations measured over the topography offer an ambient source of disturbance that could be magnified by the resonance in the film flow over corrugated circular pipes. This motivates further study of substrates with an intermediate sequence of troughs that might reveal a link between the current findings for isolated topography and the previous findings for corrugated circular pipes.
Acknowledgements.
The authors would like to thank C. Compton for assistance in developing the experimental apparatus and for helpful conversations, D. Pfaff and M. Brown for their support of 3-D printing operations, T. Marcais and K. Steinert for their support of computational processing, and P. Hinely for the loan of photographic equipment. J.P.K. is grateful to E. Kuehner for continued insightful conversations.
Funding.
This research received no specific grant from any funding agency, commercial or not-for-profit sectors.
Declaration of interests.
The authors report no conflict of interest.
Data availability statement.
The data that support the findings of this study are available from the corresponding author (J.P.K.) upon reasonable request.


 Open access