Introduction
Long-term climate variability over coastal Dronning Maud Land (DML), Antarctica, is still poorly known, mostly due to the short instrumental record (<50 years). Ice cores from this area are therefore a valuable source of climatic information, providing high-resolution records on potentially seasonal time-scales.
During the joint European Project for Ice Coring in Antarctica (EPICA) and the Norwegian Antarctic Research Expedition (NARE) 2000/01, a 100m long ice core (S100) was retrieved in the coastal area of DML, in the eastern part of Fimbulisen (Fig. 1) (70˚14′ S, 04˚48′ E; 48ma.s.l.) (Reference Winther and WintherWinther and others, 2002). The core was located at the same site where a 20m long ice core (S20) was drilled 4 years earlier, during NARE 1996/97 (Reference Winther and WintherWinther and others, 1997).
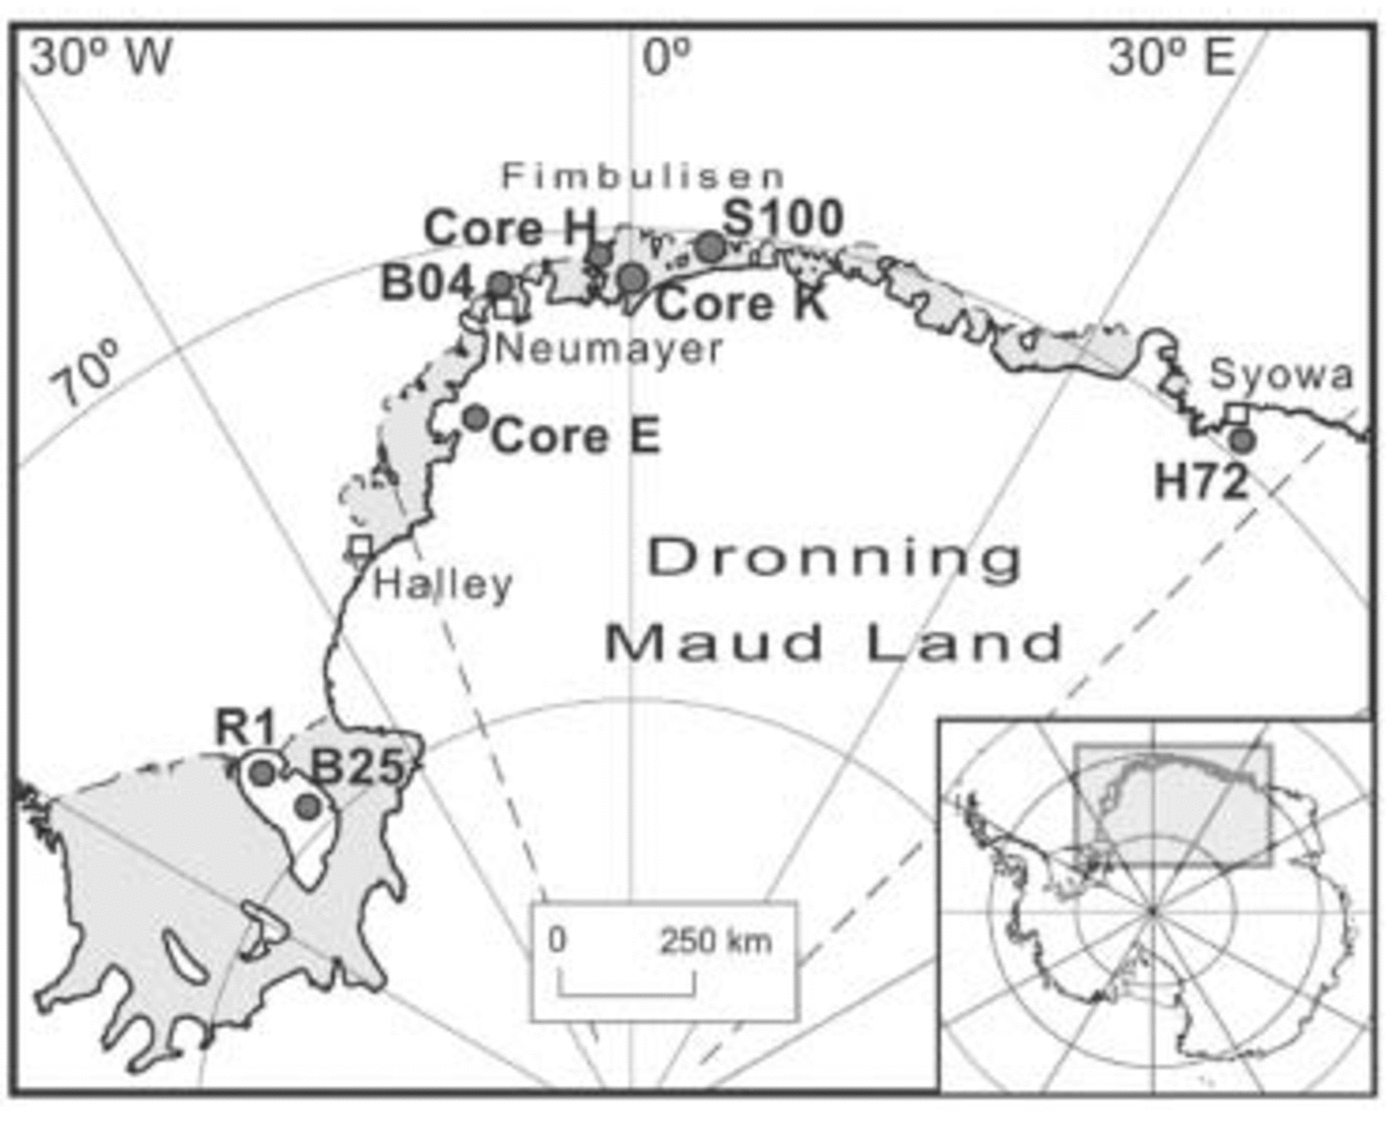
Fig. 1. Location of ice cores S100, B04, E, H, K, H72, R1 and B25 (dark grey circles) and stations Halley, Neumayer and Syowa (empty squares). measurement of individual ice pieces in the field.
In this paper, we present both the dating of, and accumulation variability within, ice core S100. The dating was performed by identification of volcanic horizons in the core electrical record obtained from dielectrical profiling (DEP) and electrical conductivity measurement (ECM), in combination with seasonal layer counting from high-resolution oxygen isotope (δ18O) ratio, DEP and ECM records. This allowed us to derive average accumulation rates for time-spans between identified volcanic horizons, as well as annual accumulation rates from layer counting.
Methods
Field and laboratory methods
The ECM method (Reference HammerHammer, 1980) is a measure of the electrical current from which acidity concentration levels
*Deceased.
may be inferred in ice cores. The current flowing between the electrodes is affected by the acid content and the temperature of the ice, although it is independent of salt concentration (e.g. Moore and others, 1989). ECM was performed in a cold room with stable temperature conditions of approximately –18˚C. Two electrodes with applied voltage of 500 V were moved along a freshly cut ice surface, and a measurement was taken every 2.2 mm.
DEP is a non-destructive method for measuring electrical conductivity and permittivity of ice cores (Reference Moore, Mulvaney and ParenMoore and others, 1989). This technique, which does not require direct contact between the ice and the electrodes, responds to both the acidity and the total salt content in the ice (Reference Wilhelms, Kipfstuhl, Miller, Heinloth and FirestoneWilhelms and others, 1998). The measurement is performed every 5 mm. The density of the ice core was calculated from the DEP-derived capacitance using the complex Looyenga mixing model (Reference Glen and ParenGlen and Paren, 1975), and with a bulk density
Both ECM and DEP data were filtered using a Savitsky–Golay (SG) filter after they had been temperature corrected and the low-frequency components had been removed from the dataset (Fig. 2). The SG filter eliminates peaks created due to random noise or short-term chemistry events but preserves peaks expected from volcanic events. The entire filtering operation is done in the sample domain. We used a SG filter width of 200 points for ECM, and 100 points for DEP. The difference in filter width is due to both sampling interval and differing signal-to-noise ratio of the two datasets. This procedure, described in detail in Karlöf and others (2000), de-trends and smooths the data.
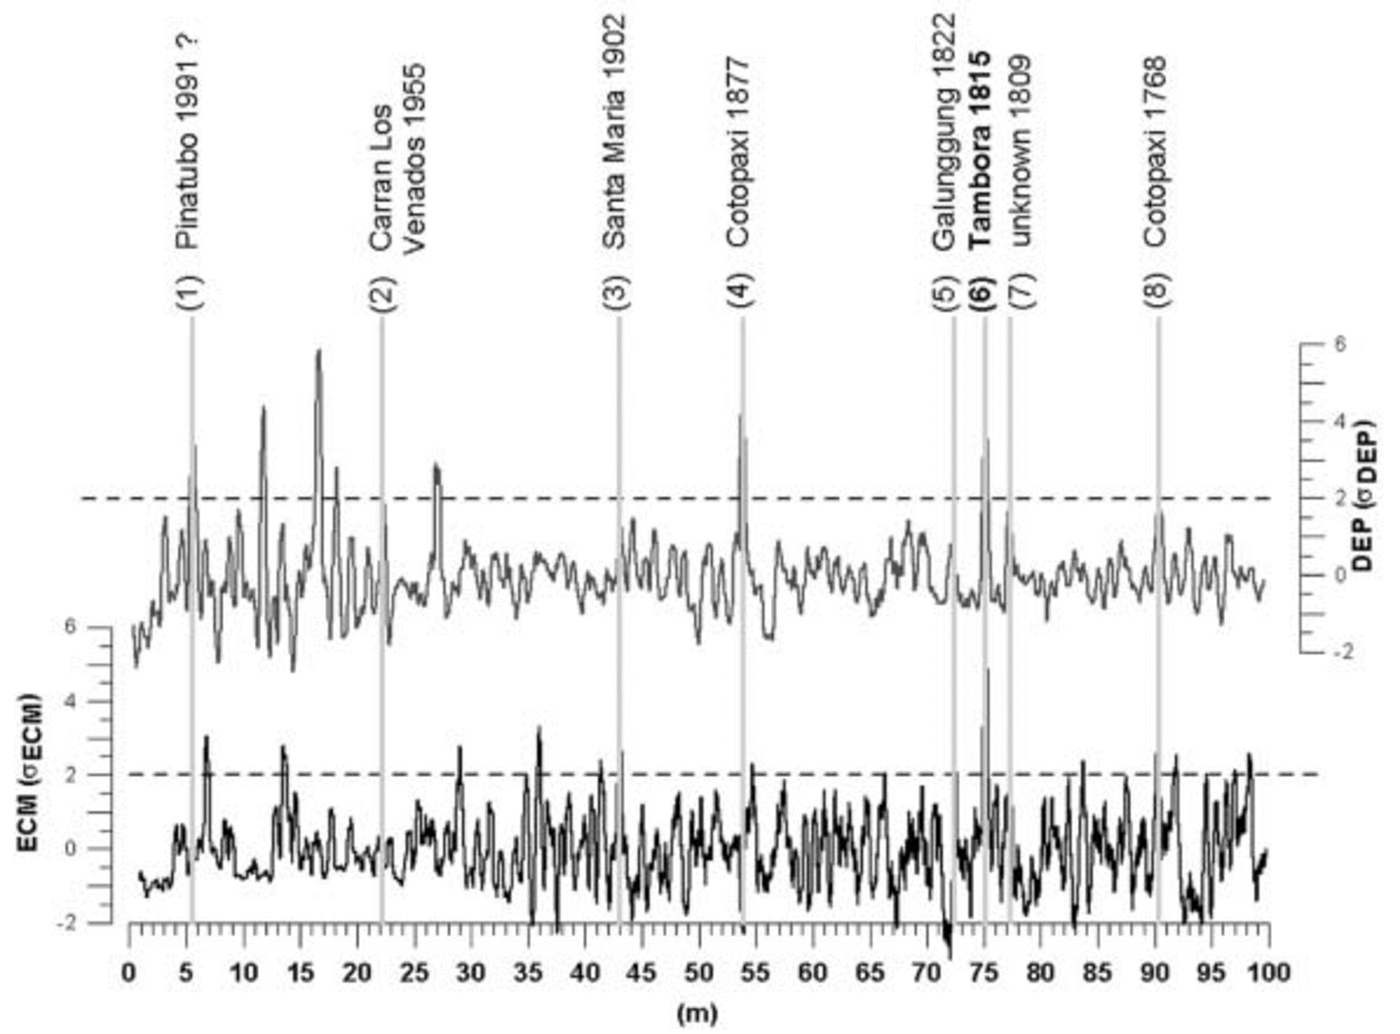
Fig. 2. DEP (upper plot) and ECM (lower plot) conductivity record of ice core S100. Peaks assigned to known volcanic events (volcano and the year of the eruption are marked) and used for dating purposes are numbered. The data are filtered and normalized, and the threshold is established at 2V (dashed line).
The δ18O sampling was also performed in the cold laboratory. Samples, taken every 3 cm, were analyzed by the stable-isotope mass spectrometer (VG ISOGAS) at the University of Copenhagen. This high-resolution record was used for peak counting in order to date ice core S100 independently of DEP and ECM.
Statistical methods
The Significant Zero Crossings of Derivatives (SiZer) method (Reference Marron, Chaudhuri and SadjadiMarron and Chaudhuri, 1998) was used to determine significant trends in accumulation data derived from ice core S100. SiZer is a visualization technique that highlights features observed in a set of smoothed curves through data, which are statistically significant above some chosen threshold and are therefore deemed to be real due to the underlying structure in the dataset, as opposed to being noise artefacts or attributable to sampling variability (Godt-liebsen and others, 2003).
The key idea in SiZer is that significant features are found at different time-scales. For smoothing, local linear regression is used, where the degree of locality is determined by a variable window size on the data. A wide range of time windows is used to find all significant features in a dataset (Reference Godtliebsen, Olsen and WintherGodtliebsen and others, 2003). A SiZer map is the final result of the statistical treatment of the given dataset. This plot shows a feature map as a function of time-scale controlled by the size of the smoothing window (bandwidth h) and location (x) for the signal. For each scale and location of the signal, SiZer tests whether the smooth has a derivative significantly different from zero.
Results and Discussion
Dating
Identification of volcanic horizons
ECM performed on ice cores allows detection of volcanic horizons (e.g. Reference Delmas, Legrand, Aristarain and ZanoliniDelmas and others, 1985; Reference Hammer, Oeschger and LangwayHammer, 1989). However, in the coastal areas of Antarctica the acidity of the ice is also influenced by marine components (Reference Mulvaney and PeelMulvaney and Peel, 1988). Reliable filtering methods are therefore of utmost importance for identifying volcanic peaks in coastal cores.
In the filtered ECM and DEP signal, a 2σ threshold was used to isolate significant peaks (Reference Cole-Dai, Mosley-Thompson and ThompsonCole-Dai and others, 1997; Karlöf and others, 2000). We used the long-term accumulation rate to calculate an approximate depth at which signals of known volcanic events in ECM and DEP records might be present.
Notes: Sources are as follows: 1. Reference Legrand and DelmasLegrand and Delmas (1987); 2. Reference Moore, Narita and MaenoMoore and others (1991); 3. Reference DelmasDelmas and others (1992); 4. Reference Cole-Dai, Mosley-Thompson and ThompsonCole-Dai and others (1997); 5. Reference Isaksson, van den Broeke, Winther, Karlöf, Pinglot and GundestrupIsaksson and others (1999); 6. Reference Cole-Dai, Wight and ThompsonCole-Dai and others (2000); 7. Karlöf and others (2000); ˚. Reference Palmer, van Ommen, Curran, Morgan, Souney and MayewskiPalmer and others (2001); 9. Reference Kohno and FujiiKohno and Fujii (2002); 10. Reference NishioNishio and others (2002); 11. Reference StenniStenni and others (2002); 12. Reference ZhangZhang and others (2002).
We found 9 peaks in DEP and 20 peaks in ECM records which fulfilled the criteria. However, only 8 peaks of this total of 29 could be assigned to known volcanic eruptions (Fig. 2) Peaks corresponding to the dates of volcanic eruptions are reported in Table 1.
Table 1 Volcanic events detected along the S100 ice core
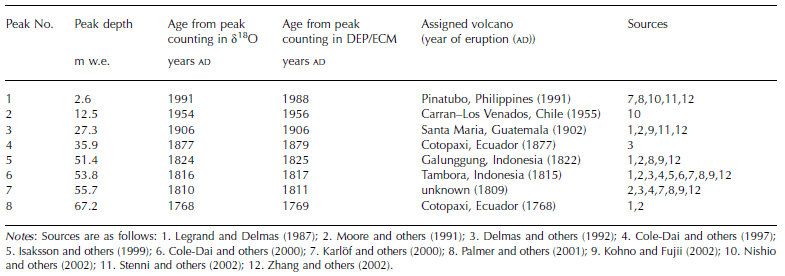
In Antarctica, erupted volcanic material is typically deposited in the surface snow from approximately 0–3 years after the eruption (see sources in Table 1). Most volcanic peaks identified in core S100 occur within this time-frame (TTable 1). Only peak No. 3, assigned to the Santa Maria eruption in AD 1902, is at the depth corresponding to AD 1906, 4 years after the eruption took place; for most Antarctic ice cores the depositional lag is 1–2 years after the year of the eruption (see sources in Table 1).
We have assigned the peak number 1 to the eruption of Pinatubo in AD 1991. According to peak counting in the δ18O data, the age of the firn at this particular depth is probably AD 1988. There are no ECM data for the uppermost part of the ice core, where the ice was of a poor quality and only DEP was performed. The age of this peak is within the dating error of ±3 years.
The most prominent ECM signal, at 75.1 m depth, is assigned to the Tambora eruption in AD 1815. This peak is found in both DEP and ECM records and has a much larger amplitude than other peaks. The age of the ice at the depth of the Tambora peak from layer counting is AD 1816 (δ18O) or AD 1817 (DEP/ECM), in agreement with data from several other ice cores from Antarctica (see sources in Table 1). A peak that precedes Tambora, at 77.3 m depth in our record, is most probably a signal of the eruption of an unknown volcano in AD 1809. In combination with Tambora, this is one of the most characteristic volcanic signals found in Antarctic ice cores (e.g. Reference Cole-Dai, Mosley-Thompson and ThompsonCole-Dai and others, 1997). The age of the ice at this depth is AD 1810 or 1811 (Table 1). We used this peak doublet as our main reference horizon to derive a mean accumulation rate.
Only two other significant peaks were co-located in both DEP and ECM records. One of them, peak No. ˚, was found in both DEP and ECM records at 90.4 m, and was assigned to the eruption of Cotopaxi in AD 1768.
Seasonal peak counting
According to Reference Minikin, Wagenbach, Graf and KipfstuhlMinikin and others (1994), DEP peaks can also represent winter maxima of sea salts, while peaks in ECM respond mostly to summer maxima of nss-sulphate and partly to high values of NO3, MSA and HCl. Reference Hammer, Clausen and LangwayHammer and others (1994) and Reference MulvaneyMulvaney and others (2002) confirm that ECM is a sufficient method to detect both volcanic peaks and seasonal changes in acidity. Seasonal variations of sulphuric acid are related to regional oceanic production of sulphur-rich gases (Reference Mulvaney and PeelMulvaney and Peel, 1988).
We smoothed the raw ECM and DEP data by using a 21-point running mean for DEP and 45-point running mean for ECM curves.
The ECM/DEP peak-counting has been compared with the summer layer counting in the δ18O record (Fig. 3). The relatively high accumulation rate at the drilling site yields sufficiently high-resolution δ18O data for identification of seasonal layer variation. We used the high-resolution δ18O record from core S20 (drilled in 1996/97 at the same site as S100) to cross-check dating of the upper part of S100. Ice core S20 represented the period AD 1955–96, and the mean annual accumulation rate derived from this core is 0.28mw.e. a–1 (Reference Isaksson, van den Broeke, Winther, Karlöf, Pinglot and GundestrupIsaksson and others, 1999).
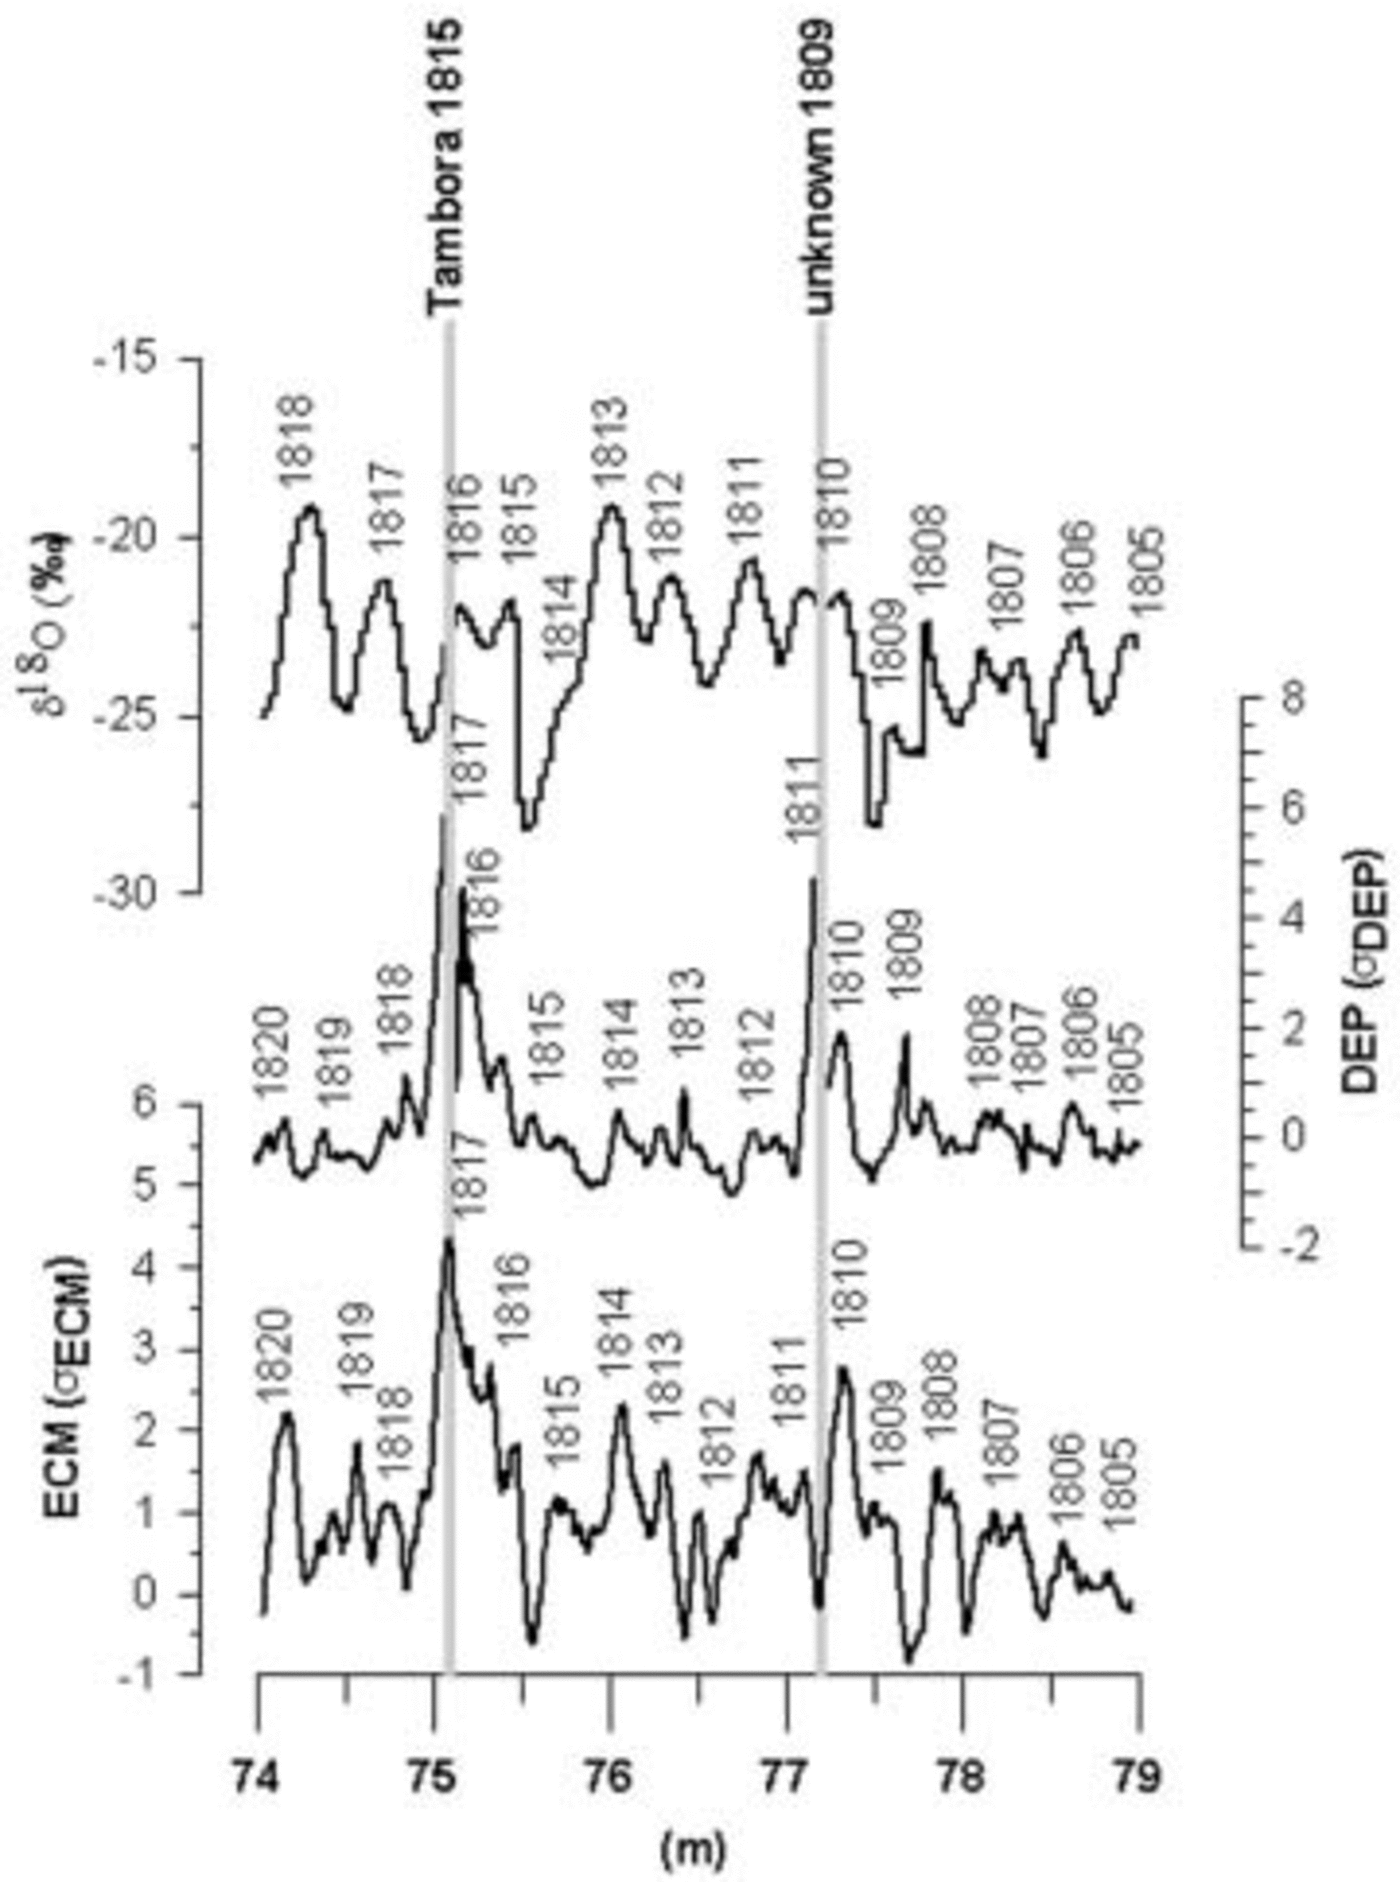
Fig. 3. Seasonal peaks in the δ18O, DEP and ECM records at 74–79m depth, around the eruptions of Tambora in AD 1815 and an unknown volcano in AD 1809.
Post-depositional processes (Reference JohnsenJohnsen, 1977) smoothed part of the S100 δ18O record, but it is still relatively easy to distinguish seasonal peaks along the whole ice core. Core S100 is estimated to cover the period AD 1737–2000 ± 3 years.
The dating error (due to incorrect identification of the volcanic peak, and the subjective aspect of the peak-counting method) is ±3 years for the entire core length, as obtained from the maximum difference between the known volcanic dates and the dates arrived at from layer counting.
Accumulation record
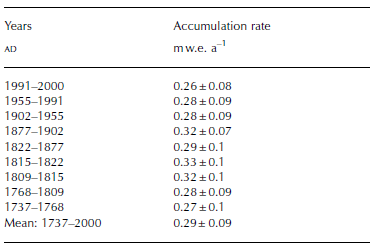
The annual accumulation rate was calculated using the summer maxima in the δ18O record as indicators of the annual accumulation increment. The mean long-term (1737–2000) accumulation rate is 0.29mw.e. a–1. The lowest annual accumulation is 0.08mw.e. a–1 (∼AD 1760) and the highest 0.58mw.e. a–1 (∼AD 1775). Large variability characterizes, in particular, the beginning of the 19th century and middle of the 20th century. Positive anomalies in accumulation dominate in the period AD 1840–1930, while negative anomalies are observed for most of the 20th century. Relatively high accumulation rate (0.33mw.e. a–1) characterizes the time-span AD 1815–22, while low accumulation rate (0.26mw.e. a–1) is observed for period AD 1991–2000 (Table 2). Both annual and smoothed accumulation data are presented in Figure 4.
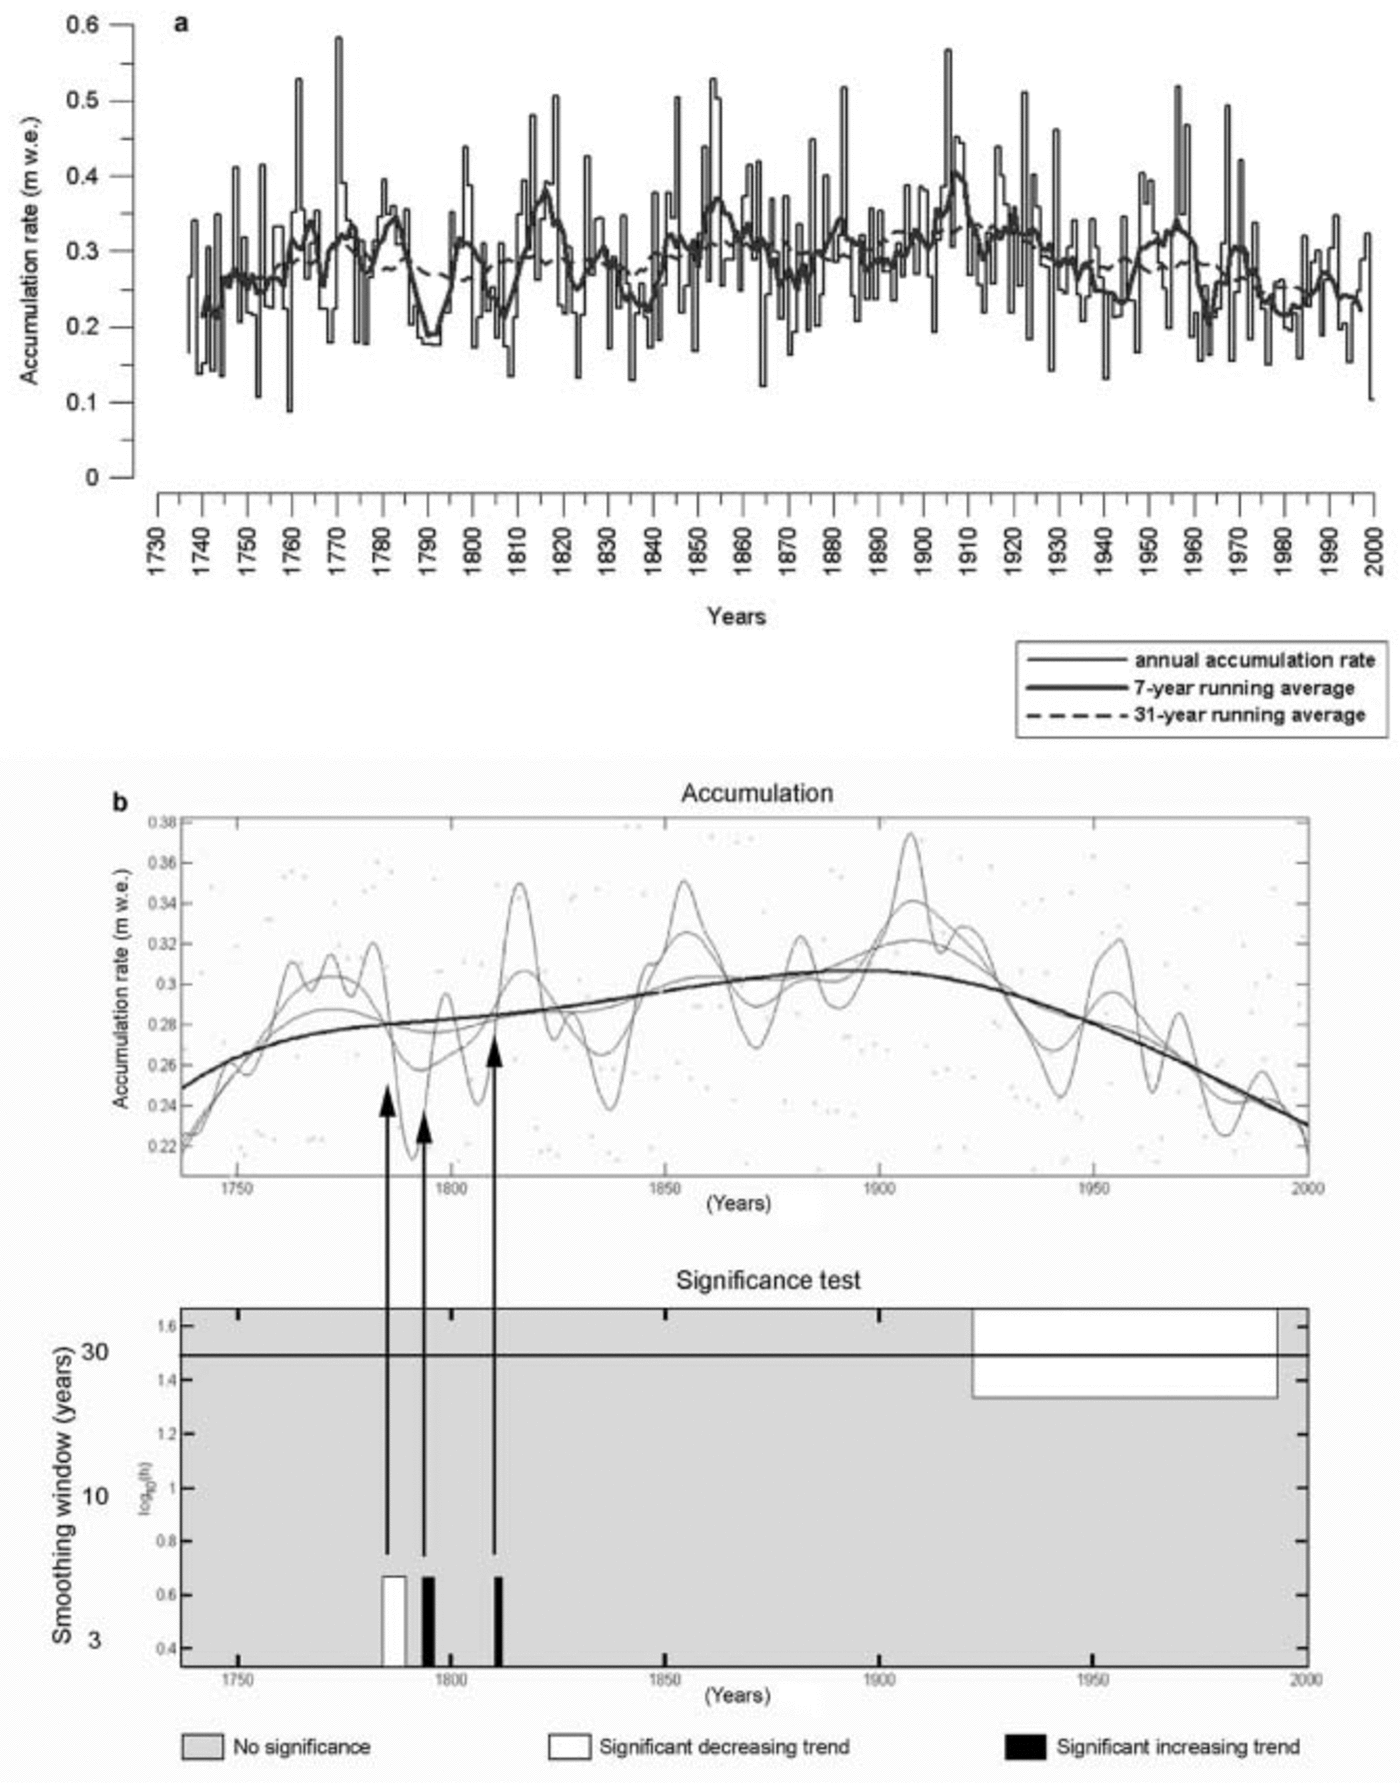
Fig. 4. (a) Annual accumulation rates (thin black solid line) derived from the δ18O records for ice core S100 smoothed with 7 year running mean (black solid curve) and 31 year running mean (black dashed curve). (b) SiZer analysis of trends (Reference Chaudhuri and MarronChaudhuri and Marron, 1999) in accumulation record. Upper panel: dots: annual accumulation values derived from ice core S100; lines: family of smooths obtained for various versions of the bandwidth (h). Lower panel: SiZer significance test (confidence level 95%) showing decreasing trend in accumulation since 1920 at long time-scales (approximately 30 years). Colour coding in SiZer: grey: no significant trend; black: significant increase; white: significant decrease.
Table 2 Accumulation rates for the last 263 years derived from the
In spite of large interannual accumulation variability, a decreasing trend during the 20th century was found in the S100 record. The significance of this trend (at 95% confidence level), that starts around AD 1920, is confirmed by using SiZer. The family of different smooths indicating a decrease during this particular period is presented in the upper panel of Figure 4. A SiZer map is the final result of this statistical treatment (Fig. 4 lower panel). A significantly positive derivative (increase) in the SiZer map is marked as black, while a significantly negative derivative (decrease) is marked as white. At locations where the derivatives are not found to be significantly different from zero, the colour grey is used (Reference Godtliebsen, Olsen and WintherGodtliebsen and others, 2003).
This decrease is visible only for the long time-scale (corresponds to a roughly 30 year window) (Fig. 4).
A few short-term trends are also indicated by SiZer. A decrease in accumulation was observed in AD 1780 while two decades later, and around AD 1810, an increase in accumulation rate is visible on a 3 year time-scale. During the time-span with positive anomalies in the accumulation record (AD 1840–1930) a slight increase in accumulation is found, but this trend is not significant on any time-scale.
SiZer assumes that data are independent; if data are dependent, a trend deemed significant by SiZer might be just a result of the high correlation between the neighbouring points within the dataset. The latter occurs especially on short time windows. We have found low lag-1 autocorrelation in each dataset for all presented ice cores. This suggests high reliability of the long-term decreasing trend obtained by the SiZer approach in this case. The slope of the decreasing (linear) trend has also been found significant (Fig. 5).
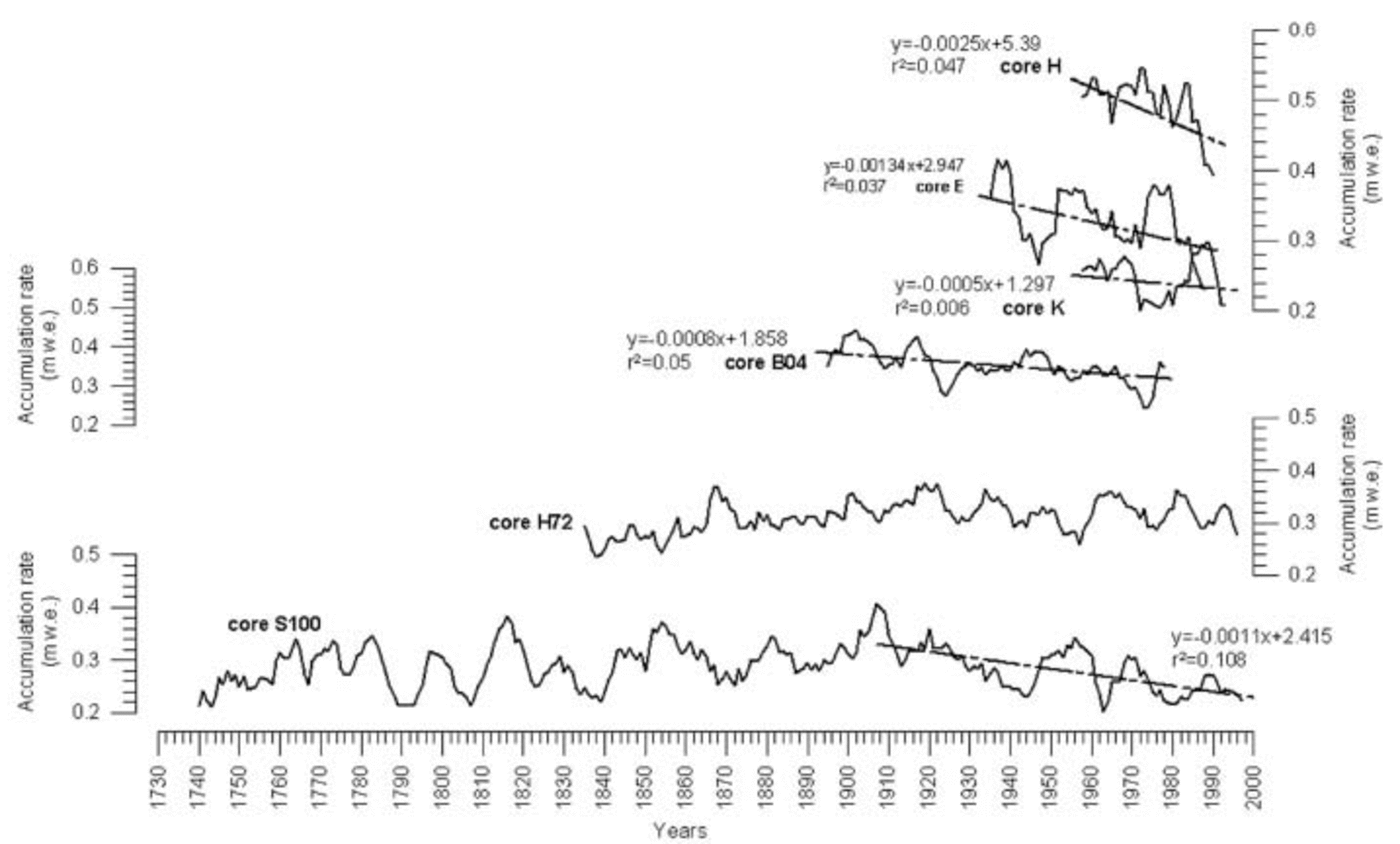
Fig. 5. Trends in annual accumulation records (smoothed with 7 year running means) for ice cores S100, B04 (Reference Schlosser and OerterSchlosser and Oerter, 2002a), E (Reference Isaksson, Karlén, N., Mayewski, Whitlow and TwicklerIsaksson and others, 1996), H and K (Reference Isaksson, van den Broeke, Winther, Karlöf, Pinglot and GundestrupIsaksson and Melvold, 2002) in DML. The data from core H72 are presented, but no significant trend has been found for this core in the 20th century (Reference Palmer, van Ommen, Curran, Morgan, Souney and MayewskiNishio and others, 2002).
S100 ECM and DEP records as mean values between the volcanic horizons and percentage deviation from the long-term mean (AD 1737–2000)
An analysis of the spectral density was also performed, but no significant periodicity has been found in the S100 accumulation record.
Discussion
Several studies from coastal areas of DML report large accumulation variability, both spatial and temporal (e.g. Reference MelvoldMelvold, 1999; Reference Schlosser and OerterSchlosser and Oerter, 2002b). Recent studies from DML, however, suggest a decrease in accumulation in the 20th century (e.g. Reference Isaksson and MelvoldIsaksson and Melvold, 2002; Reference Schlosser and OerterSchlosser and Oerter, 2002a) (Fig. 5). Data from ice core B04 (Fig. 5) show that accumulation decreases throughout the entire period covered by the core (AD 1892–1981) (Reference Schlosser and OerterSchlosser and Oerter, 2002a). A decreasing trend starting around AD 1932 was found in the accumulation record from core E in western DML (Reference Isaksson and MelvoldIsaksson and others, 1996; Fig. 5). The lowest values for this core were found in years AD 1980–89. A weak decreasing trend in cores from Fimbulisen (H and K; Fig. 5) is reported by Reference MelvoldMelvold (1999). We therefore conclude that the decreasing accumulation throughout the 20th century found in the data for core S100 is in agreement with other studies from (western) DML (Fig. 5).
Data from eastern DML (core H72; Fig. 5) indicate an increase in accumulation before AD 1900 and no significant trend thereafter (Reference Palmer, van Ommen, Curran, Morgan, Souney and MayewskiNishio and others, 2002). However, the increasing trend is not statistically significant Reference Palmer, van Ommen, Curran, Morgan, Souney and Mayewski(Nishio and others, 2002).
According to Reference MulvaneyMulvaney and others (2002), accumulation records from two ice cores (R1 and B25) drilled on Berkner Island (Fig. 1) do not show the same pattern as DML cores. No trend in long-term accumulation was detected there, although core R1 shows a clear increase in accumulation from around AD 1920, while accumulation rate for core B25 remained constant. Reference MulvaneyMulvaney and others (2002) report that a periodicity in accumulation rate with a 50 year frequency was found in the B25 dataset.
The decreasing accumulation during the 20th century seen in available data is therefore assumed to be constrained to western DML.
High variability in accumulation over a larger area of DML can be partly explained by variations in cyclonic activity (Reference King and TurnerKing and Turner, 1997). According to Reference Van LipzigVan Lipzig (1999), a high temporal variation in accumulation is characteristic for flat coastal areas (like DML), where atmospheric disturbances are frequent and can penetrate relatively far inland. Regionally large differences in accumulation can also be explained by complex patterns of precipitation controlled by orography and snow redistribution by katabatic winds (e.g. Reference Graf, Moser, Oerter, Reinwarth and StichlerGraf and others, 1988; Reference MelvoldMelvold, 1999; Reference SchlosserSchlosser, 1999). As reported by Schlosser and Oerter (2002a, b) wind influence is the main reason for large temporal and spatial variations in accumulation near Neumayer station.
The accumulation decrease during the 20th century might be a result of change in cyclonic trajectories. Reference SchlosserSchlosser (1999) reports less frequent low-pressure systems over Neumayer during the 1980s, which supports the indication of a change in cyclone routes. An intensive sublimation can also be an important term in the mass balance of low-lying areas in Antarctica, where relatively high surface temperatures allow for significant water-vapour pressures at the snow surface (e.g. Reference Van den BroekeVan den Broeke and others, 1999).
Conclusion
The use of three independent data records (δ18O, DEP and ECM) permits reliable dating of a 100m long coastal Antarctic ice core (S100). It was possible to identify several volcanic horizons, despite the fact that coastal cores have a smaller signal-to-noise ratio in the electrical conductivity record due to increased acidity of the ice (marine input). This core was dated to AD 1737 with an estimated error ±3 years. The mean annual accumulation is 0.29 mw.e. a–1 ± 0.1. However, the record shows high variability within the whole period covered by the core, and a statistically significant decreasing trend in the 20th century. The latter is in agreement with results from several other cores from western DML.
Acknowledgements
The authors wish to thank all participants in NARE 2000/01 who assisted in the field. A. Boas, E. Chrillesen and A. Carrasco are thanked for their help with the δ18O sampling, DEPand ECM measurements. H. Goodwin drafted Figure 1. This work is a contribution to the ‘European Project for Ice Coring in Antarctica’ (EPICA), a joint European Science Foundation (ESF)/European Commission (EC) scientific programme, funded by the EC and by national contributions from Belgium, Denmark, France, Germany, Italy, the Netherlands, Norway, Sweden, Switzerland and the United Kingdom. This is EPICA publication No. 69.


