Introduction
There is a continuing accumulation of evidence that the arctic climate is warming: the sea-ice cover has showed diminished extent, seasonal duration and thickness particularly for multi-year ice (Reference Rothrock, Yu and MaykutRothrock and others, 1999; Reference Cavalieri, Parkinson and VinnikovCavalieri and others, 2003). this has been accompanied by large fluctuations in the first-year (FY) ice extent characterized by rapid retreat of the ice from the coastal zone early in the melt season. the retreat is accelerated by feedback interactions between solar radiation and the ice cover that act to modulate changes in input of solar radiation to the ice and ocean, synoptic-scale atmospheric variability, the length of the melt season and the rate of fall freeze-up.
Determination of the physics of these interactions, development of suitable parameterizations, and proper inclusion of them in regional and large-scale energy-balance models requires a detailed understanding of a wide range of small-scale processes (Reference Ebert, Schramm and CurryEbert and others, 1995; Reference Arbetter, Curry, Holland and MaslanikArbetter and others, 1997; Reference Holland, Schramm and CurryHolland and others, 1997), particularly during the melt season when radiative forcing is strongest. local-scale processes associated with the coastal sea ice (primarily FY ice), bare tundra and coastal lakes are critical components of the system and apply over an extensive zone. FY sea ice makes up more than one-third of the maximum sea-ice cover, and lakes cover up to 50% of the coastal tundra in siberian and north american arctic lowlands.
The evolution and interaction of the mass and energy balance of the different coastal surface types is largely unexplored, however, and comparison with corresponding processes in the central pack is needed to provide an accurate model of the system as a whole. the arctic coastal zone is a critical area for several reasons. radiation-driven melting processes act early and strongly at the coastal boundaries of the ice pack where spatial albedo contrasts are very large. land-ice boundaries are particularly sensitive areas. snowmelting over land surfaces proceeds faster and occurs earlier than over sea ice, and near-surface summer temperatures can rise well above freezing. this provides an advective heat source for the ice, and the summer ice melt begins and propagates out from the coasts. changes in albedo and ice thickness during the melt season follow the same pattern as in much of the central pack, but proceed at significantly greater rates.
Experimental Program
The coastal zone in the vicinity of barrow, alaska, USA, is particularly well situated for studies of these kinds of interactions. this area provides site stability and easy accessibility so that detailed temporal coverage is practical for a modest investment of logistics effort. we carried out a comprehensive study in this area over a 3 year period, designed to characterize the annual cycle and evolution of sea-ice properties on local to intermediate scales in the arctic coastal zone. the program also included monitoring of the snow cover and the temperature regime of the adjacent tundra and lakes.
This involved concurrent studies of the mass balance of the snow and ice; the interaction of shortwave radiation with the shore-fast ice and the adjacent land surfaces; the evolution of the morphology (area coverage, surface topography and distribution) and albedo of the various surface types; the physical processes involved in the formation and evolution of melt ponds; and dynamic interaction of the ice with the coast. data were obtained from detailed surface-based studies and from aircraft photography.
The program was carried out from november 1999 through june 2002 at the four principal sites shown in figure 1a. for continuous monitoring of the seasonal evolution, automated stations were deployed during the late fall and visited periodically to retrieve the data. in april and from late may through the end of june (just before ice break-up), intensive on-site observations were carried out to characterize cold-season conditions and monitor the transition to and evolution of the melt season when ice conditions evolved rapidly and were highly non-uniform.
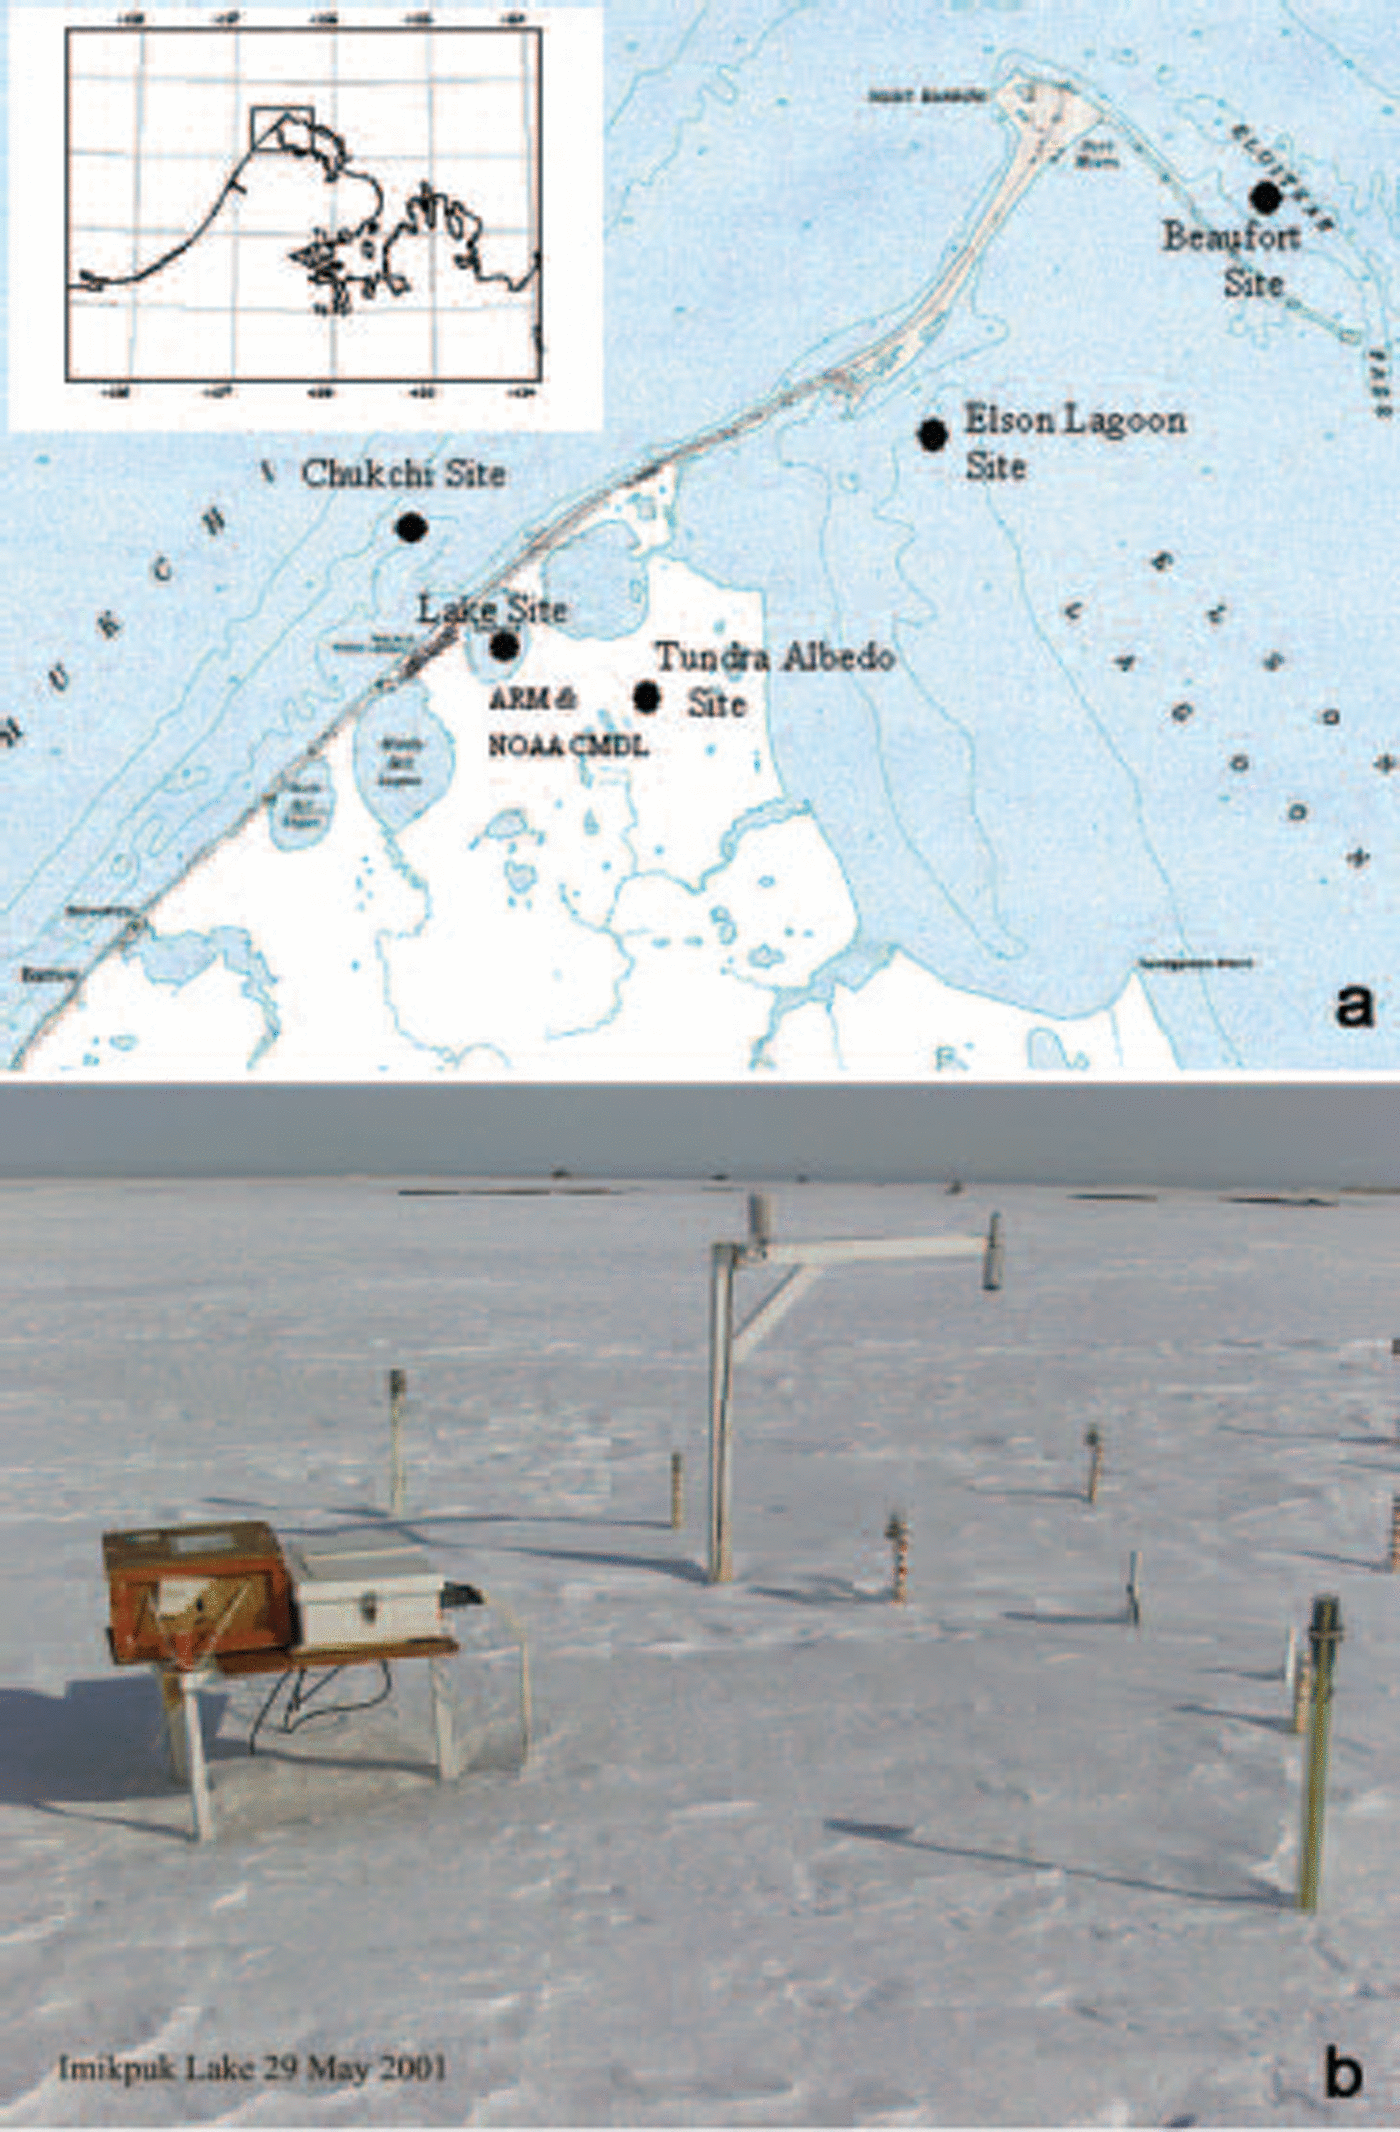
Fig. 1. (a) Site map. Principal observation sites: Chukchi Sea (CS), shore-fast FY ice; Elson Lagoon (EL), a salt-water lagoon; Imikpuk Lake (IM), freshwater tundra lake; and tundra (TU) in the protected Barrow Environmental Research Area. The Beaufort site (BS) was equipped with an automatic mass-balance monitoring buoy. ARM & NOAA CMDL is the Atmospheric and Radiation Measurement (ARM) Program and US National Oceanic and Atmospheric Administration (NOAA) Climate Monitoring and Diagnostics Laboratory. (b) Automated mass-balance instrumentation at IM showing data logging and control module, topside acoustic pinger, snow- and ice-depth gauges.
The automated measurements included (i) vertical temperature profiles using thermistor strings extending from the air through the snow and ice into the upper part of the water column (or 0.8m into the tundra), (ii) snow depth using an array of 16 depth gauges designed to be read without disturbing the local snow cover, and (iii) ice thickness using heated wire/crossbar gauges. data were collected at each site at 2–4 week intervals during the cold season and every 2–3 days during the melt season. the instrumented site on elson lagoon is shown in figure 1b. during the on-site intensive measurement periods we observed spectral albedos, spectral transmissivity profiles through ice, ice salinity profiles, melt-pond areal coverage and water depth, and surface topography of undeformed ice.
The fifth site, in the beaufort sea just to the east of point barrow, was equipped with an automatic monitoring station during 2001 and 2002 to record the thickness and temperature profiles. the array of sites covered three dynamically distinct sea-ice zones, the tundra and a freshwater lake.
To extrapolate the surface-based observations to larger spatial scales, aerial-photographic survey flights were carried out during the melt season over an area of about 100 km2 including the surface sites and covering the coastal sea ice and adjacent land.
Results
Snow cover
Snow thickness vs time is shown in figure 2 for the three sea-ice sites. the chukchi site was established first each year and spanned most of the season. it showed a steady build-up of snow throughout the winter followed by a marked increase in april and may to a maximum depth of 0.40 m. the maximum snow depth on elson lagoon was the same. the total snow accumulation decreased in 2001 and again in 2002. snow-depth measurements at the end of the ice-growth season along a 200m profile suggest that average snow depths over undisturbed ice are lower, indicating that despite their small cross-section (20×50 mm) the snow gauges (as well as the surrounding installations) may have contributed to catchment of drifting snow at these sites. the onset of melt in both 2000 and 2001 occurred on about 1 june and the snow melted away in 7–10 days. in 2002, the melt began 2 weeks earlier and the undrifted snow was almost completely melted by 1 june.
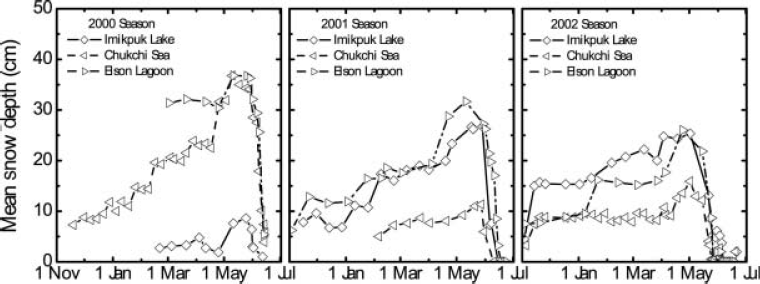
Fig. 2. Snow thickness vs time during the three seasons at the IL, CS and EL sites.
Snow density evolution was similar in all three years. shortly after deposition, the density in the windpack reached a value of about 0.33 (±0.01)mgm–3 during the cold season, typical of winter windpacked conditions. at the base of the snow was a layer of depth hoar with a density of approximately 0.15 mgm–3. for the deeper snowpacks, this layer reached about 0.05–0.1m in thickness in may, while for the thinner cases (imikpuk lake (im) in 2000 and chukchi sea (cs) in 2001 and 2002) there was only a trace of depth hoar. at the onset of melt, melting at the surface and percolation of the water produced a layer of superposed ice at the snow–ice interface and destroyed the depth-hoar layer. during the melt, the snow density increased to near 0.4 mgm–3 due to compaction and recrystallization under warm conditions. this picture is consistent with snowpack evolution described in a previous experiment (Reference PerovichPerovich and others, 1998).
A time series was not obtained for the tundra since automatic stations were installed only at the ice sites, but observations in mid-to late april or early may showed that the maximum mean snow depth was 0.31, 0.30 and 0.28 m in 2000 through 2002 respectively. the surface of the tundra was very uneven while the surface of the drifted snow was relatively flat in late spring. as a result, the standard deviation for snow depth was approximately 0.1 ma–1, and the maximum depth was essentially the same for all three years. as at the three ice sites, the bulk of the snow on the tundra melted away in about 7–10 days, although the thickest snow remained for an additional 3–4 days.
It is evident from figure 2 that the maximum snow depth for the ice sites generally decreased and that there were significant site-to-site differences each year. this is probably due in part to differences in wind strength and drift patterns combined with ice surface conditions during initial snow deposition, which can influence the roughness of the ice surface and the tendency of blowing snow to adhere to it. unfortunately, we do not have direct observations to test this hypothesis.
Mass balance
figure 3 shows the full mass balance at the ice sites for the 2000 season. establishment of the ice cover occurred in early october 1999, and ice growth proceeded into the beginning of the following june to a maximum of 1.54, 1.49 and 1.92m of growth at the cs, elson lagoon (el) and im sites respectively. the greater ice thickness at the im site was primarily due to the much thinner snowpack and to the higher thermal conductivity of the freshwater ice. although differing slightly in magnitude, the temporal pattern shown is also representative of the two following years. maximum ice thicknesses for those cases were 1.6 m at cs on 1 june in both 2001 and 2002. for the el site the corresponding values were 1.54 and 1.6 m.

Fig. 3. Mass balance at the ice sites for the 2000 season. The curves at the top of each panel give the air temperature at 2 m. The water temperature is shown at the bottom. The central panel shows snow thickness (gray) and ice thickness (interface between red and dark-blue contours). The contours show the temperature structure within the ice. The temperature scale is shown at the right.
As in 2000, the ice surface ablation in 2001 began in early june as soon as the snow cover had melted away. ice-melt rates and the corresponding heat fluxes are shown in figure 4. the axes on the right side give the net heat flux associated with a given melt rate of ice assuming a density ρ ice = 0.9 mgm–3 and a heat of fusion L f = 335 j g–1. the heat flux for 1–10 june is actually underestimated by a factor of 2.3 since the snow rather than ice was melting during that interval. the actual heat fluxes are indicated by the open diamonds. for comparison with a central arctic case during a vigorous melt season, we consider the results of Reference Perovich, Grenfell, Richter-Menge, Light, Tucker and EickenPerovich and others (2003, fig. 9) for the Sheba (surface heat budget of the arctic ocean program) melt season.

Fig. 4. Site-averaged melt rates and heat fluxes for top and bottom surfaces of the sea ice at Barrow in 2001. The open diamond symbols denote the actual heat-flux values for the snowmelt period.
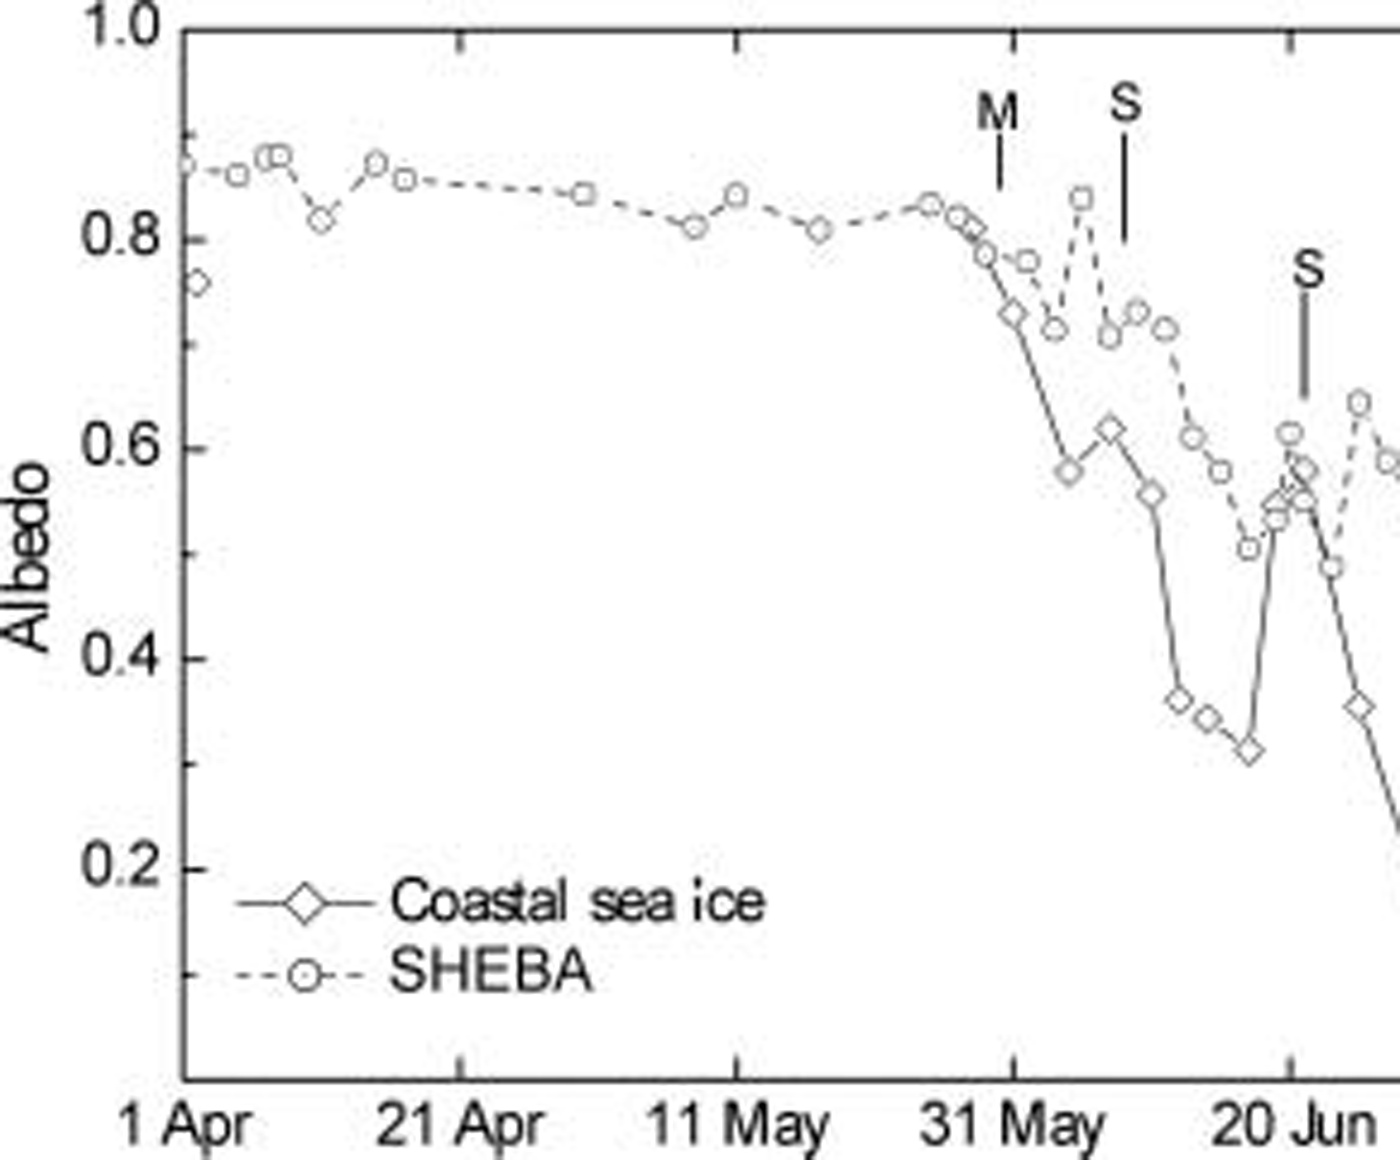
Fig. 5. Total albedos vs time for coastal sea ice over the 2001 observation season. Melt onset and two snowfall events are indicated as M and S respectively for the coastal ice sites. Results from the SHEBA experiment (1998) are indicated by the dashed line.

Fig. 6. Strip mosaics from the 2001 season before melt onset and during the interval of well-developed melt pond.
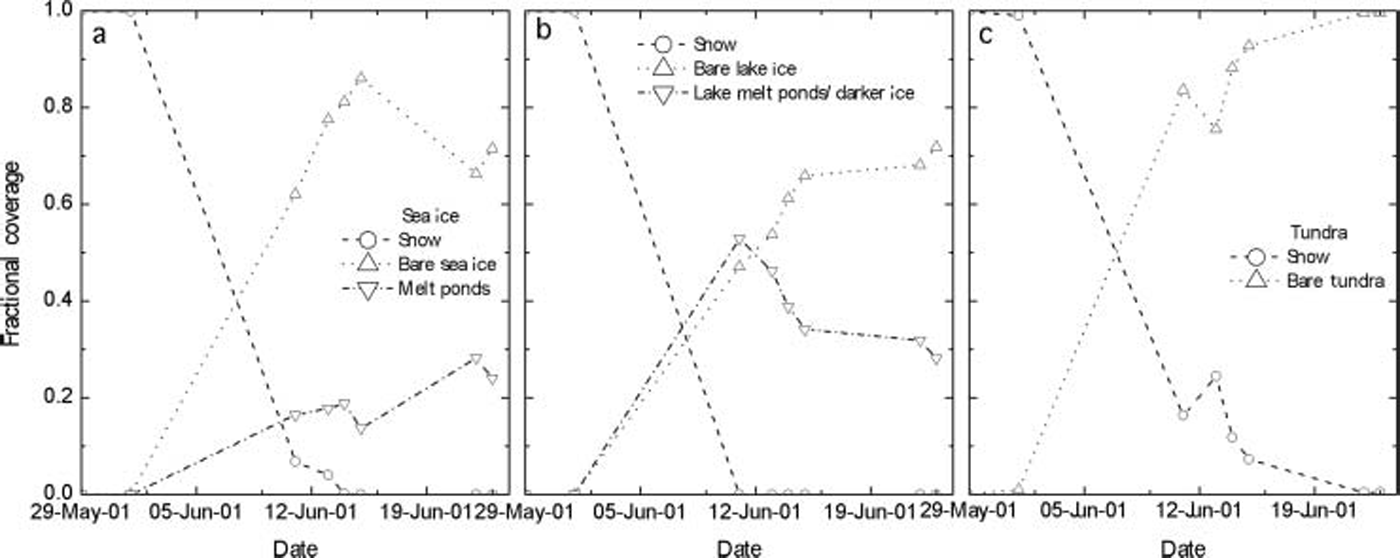
Fig. 7. Surface albedo evolution from aircraft mosaics for sea ice (a), lake ice (b) and tundra (c) during the 2001 season.
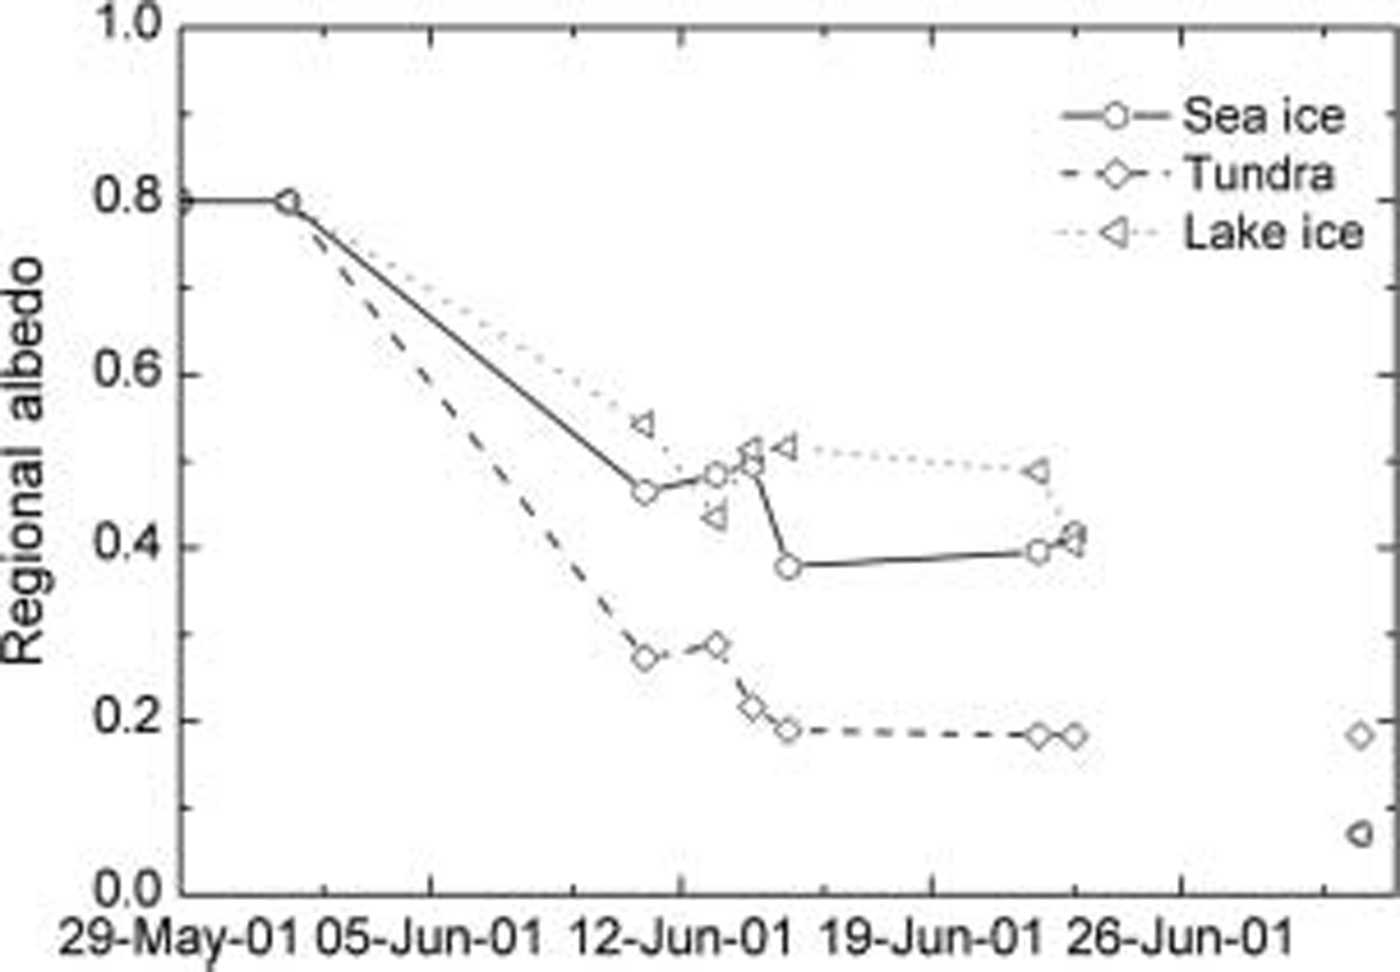
Fig. 8. Regional albedo vs time for sea ice, tundra and freshwater lakes over the 2001 spring and early summer season.
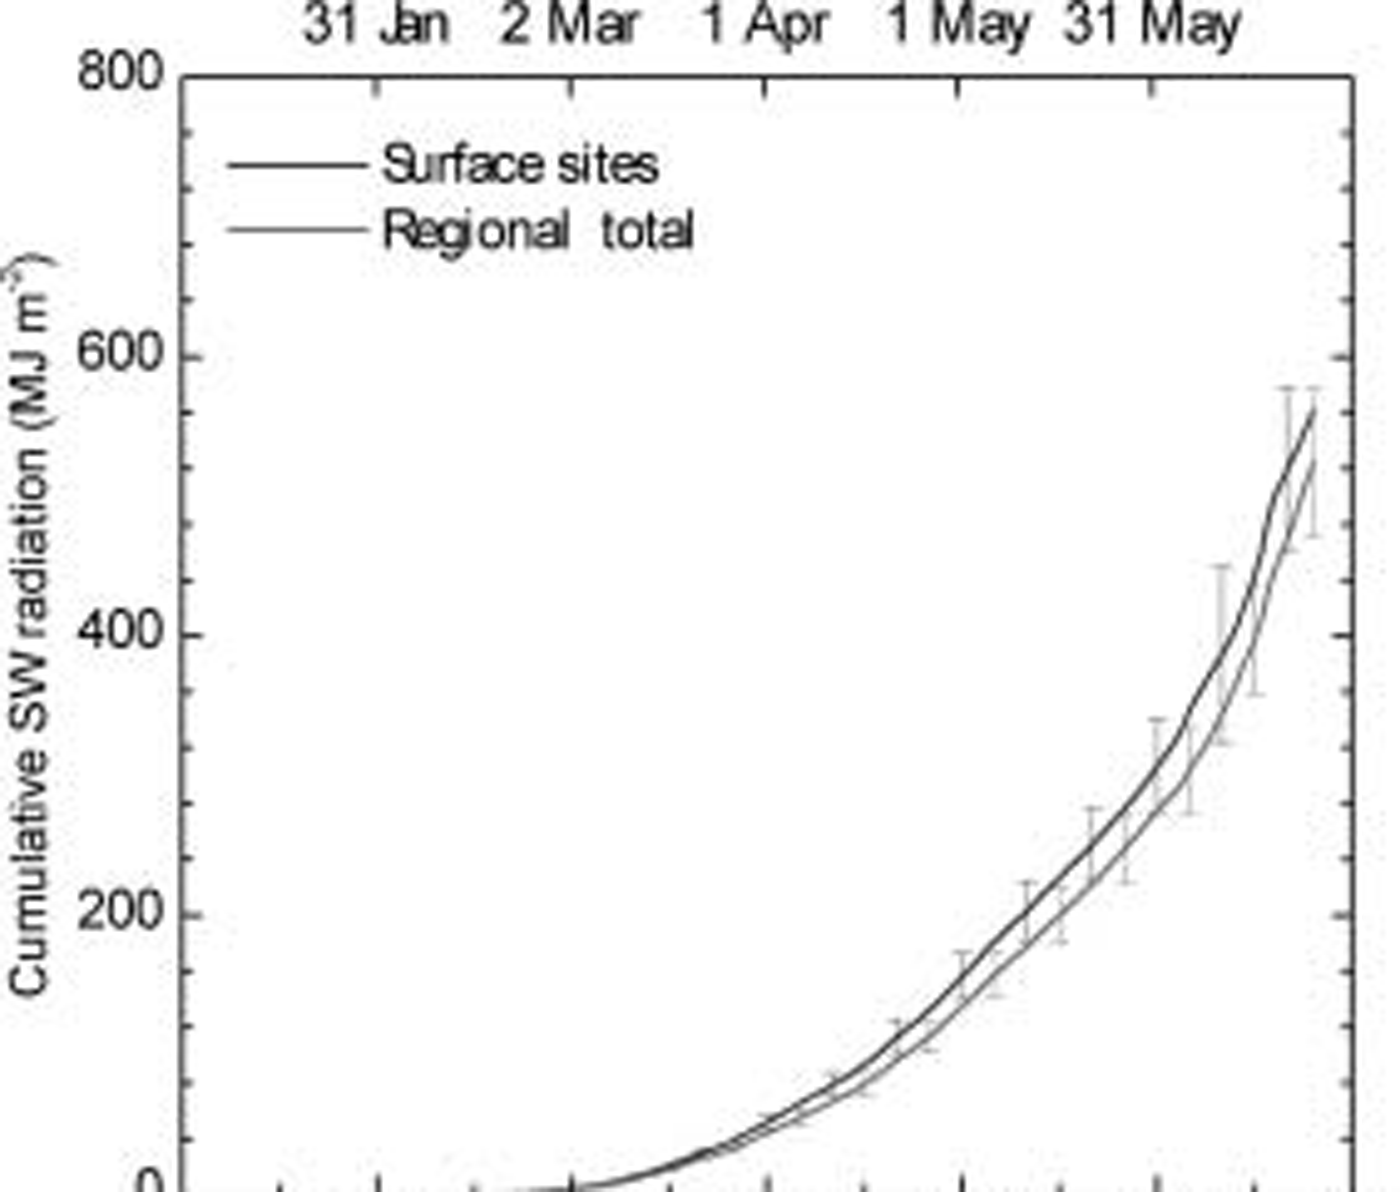
Fig. 9. Averaged shortwave energy input at the sea-ice sites for 2001.
During the peak of the melt season, surface and bottom ablation rates at barrow were as high as 0.05 and 0.028mice d–1 respectively in mid-june, corresponding to heat fluxes of 175 and 90wm–2. the corresponding maximum melt rates for SHEBA were slightly less than half as large: 0.024 and 0.012 md–1. it is clear that melt rates in the coastal zone were significantly greater than at the site in the central pack. after break-up of the coastal pack, the remaining ice melted away completely, but we were not able to monitor the progress during that period. melt rates at barrow during the other years were of the same order of magnitude, although the details differed in response to interannual variations in the synoptic weather patterns.
Surface albedo
Observations of total shortwave albedo, α, were carried out using a kipp & zonen albedometer as an integral part of the intensive observation program. measurements were made each year in april to obtain the stable winter values and were resumed in late may through late june to cover the variations during the onset and development of the melt season until the ice became unstable. observations were taken at 2.5 m intervals along 200m lines at each site and the results averaged to obtain a representative value for the various sites. a compilation and extended discussion of the full albedo dataset has been presented by Reference Grenfell and PerovichGrenfell and perovich (2004). for the present discussion, we make use of results from 2001 for the sea ice. the seasonal evolution of total albedo for that year is shown in figure 5. the corresponding results from SHEBA (Reference Perovich, Grenfell, Light and HobbsPerovich and others, 2002) are also plotted to provide a comparison with the central arctic.
Considerable temporal variability is present due to synoptic weather events as well as hydrographic effects involved in melt-pond equilibrium (Reference Eicken, Grenfell, Perovich, Richter-Menge and FreyEicken and others, 2004). these show significant inter- and intra-annular fluctuations. in general, with the onset of melt, the albedo at the ice sites decreased steadily as the ice decayed except for two episodes of snowfall as indicated. these events deposited only a few cm of new snow, and the layers remained on the ice for 2–4 days. the final albedo values after the ice had melted are taken to be 0.07 following Reference Pegau and PaulsonPegau and paulson (2001).
When melt ponds were present, the ice surface was usually inhomogeneous on a small enough scale that the instrument was recording a mixture of ponded and bare ice. in order to determine the albedo of individual areas of bare and ponded ice, we recorded a visual estimate with each observation of the percentage of ponded ice in the field of view. a linear regression of albedo vs this percentage was then extrapolated to 0 and 100% to determine α bare ice and α MP, the melt-pond albedo. a description and illustration of the analysis is presented by Reference Grenfell and PerovichGrenfell and perovich (2004, fig. 7b).
Using this method, we found that the albedo for bare coastal ice showed qualitative behavior consistent with previous observations at barrow (Reference Grenfell and PerovichGrenfell and perovich, 1984) and comparable to those reported for multi-year (MY) ice (Reference Perovich, Grenfell, Light and HobbsPerovich and others, 2002) consistent with the different melt rates as mentioned above. of particular significance is that the albedo for drained ice was quite stable throughout the melt season. we found α FY∽0.6 for bare FY ice as compared with α MY∽0.64 from the SHEBA data.
Regional albedo
The 200 m spatial averages of albedo described above cover a relatively small distance scale but provide well-defined directly measured albedos for the individual surface types. of interest for large-scale modeling, however, is the shortwave input over regional areas on the order of 100 km2 or more. to address this, we extended the present set of surface-based observations, combining the site albedos with areal distributions of surface types determined from high-resolution aircraft photography.
A digital camera was mounted looking vertically downward in a specially outfitted cessna 185 aircraft operated by terra-terpret inc. we carried out photographic survey flights in may and june at altitudes of 700–1700 m. strip mosaics were generated from each series of images and analyzed to monitor the relative areas of different surface types. two representative mosaics are shown in figure 6. these show the contrast between conditions just prior to the onset of melting and after melt ponds were well established.
In 2001, the low cloud conditions were such that we were able to complete eight flights spaced over the melt season from late may through 23 june. each flight covered the same grid pattern perpendicular to the coast from 3 to 5 km inland out to the edge of the flaw lead, a distance of 3–10 km depending on the extent of the coastal ice cover at the time. the flaw lead is a persistent feature of the local ice pack generated by the differential motion of the offshore ice relative to the shore-fast ice providing a natural boundary for the coastal zone ice cover.
The fractional area of each surface type, A s, was determined using the image-processing software package envi®, with the results shown in figure 7. individual surface types were selected objectively in each mosaic from histograms of the pixel brightness and red–green–blue (rgb) color distributions of the digital images. the isolation of the various classes selected was verified by examining three-dimensional scatter plots to make sure there was no significant overlap among the clouds of points assigned to the various surface types.
We isolated and identified the following classes: snow cover, bare ice, dark bare ice, light melt ponds, dark melt ponds, light bare lake ice, dark bare or ponded lake ice, open water and bare tundra. not all classes were present in a given mosaic. for the analysis we separated out areas of sea ice, lake ice and tundra to minimize ambiguity in classification. for clarity of presentation, we have combined the light and dark sea-ice and light and dark pond categories into bare sea ice and melt ponds respectively. the classes of dark lake ice and ponded lake ice have also been combined because the occurrence of ponds on the lake ice was rare and of short duration, and the dark areas typically replaced the ponds when the surface water percolated into the ice.
Individual values of total albedos, α s, were assigned by combining the end-point values for each surface type using the method described above. assignment of light vs dark types involved selection of sub-intervals of certain traverses where the surface was noted as dark, dirty or clean in the field record. the values used here are given in table 1. the uncertainties shown in the bottom row are based on standard deviations from the 200 m transects. regional albedos were then calculated using the equation:
Table 1. Total albedos, α s, of the various surface types included in the calculation of regional albedo during 2001

Where s spans the number of surface types observed at a given time for each region considered. the results are presented in figure 8 and represent a spatial average over distance scales on the order of 10 km. all three surfaces had the same value of α R = 0.8 in winter because they were covered with an optically thick overlying snow cover. as the melt season developed, α R then decreased to individual lower summer values. the final values for early july assume that the sea ice and lake ice have disappeared, leaving open water. we have also assumed that the tundra albedo remained the same as the last measured value. the results in figure 8 are generally consistent with the site averages shown in figure 5. unfortunately, flying conditions were limited by the persistent low-level cloud conditions, precluding a more detailed time series.
Discussion
Model calculations by Reference Maykut and UntersteinerMaykut and untersteiner (1971; hereafter mu) indicate that if the summer albedo of the sea ice itself decreases below 0.47 the ice pack will disappear after 2–3 years. while the snow depths we observed decreased each year, they were still close to the climatological value of 0.3 m used in the mu model, so we expect the model to provide a reasonable approximation to the barrow case. our value of about 0.4 is significantly below the 0.47 limit, indicating that the decay should be correspondingly more rapid, consistent with the annual break-up of the coastal ice near point barrow. while the model does not take into account a variety of dynamical effects, the decay of the ice and the decrease in local ice concentration magnifying the dynamical behavior and associated feedbacks are certainly accelerated by the lower albedo.
figure 9 shows a comparison of the cumulative amount of shortwave (sw) radiation transmitted into the sea ice at the sea-ice sites with the corresponding regional values. these were calculated using the above-observed albedo sequences in conjunction with total incident sw energy fluxes provided by the us national oceanic and atmospheric administration (noaa) climate monitoring and diagnostics laboratory (cmdl) (personal communication from r. stone, 2002) from the integral F inc (1-α s) dt. albedo sets were interpolated onto a daily grid, and the above integral was evaluated numerically through 23 june, the date of the last regional albedo analysis. the series for the surface sites was continued through 11 august, and the details are presented in Reference Grenfell and PerovichGrenfell and perovich (2004).
The regional total sw energy input reached 524 mjm–2 by 23 june vs 561 mjm–2 for the surface site analysis. the regional totals are slightly below the surface site totals, probably because the albedos were slightly higher away from the coastline; however, the two curves fall within the error bounds of each other. in fact, the cumulative total for the el site alone was 518 mjm–2. we conclude that the analysis of the surface sites with a 200 m sampling distance gave a good representation of the regional values. these results do not include the effects of open leads, which were scarce in the present study. although the influence of leads would need to be taken into account in a more general setting, the albedo is well known for open water (e.g. Reference Pegau and PaulsonPegau and paulson, 2001), so this would only require data on the fractional coverage of leads in the areas in question.
By 11 august the total for the surface sites reached 1279 mjm–2. since 3mjm–2 are needed to melt 0.01 m of ice, assuming 100% efficiency, enough energy was absorbed to melt the full thickness of the coastal ice cover by about mid-june and 4.2 m of ice by 11 august, more than 2.5 times the maximum ice thickness of about 1.6 m. this is consistent with the total disappearance of the coastal ice in july. the error bars shown are based on variations among individual sites and represent estimated values of standard deviation. these are not representative of interannual variations, though. in general, inter-site differences depend on the dates of melt onset and ice break-up as well as snowpack accumulation and decay, but in a given year the albedo evolutions at the sites considered here are correlated in the sense that they respond to the same synoptic weather conditions. interannual variations can be significantly larger (Reference Grenfell and PerovichGrenfell and perovich, 2004).
We note that a physics-based model for the evolution of melt ponds taking into account the melt rate, surface geometry, meltwater percolation and runoff has been developed incorporating data from the present field experiment (Reference Eicken, Grenfell, Perovich, Richter-Menge and FreyEicken and others, 2004). while a number of questions remain, this work provides the formulation of the problem and the basis for future development.
An effect of probable climatological importance raised by Reference Grenfell and OverpeckGrenfell and others (2003) with regard to melt-pond modeling in a warming environment is the spatial redistribution of melt ponds following early melt onset followed by a significant freeze-up associated with increasing instability in weather conditions. this effect is likely to accompany a warming trend, as typified by the 2002 melt season that began 2 weeks earlier than expected. in this case, the melt ponds refroze completely, essentially becoming lake ice, and the spatial distribution of the ponds was significantly modified when melting resumed.
The lower albedo of bare FY ice compared to MY ice is due in large part to the presence of suspended particulate material (SPM) in the FY ice blown out from the shore and/or suspended in the water at the time of freeze-up. pigmented organic material can also produce a significant influence. we expect that this will be an important consideration throughout the entire arctic coastal zone.
The complete dataset for this experiment has been compiled on dvd disks. it is available from the first author upon request.
Conclusions
A comprehensive field study was carried out near barrow to characterize local- to intermediate-scale sea-ice processes in the arctic coastal zone of central importance to the annual cycle and evolution of the coastal sea ice. this period spans an interval of significant warming and increasing retreat of the ice pack. maximum snow depths decreased from 2000 to 2002 from 0.38 m to 0.26 m but they are still within the range of the local climatology. maximum ice thickness was in the range 1.4–1.6m for undeformed FY ice and 1.7–1.9m for lake ice. ice-melt rates in 2001 were 0.05 and 0.028 md–1 at the top and bottom of the sea ice respectively, two to three times larger than in the central arctic. detailed surface-based albedo observations combined with aircraft photography were combined to calculate regional albedos for the late spring and early summer of 2001 ranging from 0.8 for all snow-covered surfaces to approximately 0.4 for sea ice and lake ice and 0.18 for bare tundra.
Lower albedos and greatly accelerated melting in the coastal zone relative to the central pack show that the coastal zone experiences significantly different environmental conditions from the central pack. understanding the partitioning of sw radiation by the coastal ice cover depends on determining the presence in the ice of foreign material such as SPM and pigmented ice biota and can provide insight into the behavior of the general pack under accelerated warming conditions. for example, the unusually early melt onset of 2002 (14 may) presented a modified situation that is not described by a simple temporal extrapolation of the melt-season length. this involved an instability in the weather associated with warming that modified the spatial distribution of the ponds in an unexpected way. observations of the type presented here are critical for understanding sub-gridscale processes associated with satellite observations and large-scale heat and mass-balance modeling.
Acknowledgements
This effort was supported by the us national science foundation grants opp-9910888 and opp-0454900. logistical support by the barrow arctic science consortium (basc) and veco is gratefully acknowledged.


