


The prevalence of gaming is increasing rapidly worldwide, particularly among adolescents and young adults (Gao et al., Reference Gao, Wang and Dong2022). Excessive gaming is associated with adverse outcomes, including poor health, impaired daily functioning, sleep deprivation, lack of physical activity, academic underachievement, and involvement in problematic behaviors (El Asam et al., Reference El Asam, Samara and Terry2019). Recognizing the significance of this issue, the Diagnostic and Statistical Manual of Mental Disorders 5 (DSM-5; American Psychiatric Association, 2013) has included internet gaming disorder in its appendix as a condition warranting further study. Identifying risk factors for excessive gaming is crucial for developing effective prevention and intervention strategies.
Among the various risk factors, peer influence has been consistently highlighted as a significant contributor to gaming addiction (GA; Gunuc, Reference Gunuc2017; C. Li et al., Reference Li, Yu, Zhang, Lv, Liu and He2024; Tan et al., Reference Tan, Liu, Yang, Hui, Zhang, Chen and He2024; Wang et al., Reference Wang, Li, Wong and Yang2024). Two primary mechanisms — peer selection and peer socialization — have been proposed to explain the role of peers in the development of addictive behaviors (Simons-Morton & Farhat, Reference Simons-Morton and Farhat2010). Peer selection refers to the tendency of individuals to form friendships based on shared attitudes, behaviors, or other characteristics. For instance, adolescents who engage in heavy drinking or marijuana often form friendships with others exhibiting similar behaviors, reinforcing these behaviors over time (Barnett et al., Reference Barnett, DiGuiseppi, Tesdahl and Meisel2022; Becker et al., Reference Becker, Marceau, Hernandez and Spirito2019). In the context of GA, adolescents with an interest in gaming may actively select friends with similar gaming preferences. The multiplayer nature of many online games further facilitates this process by encouraging collaborative play.
Peer socialization, on the other hand, involves the influence of peers’ behaviors and attitudes on an individual. This effect can manifest through direct or indirect pressure to conform to social norms (Laursen & Veenstra, Reference Laursen and Veenstra2021). Gaming peers often act as role models, providing access to gaming, encouraging participation, and reinforcing gaming behaviors. Prior research supported this process. For example, J. Y. W. Wu et al. (Reference Wu, Ko, Wong, Wu and Oei2016) demonstrated that the frequency of peers’ invitation to play internet games directly and indirectly predicted severity of internet gaming addiction. While peer selection and socialization processes can operate independently, they frequently interact reciprocally. Recent research by Li et al. (Reference Li, Yu, Zhang, Lv, Liu and He2024) using a cross-lagged panel model demonstrated that both processes jointly promote online gaming behaviors within adolescent friendship groups. Specifically, adolescents were more likely to form friendships with peers exhibiting similar online gaming behaviors, which subsequently reinforced their own gaming habits.
Twin studies have shown that GA is substantially heritable, with heritability estimates ranging from about 50% to 70% (M. Li et al., Reference Li, Chen, Li and Li2014; Long et al., Reference Long, Verhulst, Neale, Lind, Hickie, Martin and Gillespie2016; Vink et al., Reference Vink, van Beijsterveldt, Huppertz, Bartels and Boomsma2016). Previous twin studies using subsamples of the present study similarly reported genetic influences accounting for approximately 70% of the variance in GA (Hur, Reference Hur2024; Lee & Hur, Reference Lee and Hur2024). These findings underscore the importance of exploring gene-environment interplay; specifically, gene-environment correlation (rGE) and gene-environment interaction (G x E) in the relationship between GA and peers’ gaming. Gene-environment correlation occurs when genetic predisposition affects the likelihood of being exposed to environmental risk, resulting in a correlation between genetic factors and environmental risks (Plomin et al., Reference Plomin, DeFries and Loehlin1977). If individuals genetically predisposed to GA are more likely to form friendships with gaming peers and, furthermore, contribute to their peers’ gaming, a correlation (genetic overlap) may be found between genetic influences on GA and peers’ gaming. Evidence for rGE has been observed in many forms of psychopathology. For example, the social environment such as peer rejection has been found to be influenced by genetic factors that also contribute to symptoms of depression (Brendgen et al., Reference Brendgen, Vitaro, Boivin, Girard, Bukowski, Dionne, Tremblay and Pérusse2009).
Gene-environment interaction refers to differential impact of environmental factors on genetic vulnerabilities, such that the impact of environmental factors vary depending on genetic vulnerabilities and vice versa (Plomin et al., Reference Plomin, DeFries and Loehlin1977). In this context, peer gaming behavior may modulate the genetic and environmental contributions to GA, resulting in varying degrees of influence. Although gene-environment interplay has been extensively studied in substance addiction, its role in GA remains underexplored, particularly in twin studies. Given the growing prevalence of gaming, understanding these mechanisms is essential. Using data from South Korean adolescent and young adult twins, the present study aimed to investigate the role of gene-environment correlation and gene-environment interaction in the relationship between GA and close friends’ gaming (CFG). Specifically, the study will examine how genetic and environmental factors influence peer selection and socialization processes, thereby shedding light on the etiological mechanisms underlying the relationship between GA and CFG.
Methods
Sample
The sample was drawn from respondents to an online survey regarding GA and related traits conducted by the Korea Twin Research Institute (KTRI) in 2022−2023. The survey link was uploaded to online communities in various universities across the nation as well as on the websites of the KTRI and twin clubs in South Korea. The final sample for this analysis included 1462 twins: 431 pairs of monozygotic (MZ) twins and 4 individuals without cotwin data, and 297 pairs of dizygotic (DZ) twins and 2 individuals without cotwin data. Participants were aged 15 years to 29 years (mean = 22.63 ± 2.8 years). Among the DZ twins, 130 complete pairs were opposite-sex twins. Females outnumbered males (64% vs. 36%), partly due to mandatory military service for young adult men in South Korea and the tendency of females to respond more frequently to online surveys (M. J. Wu et al., Reference Wu, Zhao and Fils-Aime2022). Although efforts were made to recruit late adolescents and young adults evenly, about 76% of the participants were young adults (age ≥ 20 years).
Zygosity of twins was determined using four questions assessing the physical similarity of twins, the frequency of confusion about twins by others, and the self-perception of zygosity based on a zygosity questionnaire developed by Ooki et al. (Reference Ooki, Yamada and Asaka1993). Twins with ambiguous zygosity were excluded from data analysis. The higher proportion of MZ twins compared to DZ twins (59% vs. 41%) reflects twin birth rates in South Korea in the 1990s and early 2000s (Hur, Reference Hur2021).
Measures
Gaming addiction (GA)
GA was assessed using a Korean Game Addiction scale developed by Choi et al. (Reference Choi, Ryong and Kim2013). The scale comprises 20 items measuring tolerance, withdrawal, compulsive use of games, impairment of self-control, impairment of daily activities, excessive time consumption for gaming, and continued gaming despite problems within the past one year. An example item is: ‘I tried to reduce or stop playing games several times but failed’. Twins rated the 20 items on a 4-point Likert-type scale (0 = not at all true to 3 = almost always true) scale. Total scores were created by summing the responses over the 20 items. The scores of GA ranged from 0 to 60, with higher scores indicating greater symptom severity. If the score is 19 or higher, it can be classified as being at risk for addiction (Choi et al., Reference Choi, Ryong and Kim2013). About 13% of the present sample fell into the category. The scale demonstrated good psychometric properties (Choi et al., Reference Choi, Ryong and Kim2013). In this sample, the Cronbach alpha reliability for 20 items was 0.96.
Close friends’ gaming (CFG)
CFG was assessed using a single self-report item. Twins were asked whether their close friends played games (0 = no, my close friends do not; 1 = yes, my close friends play games, 2 = don’t know). Responses of don’t know (n = 122) were treated as missing values.
Statistical Analysis
The twin method compares MZ twins, who share 100% of their genes, with DZ twins, who share an average of 50% of their genes. The total variances and covariance of GA and CFG were decomposed into three components: Genetic (A), shared environmental (C), and non-shared environmental variance including measurement error (E). Genetic factors represent the average effect of all alleles influencing a trait; shared environmental factors are influences that make twins more similar; and nonshared environmental factors, including measurement error, contribute to differences between twins. Because twins are of the same age and gender, except for opposite-sex dizygotic (OSDZ) twins, failing to account for these factors when they contribute to variance could bias estimates of model parameters (McGue & Bouchard, Reference McGue and Bouchard1984). Thus, data from males and females were pooled to maximize statistical power and corrected for sex, age, and age × sex effects (McGue & Bouchard, Reference McGue and Bouchard1984). For GA (a continuous variable), multiple regression analysis was conducted. For CFG (a binary variable), logistic regression analysis was employed to correct for sex and age effects. Standardized residuals were used for model-fitting analysis. Parameter estimates in the full and best-fitting general sex-limitation univariate models using unadjusted data are provided in Supplementary Table 1.
To examine gene-environment correlation (rGE), bivariate Cholesky model-fitting analyses were conducted. This model estimates genetic, shared environmental, and nonshared environmental influences on GA and CFG. Additionally, the model partitions the genetic influences on the variance of GA into those common with CFG (representing genetic correlation) and those unique to GA. Similarly, the shared and nonshared environmental influences on the variance of GA are decomposed into those common with CFG (shared environmental correlation and nonshared environmental correlation, respectively) and those unique to GA. Thus, genetic (r g), shared environmental (r c), and nonshared environmental (r e) correlations reflect the extent to which GA and CFG share latent genetic and shared and nonshared environmental influences. Although the bivariate Cholesky model does not explicitly test for rGE, the presence of rGE can be inferred if the genetic correlation is significant, as the genetic correlation indicates whether the genes influencing GA also affect exposure to CFG.
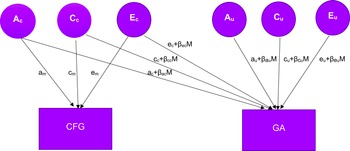
To investigate gene-environment interaction (G × E) effects, bivariate G × E model-fitting analyses were performed based on methods by Purcell (Reference Purcell2002) and van Sluis et al. (2012). In the model (Figure 1), CFG interacts with common genetic, shared, and nonshared environmental effects (Ac, Cc, and Ec respectively) and with those unique to GA (Au, Cu, and Eu respectively). The interaction effects of moderator (M: CFG in this study) were added to common (ac + βacM, cc + βccM, ec + βecM) and unique (au+ βauM, cu + βcuM, eu + βeuM) components. Regression weights (β terms) estimated from the data indicate the extent to which CFG (M) modifies the magnitudes of common and unique genetic, shared environmental, and nonshared environmental effects on GA. A significant interaction effect is identified if the β terms are significantly different from zero.

Figure 1. Bivariate G x E interaction model.
Note: The factors am, cm, and em represent genetic influences, shared environmental influences, and nonshared environmental influences respectively on the moderator (M), CFG. The latent factors Ac, Cc, and Ec represent genetic influences, shared environmental influences, and nonshared environmental influences, respectively, shared between CFG and GA. The latent factors AU, CU, and EU represent the genetic, shared environmental influences, and nonshared environmental influences unique to GA. CFG, close friends’ gaming; GA, gaming addiction; βacM, moderation of genetic influences common to CFG and GA; βauM, moderation of genetic influences unique to GA; βccM, moderation of shared environmental influences common to CFG and GA; βcuM, moderation of shared environmental influences unique to GA; βecM, moderation of nonshared environmental influences common to CFG and GA; βeuM, moderation of nonshared environmental influences unique to GA.
Mx software (Neale et al., Reference Neale, Boker and Xie2003) was used to perform model-fitting analyses. The raw data option in Mx calculates twice the negative log-likelihood (−2LL). Differences in −2LL were chi-square distributed, allowing the likelihood ratio tests to compare nested models. For non-nested models, Akaike’s information criterion (AIC = −2LL − 2df; Akaike, Reference Akaike1987) was used, with lower AIC values indicating more parsimonious models.
Results
Descriptive Statistics
Given that the twin sample constitutes paired data, descriptive analyses were conducted by dividing each twin pair into two groups: the first twin group, which completed the survey first, and the second twin group, which completed it later. For GA, males exhibited significantly higher mean scores than females in both twin groups (p < .001). However, age was not significantly associated with GA (r = .01 in both groups). MZ twins in the first twin group had significantly higher mean and variance for GA compared to DZ twins, whereas only mean was higher for MZ twins in the second twin group. The GA scale was significantly positively skewed (skewness index = 1.71; mean = 7.1, median = 2.0). About 35% of the sample received a score of zero on the scale, meaning they rarely played games. Due to the skewness of the GA scale, a log transformation was applied to approximate normality, resulting in a reduced skewness of 0.40.
The frequency of individuals responding ‘yes’ to the close friends’ gaming (CFG) question was higher than those responding ‘no’ in both groups (70% and 73% respectively). Males showed significantly higher frequencies of ‘yes’ responses to CFG compared to females in both groups (p < .001). There were no significant differences between MZ and DZ twins regarding CFG frequencies. Correlations of CFG with age were modest but significant (r = −0.08) in both groups, indicating that younger twins were more likely to respond yes to the CFG question.
GA and CFG were significantly positively correlated (r = 0.26, p < .001) in both groups, indicating that twins responding ‘yes’ to the CFG question demonstrated significantly higher GA scores than those responding ‘no’.
Bivariate Cholesky Model-Fitting Analysis
Table 1 presents the results of bivariate Cholesky model-fitting analysis. The full model was compared against two nested models: one excluding genetic variances and covariances (model 2) and another excluding shared environmental variances and covariances (model 3). Model 2 fit significantly worse than the full model (Δχ2 = 50.4, p < .01), whereas model 3 did not (Δχ2 = 2.2, p = .53). Further parameters reductions from model 3 (models 4 and 5) resulted in poor fits, leading to model 3 being selected as the best-fitting model. Table 2 presents parameter estimates from the full and best-fitting models. While the parameter estimates for CFG were similar in both models, genetic influences were lower and shared environmental influences were higher in the full model for GA, compared to those in the best-fitting model. The discrepancies in the estimates, along with the large confidence intervals for GA, are likely due to insufficient statistical power in the current sample to accurately estimate the parameters. In the best-fitting model, genetic influences accounted for 70% (95% CI [66%, 74%]) of variance in GA, and 32% (95% CI [23%, 40%]) of variance in CFG. Nonshared environmental influences explained 30% (95%CI [26%, 34%]) of GA variance and 68% (95% CI [60%, 77%]) of CFG variance. A significant genetic correlation (r g = .37; 95% CI [0.24, 0.49]) was observed between GA and CFG, suggesting genetic predisposition toward GA may influence CFG. The nonshared environmental correlation was also significant but modest (r e = .18; 95% CI [0.09, 0.27]).
Table 1. The results of bivariate Cholesky model-fitting analysis for gaming addiction and close friends’ gaming

Note: −2LL, -2 negative log likelihood; AIC, Akaike’s information criterion. The best-fitting model is indicated in bold.
Table 2. Parameter estimates in the full and the best-fitting bivariate Cholesky model

Note: CFG, Close friends’ gaming; A, additive genetic influence; C, shared environmental influence; E, nonshared environmental influence including measurement error; r g, genetic correlation; r c, shared environmental correlation; r e, nonshared environmental correlation.
Bivariate Gene-Environment (G x E) Interaction Model-fitting Analysis
Goodness-of-fit test statistics for the G x E interaction models are presented in Table 3. Removing all interaction parameters (i.e., βac, βau, βcc, βcu, βec, and βeu in Figure 1) from the full model significantly worsened the model-fit (model 2: Δχ2 = 19.6, p = .00), indicating that CFG interacts significantly with genetic and/or environmental influences on GA. Individual removal of interaction parameters (models 3 to 5) revealed that only the elimination of nonshared environmental interaction parameters (model 5) significantly worsened the fit (Δχ2 = 12.3, p = .00). These results suggest that CFG moderated nonshared environmental, but not genetic or shared environmental, influences on GA. Shared environmental variances and covariances were removed from the full model (model 6) without significant deterioration in fit (Δχ2 = 12.2, p = .10). Eliminating common and unique nonshared environmental interaction parameters individually from model 6 (models 7 and 8) resulted in poor fits, establishing model 6 as the best-fitting model.
Table 3. The results of bivariate G x E interaction model-fitting analysis for gaming addiction and close friends’ gaming

Note. The best-fitting model is indicated in bold. −2LL, −2 negative log likelihood; AIC, Akaike’s information criterion; βacM, moderation of genetic influences common to CFG and GA; βauM, moderation of genetic influences unique to GA; βccM, moderation of shared environmental influences common to CFG and GA; βcuM, moderation of shared environmental influences unique to GA; βecM, moderation of nonshared environmental influences common to CFG and GA; βeuM, moderation of nonshared environmental influences unique to GA.
Graphic Presentation of the Best-Fitting G x E Interaction Models
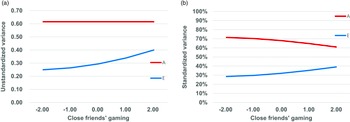
Figures 2a and 2b illustrate the changes of the unstandardized and standardized genetic and nonshared environmental variances for GA as a function of CFG in the best-fitting model. While genetic variance remained constant, nonshared environmental variance increased with higher levels of CFG, indicating that CFG altered nonshared environmental influences on GA (Figure 2a). In terms of relative contributions, genetic influences decreased from 71% at the lowest level of CFG to 61% at the highest level, whereas nonshared environmental influences increased from 29% to 39% (Figure 2b).

Figure 2. Changes of unstandardized (a) and standardized (b) variances of gaming addiction as a function of close friends’ gaming in SD units in the best-fitting model.
Discussion
The present study explored gene-environment interplay between close friends’ gaming behavior (CFG) and gaming addiction (GA) among late adolescents and young adults. Consistent with previous findings (Gunuc, Reference Gunuc2017; C. Li et al., Reference Li, Yu, Zhang, Lv, Liu and He2024; Tan et al., Reference Tan, Liu, Yang, Hui, Zhang, Chen and He2024; Wang et al., Reference Wang, Li, Wong and Yang2024), a significant phenotypic association was observed between CFG and GA. A significant genetic correlation between GA and CFG supported the role of gene-environment correlation, suggesting that individuals with a genetic predisposition for GA may selectively associate with peers who frequently engage in gaming. Furthermore, the results indicated that CFG modifies nonshared environmental influences on GA, amplifying these effects at higher levels of CFG. This pattern supported peer socialization effects as well.
Peers are generally considered environmental risk factors for gaming behavior. However, the study revealed that genetic influences explained 32% of the variance in CFG, with partial overlap with genetic influences on GA. This finding underscores that peer selection is not purely environmental but partially mediated by genetic influences. These results aligned with prior research on substance use, where genetic factors for substance addiction have been shown to influence exposure to peers with similar behaviors. For example, Fowler et al. (Reference Fowler, Shelton, Lifford, Rice, McBride, Nikolov, Neale, Harold, Thapar and van den Bree2007) found significant genetic correlations between friends’ and individuals’ alcohol use and problem use (r g = .6 ∼.7) in adolescent twins. Similarly, Harden et al. (Reference Harden, Hill, Turkheimer and Emery2008) demonstrated that genetic predispositions for alcohol and tobacco use in adolescents were linked to increased exposure to peers engaging in substance use. Recent studies using polygenic risk scores (PRS) for lifetime cannabis use among adult college students further confirmed modest but significant associations (r = .07, 95% CI [0.03, 0.11]) with peers’ substance use (Thomas et al., Reference Thomas, Salvatore, Gillespie, Aliev, Ksinan and Dick2021).
The model testing G x E effects indicated that environment-environment interaction was present in the relationship between CFG and GA, such that CFG increased nonshared environmental effects on GA. This pattern provided evidence for peer socialization effects wherein peers influence the development of GA independently of genetic risk. Affiliation with peers who frequently play games may shape individuals’ attitudes, perceived norms, and engagement in gaming. Mixed results on G x E effects were reported in studies of substance use. Twin studies generally supported the mechanism of diathesis-stress interaction, where peers’ alcohol and tobacco use amplify genetic risk for substance use (Meyer et al., Reference Meyer, Unger and Zheng2024; Zheng et al., Reference Zheng, Brendgen, Girard, Dionne, Boivin and Vitaro2019). However, studies using PRS of alcohol dependence failed to find significant interactions between perceived peer substance use and heavy drinking in adolescents and young adults (J. J. Li et al., Reference Li, Cho, Salvatore, Edenberg, Agrawal, Chorlian, Porjesz, Hesselbrock, Investigators and Dick2017; Zaso et al., Reference Zaso, Maisto, Glatt, Hess and Park2020).
Research on peer selection and socialization suggests dynamic shifts over time. Peer selection may exert stronger effects during the initial stages of friendship formation, while peer socialization processes become influential later (Abar & Maggs, Reference Abar and Maggs2010). It is likely that individuals initially select friends with similar gaming behaviors, and over time, these friendships reinforce engagement in gaming through shared norms, attitudes, and activities. Longitudinal, genetically informed studies are needed to capture the evolving dynamics of rGE and G x E effects on the relationship between GA and CFG across developmental stages.
Limitations
Several limitations should be considered when interpreting the findings. First, both GA and CFG were self-reported, which may introduce shared method variance, inflating their association. It has been argued that individuals’ perception of peers’ deviant behavior can be biased by projection and/or attribution (Kandel, Reference Kandel1996; Scalco et al., Reference Scalco, Trucco, Coffman and Colder2015). Since nonshared environmental influences in twin modeling included measurement error, the shared method variance could have been confounded with the nonshared environmental correlation between GA and CFG. Notably, the nonshared environmental correlation observed in the present sample was significant but modest (r e = .18), suggesting that the effect of correlated measurement error may not be substantial. However, future studies should employ objective assessments of CFG by directly collecting data from peers to reduce measurement error. Second, the genetic influence on CFG may be overestimated if MZ twins share more friends than DZ twins. However, previous research indicates that friendship formation itself is heritable (Boardman et al., Reference Boardman, Domingue and Fletcher2012), suggesting that the heritability estimate for CFG in the present study may not be seriously biased. Third, CFG was measured using a binary response format, lacking detailed measurement. Future studies should employ refined scales to capture various facets of CFG. Fourth, as shown in Supplementary Table 1, quantitative sex differences in genetic, shared, and nonshared environmental influences were significant for both GA and CFG, whereas qualitative sex differences were not. The sample size in the present study was insufficient to explore these differences in rGE and G x E interactions. Prior research indicated that males and females organize friendships differently, with males emphasizing joint activities and females prioritizing emotional intimacy (Rose & Rudolph, Reference Rose and Rudolph2006). Also, it has been reported that females were more susceptible to peer influences in gaming contexts (Liu, Reference Liu2016). It would be interesting for future research to examine gender differences in the etiological process of the relationship between CFG and GA in a larger sample. Finally, the sample comprised only of South Korean late adolescents and young adults, which restricts generalizability of the findings to other ethnic or age groups. Cross-cultural studies are necessary to examine the broader applicability of these results.
Conclusion
The present study highlights the dual roles of peer selection and socialization in the relationship between GA and CFG. Gene-environment correlation mediated the peer selection process, while environmental interactions contributed to the peer socialization process. These findings shed light on the complex interplay of genetic liabilities and social experiences in the development of GA. The results suggest that genetic and environmental influences on peer process need to be incorporated in developing prevention and intervention strategies.
Supplementary material
To view supplementary material for this article, please visit https://doi.org/10.1017/thg.2025.5


 Open access